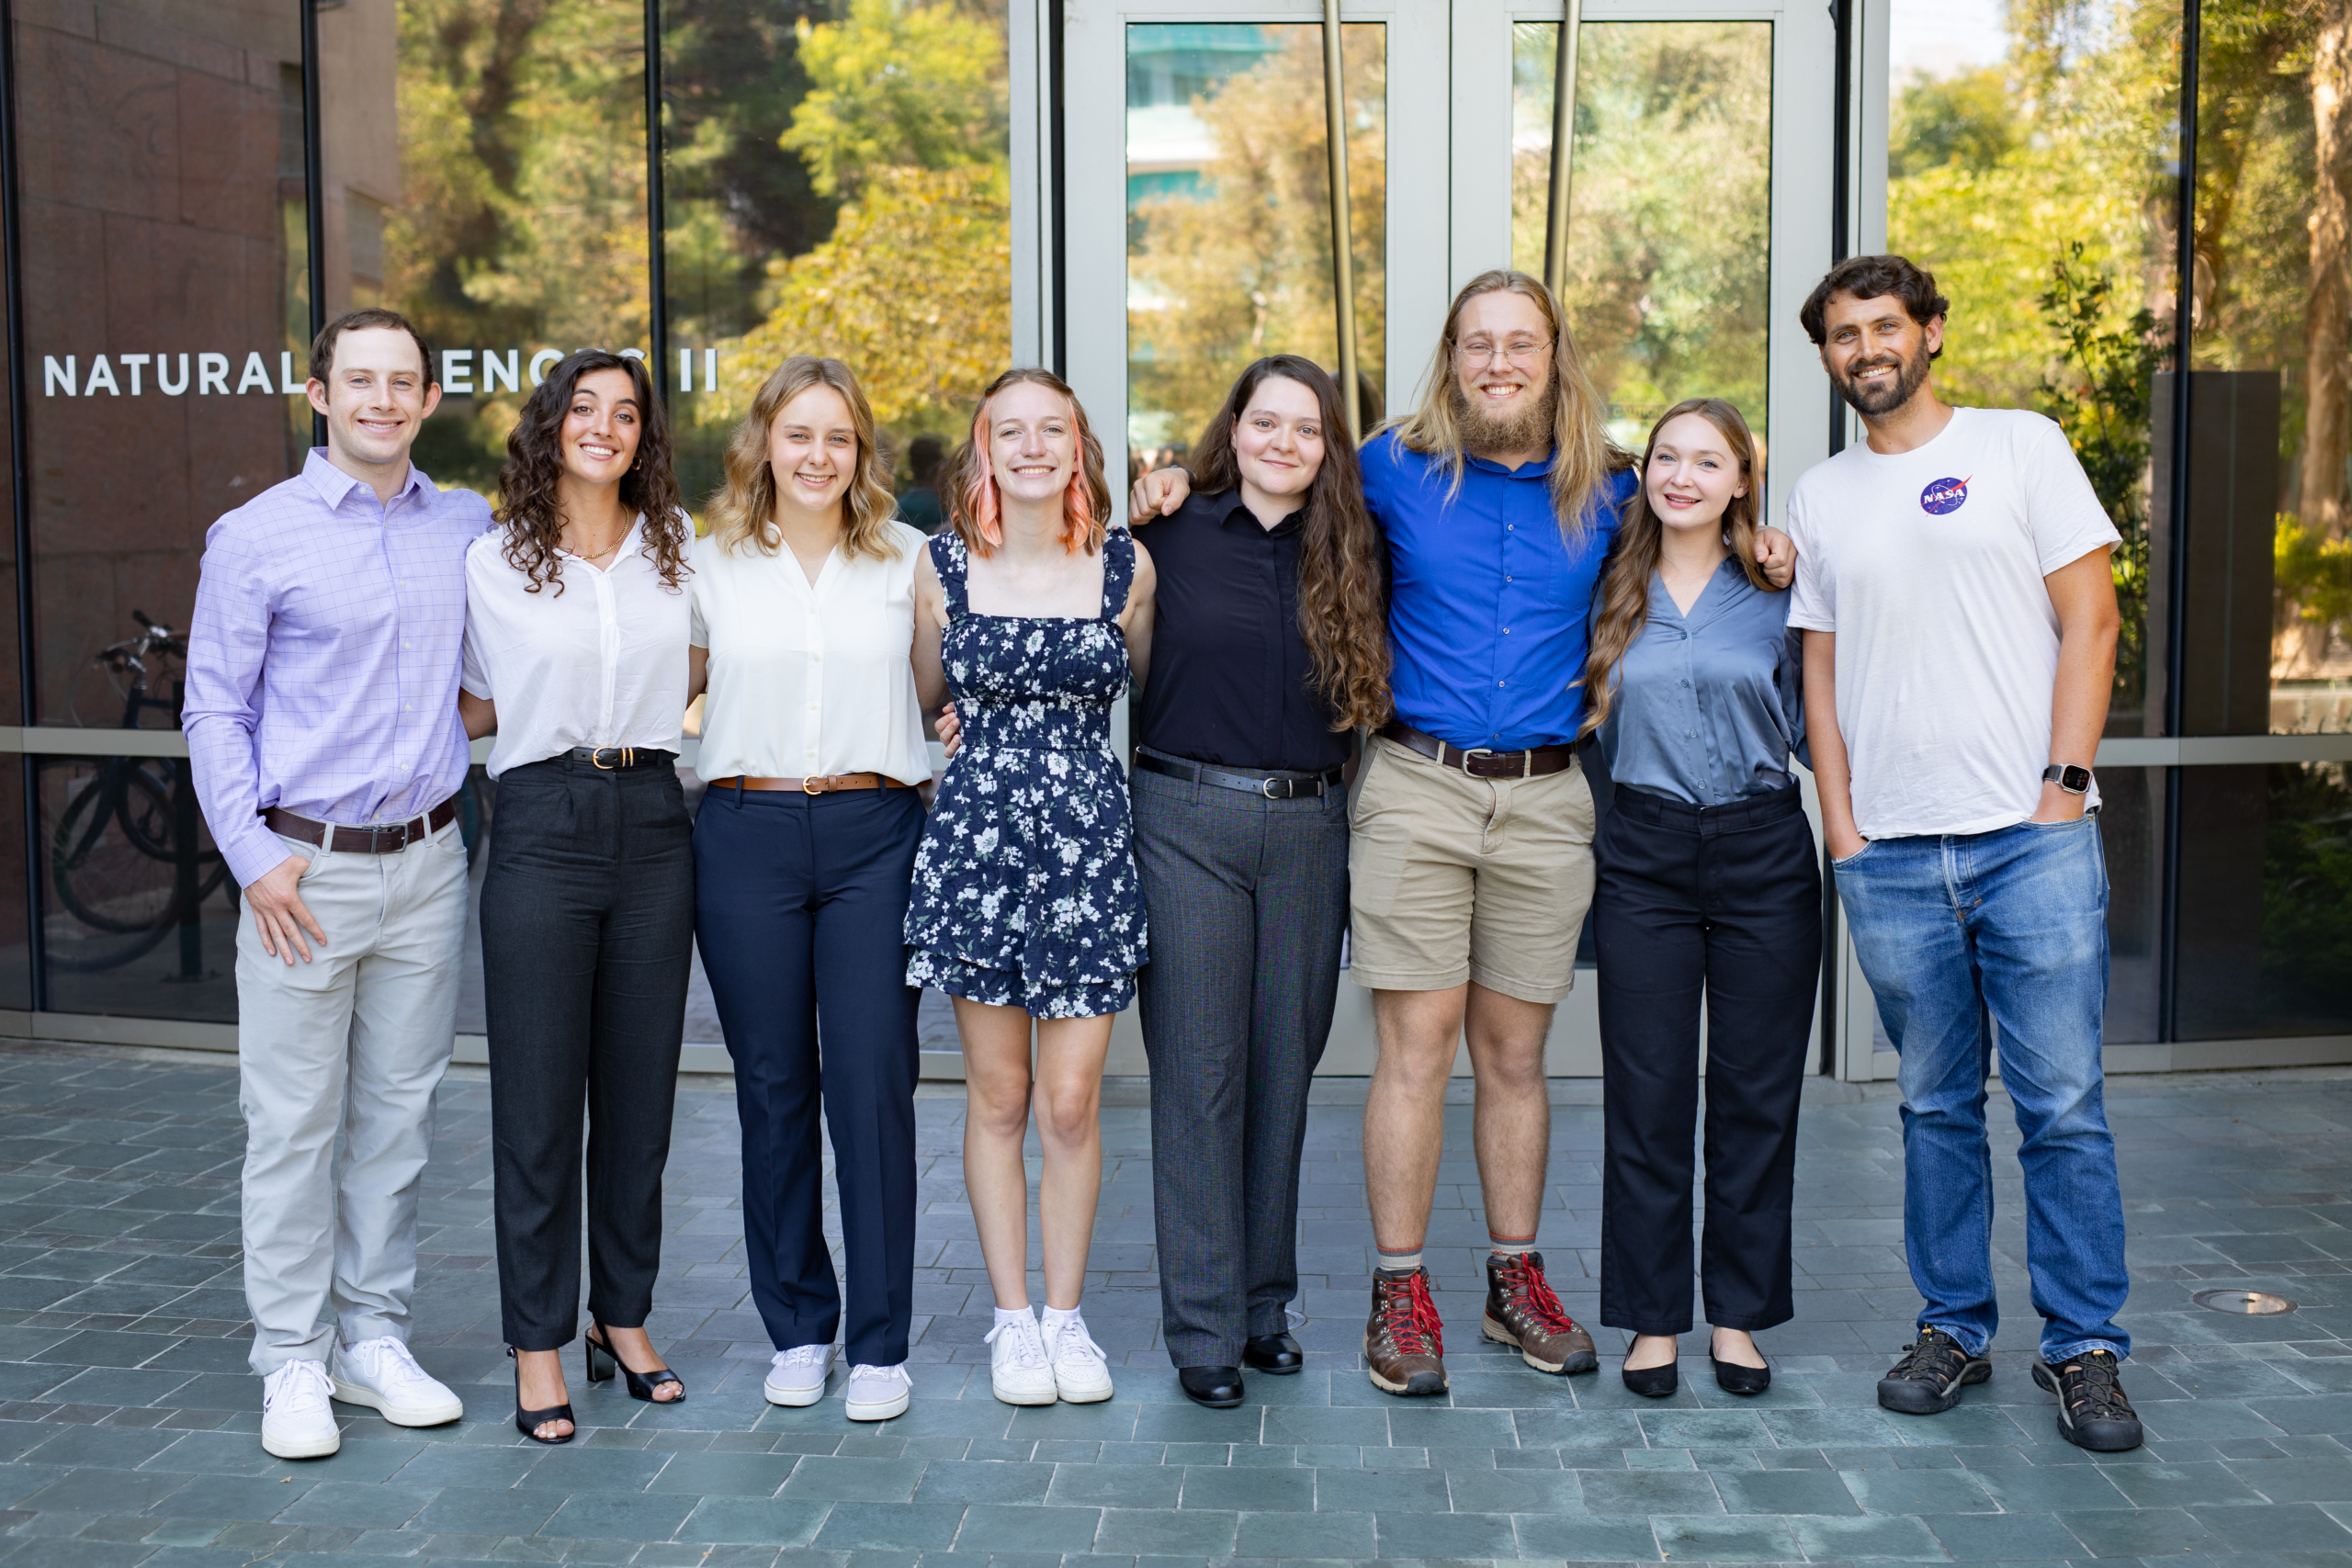
Faculty Advisor: Dr. Dan Sousa, San Diego State University
Graduate Mentor: Megan Ward-Baranyay, San Diego State University
Gerrit Hoving, Carleton College
Industrial-scale livestock farms, or Concentrated Animal Feeding Operations (CAFOs), are a major source of air pollutants including ammonia, methane, and hydrogen sulfide. Ammonia in particular is a major contributor to rural air pollution that is released from the breakdown of livestock effluent. Mitigating regional air pollution through improved waste management practices is only possible if emissions can be accurately monitored. However, ammonia is challenging to measure directly due to its short atmospheric lifetime and lack of VSWIR spectral signature. Here we investigate the potential for spectroscopic
imaging of the CAFO land surface to predict the presence of detectable ammonia emissions. Data from the Hyperspectral Thermal Emission Spectrometer (HyTES) instrument were found to clearly identify plumes of ammonia emitted by specific feedlots. Plume presence or absence was then tied to pixel-level reflectance spectra from the Earth Surface Mineral Dust Source (EMIT) instrument. Random forest classification models were found to predict ammonia plume presence/absence from VSWIR reflectance alone with an accuracy in the range of 70% to 80%. Our conclusions are limited by the limited number of
feedlots overflown by HyTES (n=96), the time gap between HyTES and EMIT data, and potential difficulty in comparing feedlots in different regions. While only tested over a modest area, our results suggest that ammonia plume presence/absence may be
predictable on the basis of surface features identifiable from VSWIR reflectance alone. Further investigation could focus on more comprehensive model validation, including characterization of the land surface processes and spectral signatures associated with feedlot surfaces with and without observable ammonia plumes. If generalizable, these results suggest that EMIT data may in some circumstances be used to predict the presence of ammonia emission plumes at feedlots in other areas, potentially enabling broader accounting of feedlot ammonia emissions.
Benjamin Marshburn, California Polytechnic State University- San Luis Obispo
California is experiencing rising temperatures as well as increased frequency and length of drought conditions due to anthropogenic climate change. Wildfires are an intrinsic component of California and its Mediterranean ecosystems. However, this change in natural wildfire behavior increases the risk to ecosystems including soil erosion, poor plant regrowth, and ash/nutrient runoff that leads to the ocean. Previous work has attributed phytoplankton blooms in the coastal ocean to runoff from wildfires. This study aims to quantify the extent to which the concentration of chlorophyll-a, an indicator of phytoplankton abundance, can be predicted by wildfire parameters in coastal California and to evaluate which parameters are the most important predictors. Due to climatic variation in California we split the coast into three regions, northern, central and southern, and analyzed three fires from each area. For each fire, the stream length connecting the most severely burned area and the ocean was derived from analysis of a digital elevation model acquired by the Shuttle Radar Topography Mission. Additionally, differenced Normalized Burn Ratio (dNBR) was used to analyze burn severity for each fire. The change in chlorophyll-a levels before and after each fire from the impacted coastal area were evaluated using the Moderate Resolution Imaging Spectroradiometer (MODIS) on NASA’s Aqua satellite. The Random Forest Regression machine learning model did not strongly predict the difference in chlorophyll-a from the fire parameters. However, our moderate R2 value (0.36) shows promising avenues for future work, including investigating post-fire chlorophyll-a after the first significant rain event, as well as the impact of wind-blown ash on coastal chlorophyll-a concentrations.
Hannah Samuelson, University of St. Thomas
Fuel load plays a key role in determining severity (change in biomass), intensity (temperature), and frequency (length in time) of wildfires and prescribed fires. Fuel loads can vary in fuel conditions, like moisture content, amount, and flammability of the fuel, and are affected by species type and climatic conditions. Moreover, the difference in the chemical composition of plant species can affect its flammability. Anecdotal evidence from firefighters claim that Purple Sage burns hotter than other shrubs. Here we focus on two shrub species and two tree species that are broadly representative of California foothills; Blue Oak (Quercus douglasii), Coast Live Oak (Quercus agrifolia), Purple Sage (Salvia leucophylla), and California Sagebrush (Artemisia californica), and aim to understand species-specific proclivity to burn with higher or lower severity and intensity. In fall of 2023, a prescribed fire was conducted at Sedgwick Reserve in Santa Barbara County, CA. Field data collection included maximum temperature point measurements with metal pyrometers, the change in 3D vegetation structure using UAV LiDAR, and orthomosaic images for species identification. Radial buffers were created around the locations of the metal pyrometers and used to evaluate the spatial distribution of species, which were verified through field-observed species identification. The relationship between dominant overstory species, change in biomass, and maximum fire temperature was investigated. Preliminary results suggest that Purple Sage produced the highest maximum fire temperatures. Additionally, preliminary results showed both tree species, Blue Oak and Coast Live Oak, exhibit similar biomass change at low maximum fire temperatures. This investigation confirmed the firefighters’ anecdotal evidence on the relationship between species and their wildfire dynamics. The results have the potential to refine fire spread models and ultimately land management practices, improving the protection of humans and infrastructure while preventing habitat destruction from wildfires.
Angelina Harris, William & Mary
The severity and increasing frequency of California wildfires requires investigation of factors that characterize pre-fire landscapes to improve approaches to wildland management and predict the spread of wildfire. Quantifying the relationship between soil type and fuel load could improve existing efforts to map both overall quantity and composition of live fuel for fire spread models which may assist in preventative wildfire measures and potentially active firefighting work. The southwest corner of Sedgwick Reserve, Santa Barbara County, CA hosts two dominant soil types that broadly represent soil variability in the area. The more northerly soil unit is a Chamise shaly loam, and the more southerly soil unit is a Shedd silty clay loam. The Chamise series has a mixed texture, abundant in clay with a significant amount of rock fragments (> 35%) composing its texture while the Shedd series has a fine texture dominated by silt-sized particles. Topography, specifically slope and aspect, plays a significant role in formation and characteristics of soil due to influence on erosion and deposition and sun exposure, respectively. This research aims to explore the relationship between soil type and topography and quantify their influence on live fuel using a Canopy Height Model (CHM) derived from airborne LiDAR collected on 11/04/2020 with a point density of 10.19 pts/m2. The LiDAR-based CHM was filtered to separate trees (> 2 m) and shrubs (.07 – 2 m). A Random Forest Regressor was used to investigate the relationship between soil type, slope, and aspect to identify which variable is the best predictor of canopy height. Preliminary results suggested that soil type and aspect were the most important variables to determine canopy height (variable importance of .50 and .41, respectively). Further studies investigating quantity and composition of live fuel load focusing on additional soil units within Sedgwick Reserve are encouraged.
Emily Rogers, Bellarmine University
Isoprene (2-methyl-1,3-butadiene) represents the most abundant non-methane biogenic volatile organic compound in the troposphere, with annual emissions almost equal to those of methane. Depending on the chemical environment, this effective thermoregulator and reactive oxygen species scavenger participates in photochemical reactions to produce climate pollutants and toxins such as ozone and secondary organic aerosols. Previous studies have revealed strong connections between isoprene emission and photosynthesis as its precursors are formed during the Calvin Cycle. This raises questions as to whether the periodic biological events of plants, collectively known as vegetation phenology, influences tropospheric isoprene quantities. In this study, we investigate the influence of vegetation phenology on isoprene emission in Southern California by comparing photosynthetic activity and the spatial distribution of the isoprene oxidation product, formaldehyde, for regions dominated by plants of two different physiologies: high altitude woodlands and coastal shrublands. We interrogate the annual phenology of these regions using high resolution solar-induced chlorophyll fluorescence (SIF) estimates from the Orbiting Carbon Observatory-2 (OCO-2) satellite, and formaldehyde vertical column measurements from the recently activated Tropospheric Emissions: Monitoring of Pollution (TEMPO) geostationary satellite. We explore the seasonal trends in both formaldehyde formation and SIF as well as their bivariate relationship. Preliminary results indicate both heightened formaldehyde emission and heightened SIF during summer months relative to winter months, with a comparatively stronger correlation between the two metrics during the fall. Our findings will provide insight toward the response of plants to variations in their environment which directly influence chemical systems in the air. Whereas VOCs hold a great potential for environmental and anthropological harm if emitted in excess, it is crucial to understand the factors involved in their formation. As such, we hope that our findings provide information relevant to the development of air pollution mitigation strategies.
Sydney Kent, Miami University
Geology plays a key role in determining the chemical profile of groundwater through weathering and erosion, leading to minerals entering the groundwater. The Columbia Plateau, a geologic region that resides within the Pacific Northwest volcanic aquifer system, is known to have water management issues due to groundwater extraction for agriculture. Decreases in groundwater levels can lead to higher concentrations of rock-originated minerals, so the relationship between basaltic geology and well water quality is particularly important in these systems. This research aims to assess the extent in which the basaltic surface mineralogy of the Columbia Plateau impacts predetermined health benchmarks pertaining to trace elements, radionuclides, and nutrients. NASA’s Earth Surface Mineral Dust Source Investigation (EMIT) instrument, a spaceborne imaging spectrometer on the International Space Station, was used to map surface minerals within and among distinct regions of the Columbia Plateau. Some basalt aquifers have uranium that decays to radon-222, a mineral that can be toxic when consumed, as well as lithium, which is commonly found during volcanic eruptions. Preliminary findings showed that where basalt and its secondary minerals were identified with EMIT, chlorite and calcite, well data also indicated raised levels of lithium and radon-222. The relationship between EMIT mineral maps and water quality data indicated that EMIT can potentially be used to identify basalt aquifer systems that may be at risk of poor water quality. Results from this study can be used to enact more personalized water purification methods in areas with water quality issues and individuals with private wells can be more informed about the hazards present in their water.
Click here watch the Atmospheric Aerosols Group presentations.
Click here watch the Ocean Group presentations.
Click here watch the Whole Air Sampling (WAS) Group presentations.


