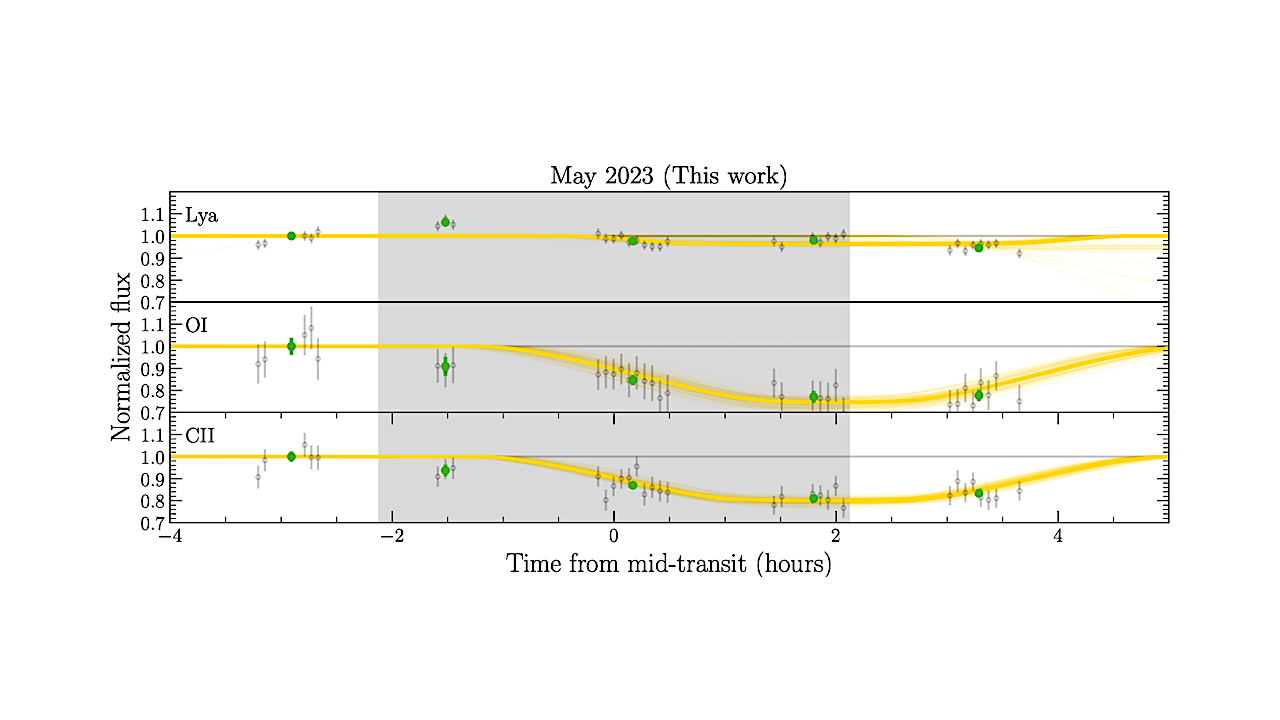
AU Mic Lyα, O I, and C II light curves observed by HST/STIS in May 2023 around the transit of AU Mic c. The gray region indicates the white-light transit

AU Mic Lyα, O I, and C II light curves observed by HST/STIS in May 2023 around the transit of AU Mic c. The gray region indicates the white-light transit
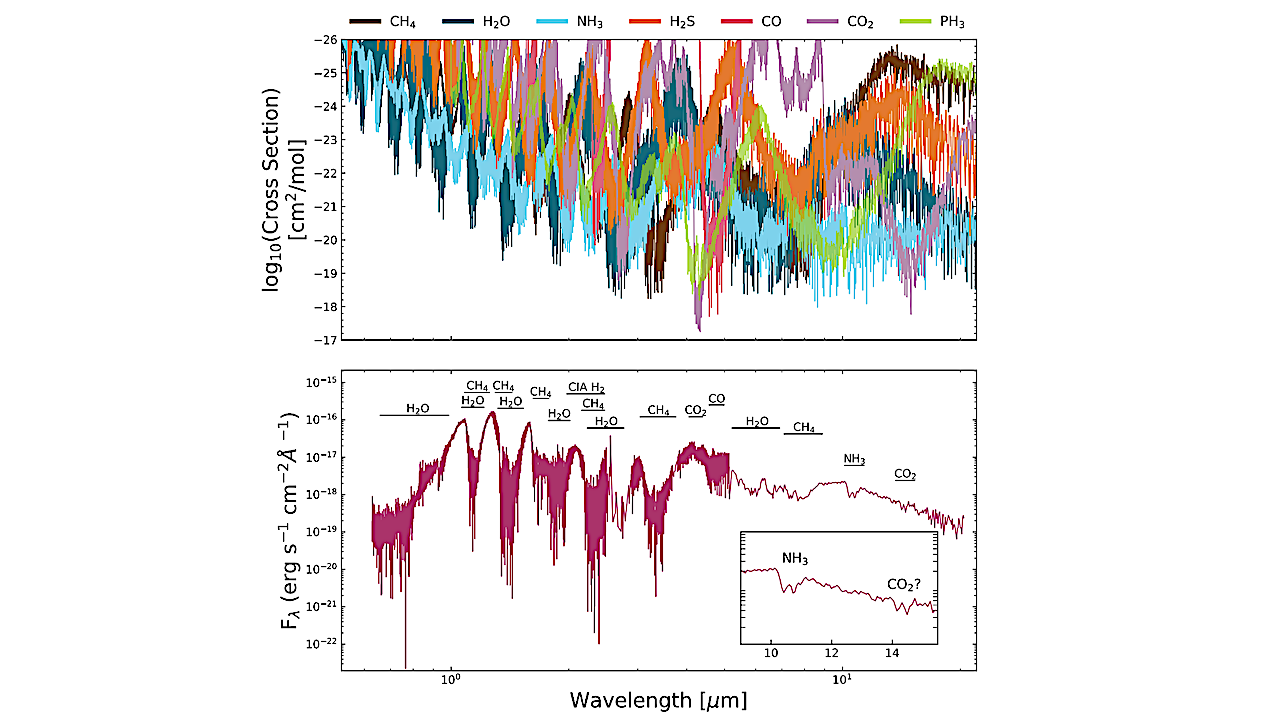
Top Panel: Absorption cross sections for a temperature of 650K and pressure of 1 bar used in the retrieval analysis from Hood et al. (2024). Bottom Panel: The complete SED
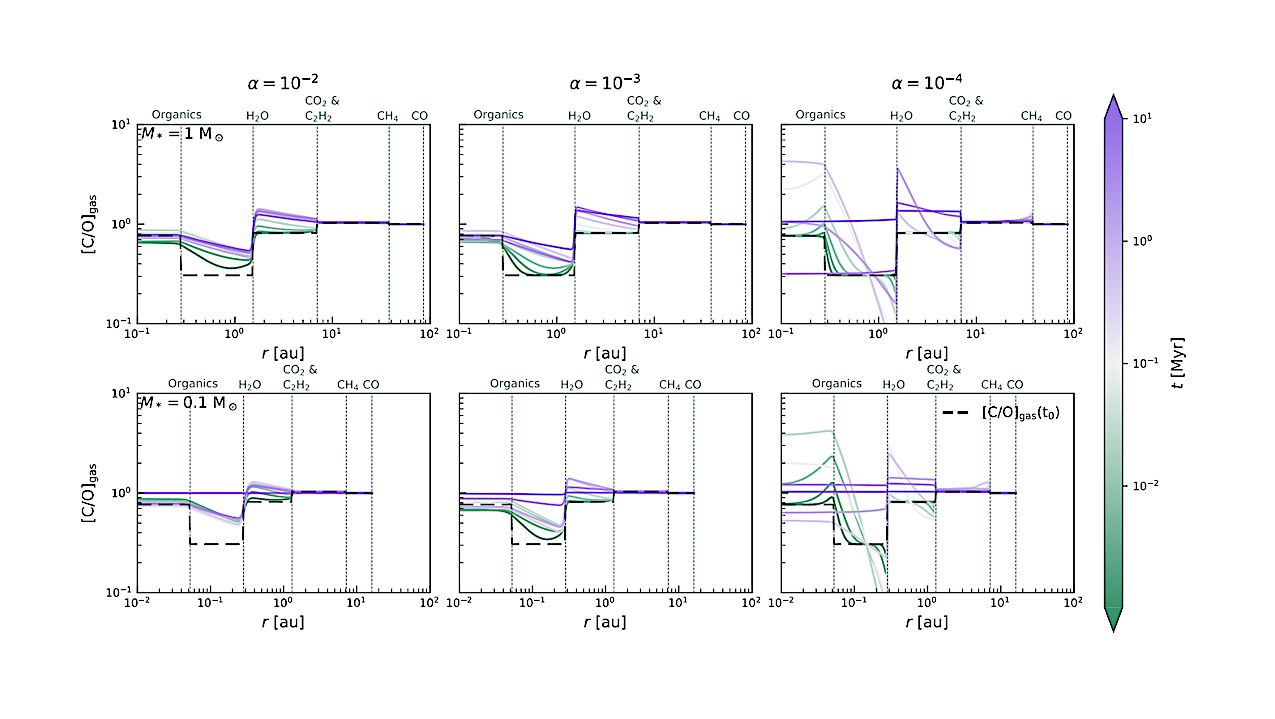
Gas-phase C/O ratio as a function of distance to the star for the two different values of the stellar mass (M∗ = 1, 0.1 M⊙) and three values of the
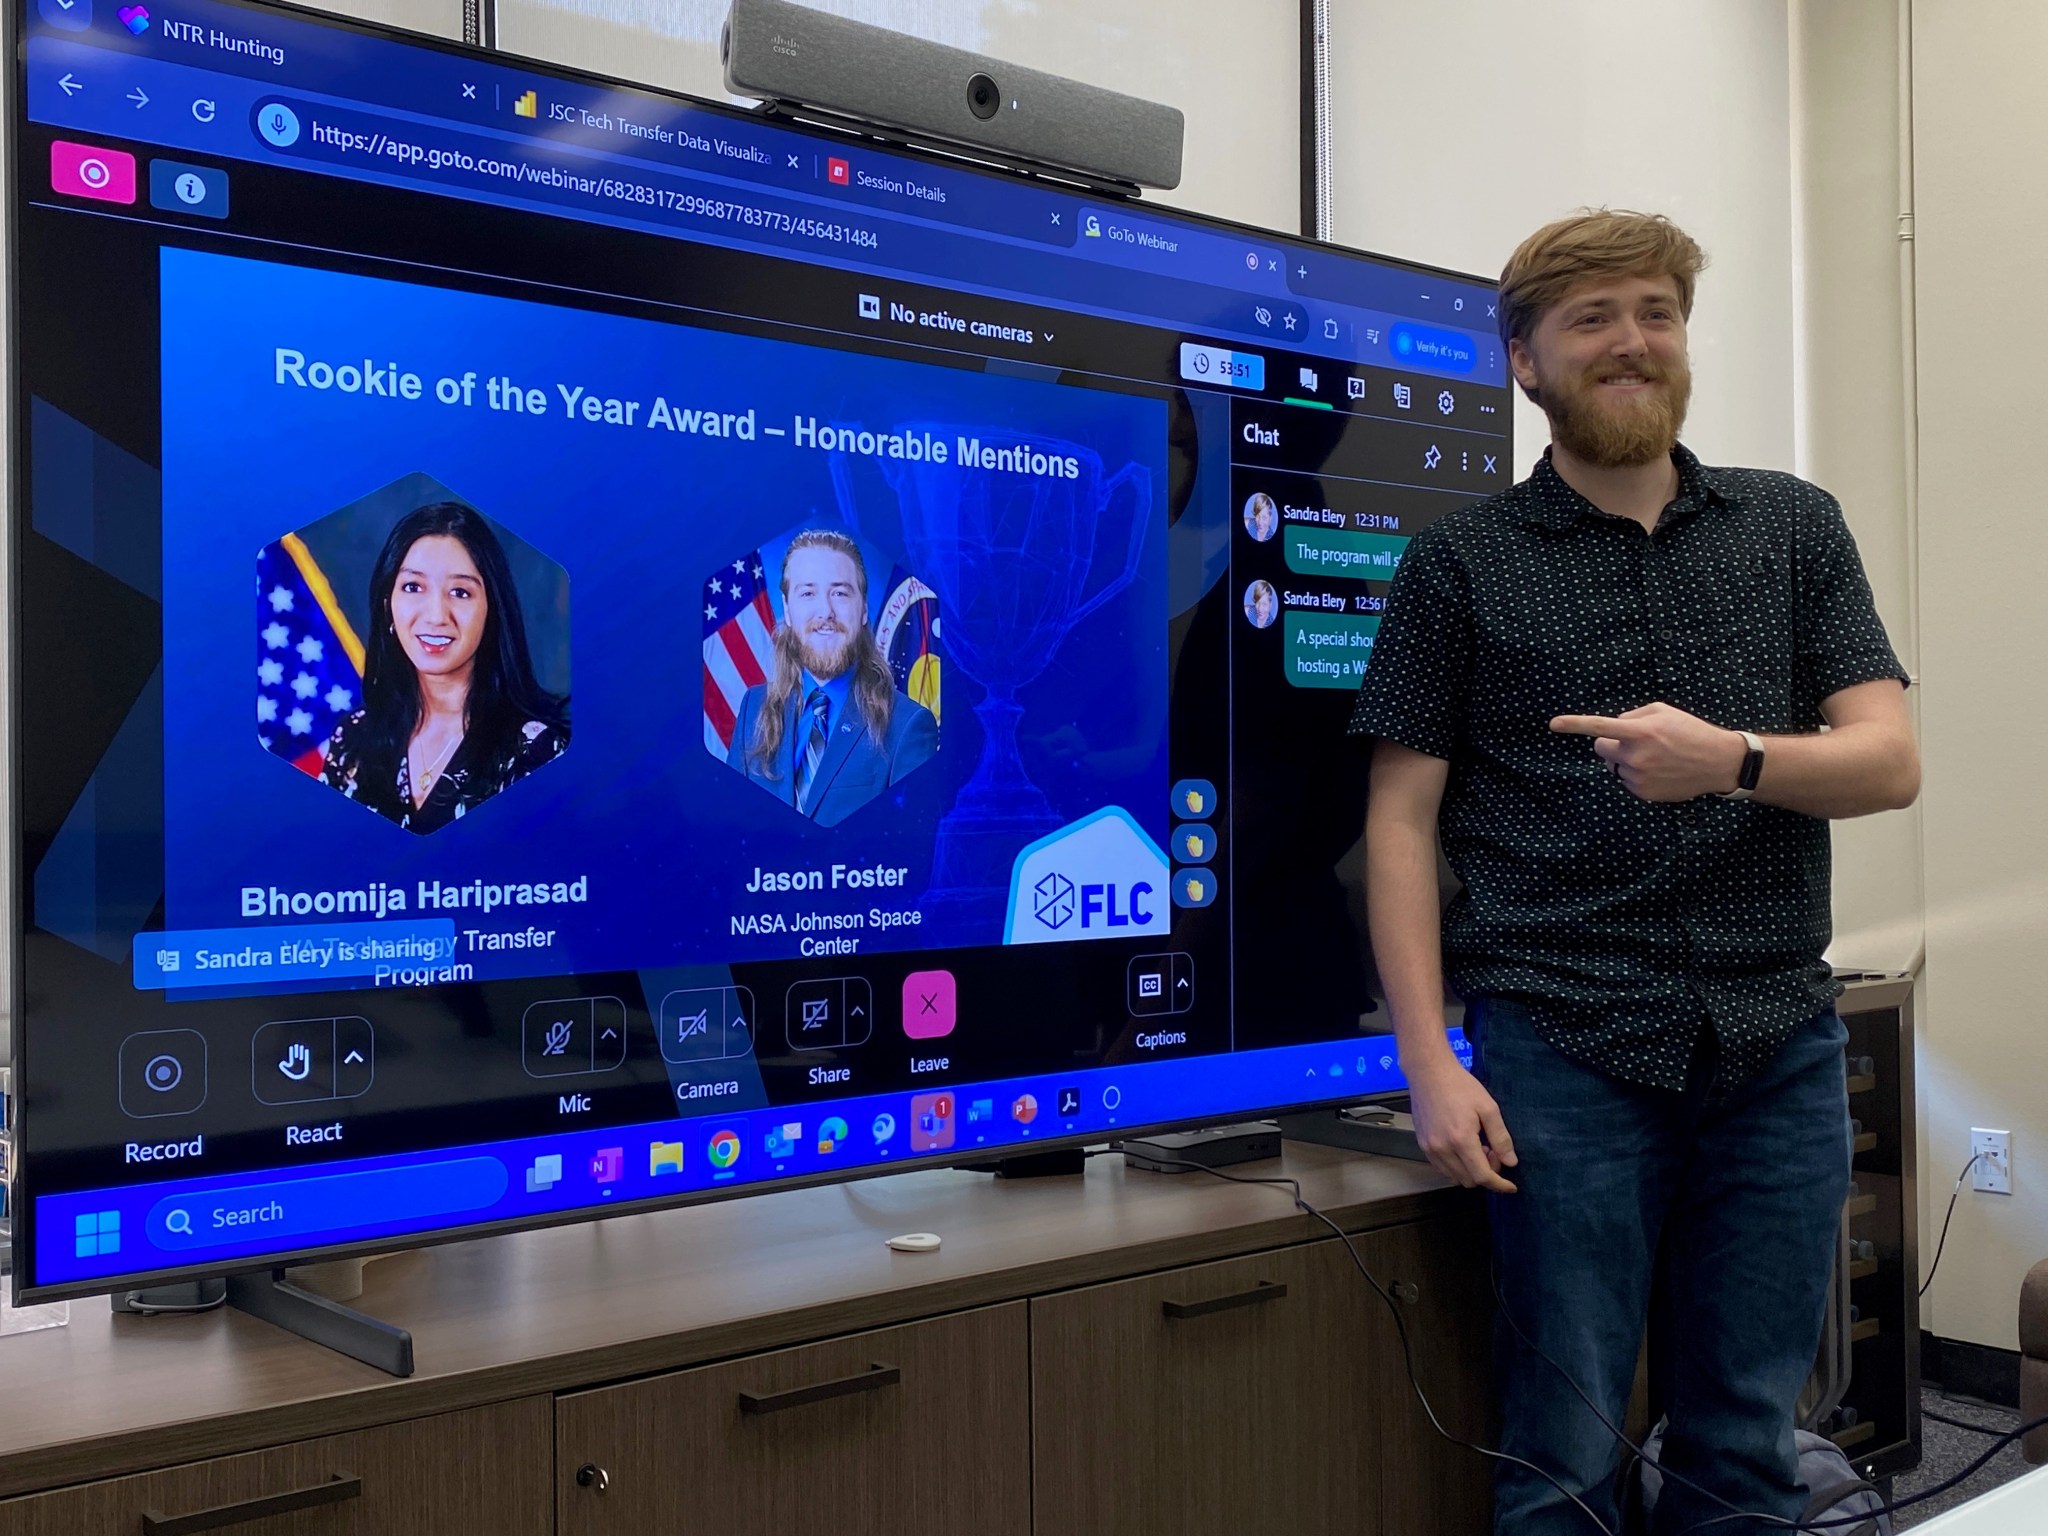
Heading into a recent staff meeting for Johnson Space Center’s Business Development & Technology Integration Office, Jason Foster anticipated a typical agenda of team updates and discussion. He did not
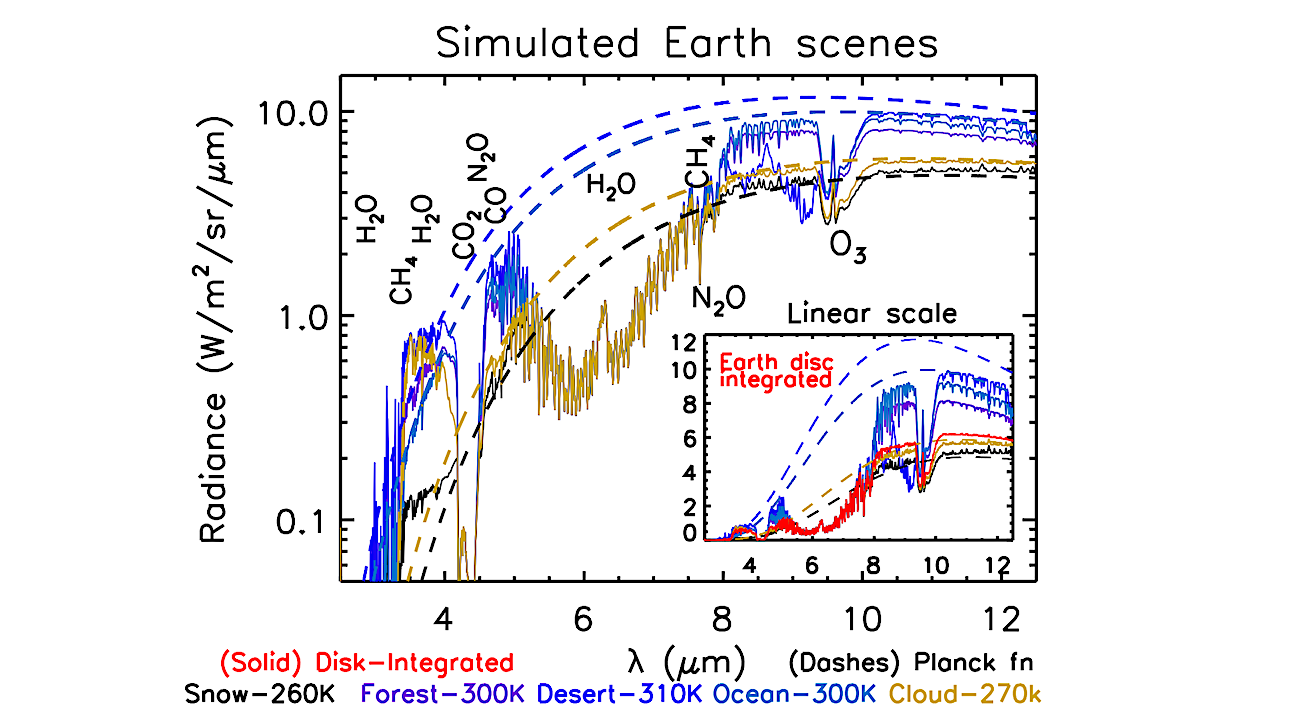
EPyC-IR spectroscopy complements CHEILS reflected light measurement. Earth’s nadirviewed spectrum from 2.5 to 12.5 μm (modeled) is bracketed by EPyC-IR and includes reflected light for 3 μm (opaque due to

This is a customer submitted press release. Submit your press release. June 3, 2025 – Washington, D.C. – In an effort to strengthen advocacy for the U.S. space industry, the
Good news, aurora chasers — round two could be on the way tonight! If you missed last night’s severe G4 geomagnetic storm last night or just can’t get enough of
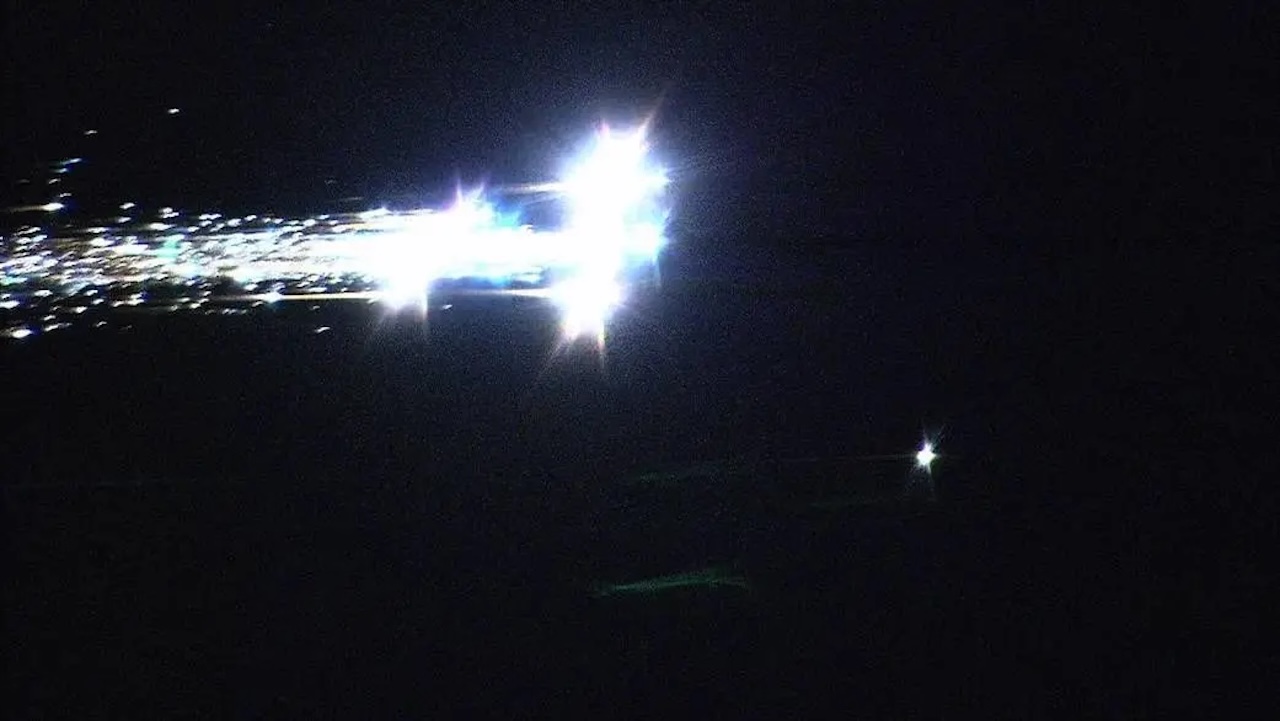
Scientists flying aboard NASA’s DC-8 airborne laboratory captured this image of the Japan Aerospace Exploration Agency’s Hayabusa spacecraft June 13, 2010 as it re-entered the Earth’s atmosphere and began breaking
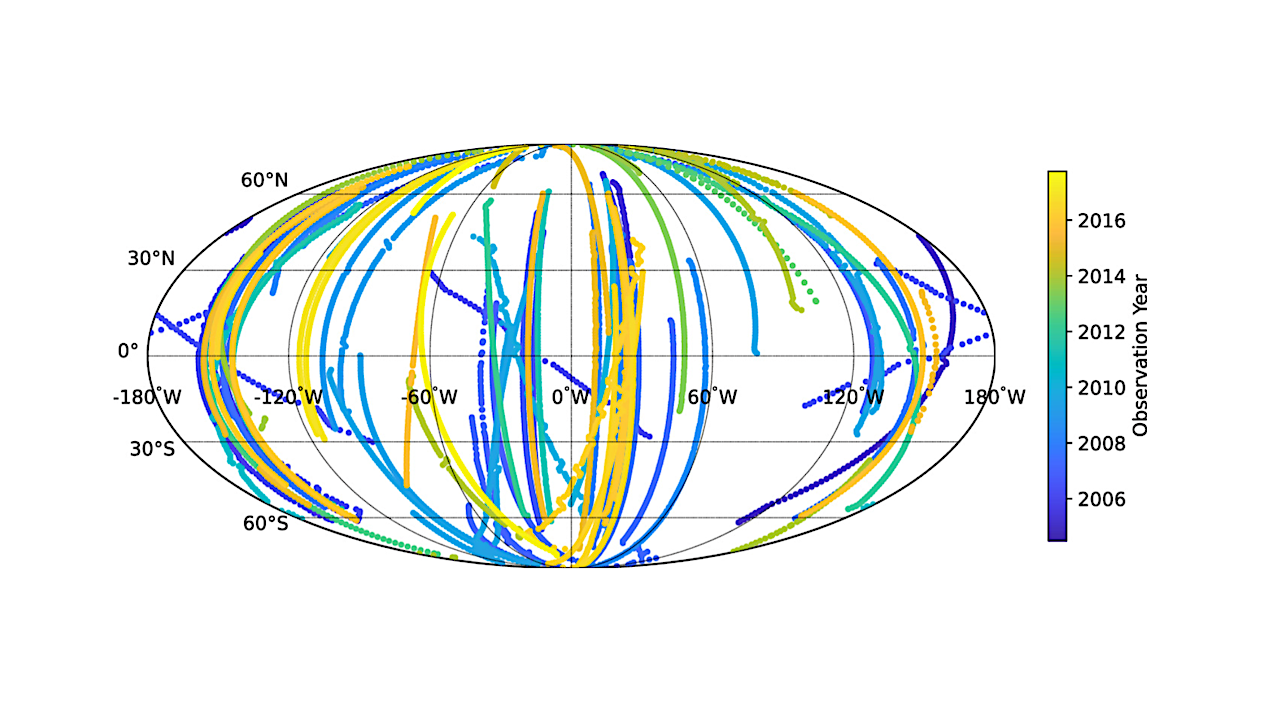
Observation sequences used in this study. Spectra are binned in 2° latitude bins. Points are plotted at the central latitude of the bin and at the average longitude of the

Blue Origin’s next suborbital flight is scheduled to launch on Saturday (May 31), carrying a diverse crew of educators, entrepreneurs and adventurers united by a shared passion for space and