The abstract in PubMed or at the publisher’s site is linked when available and will open in a new window. Martone M, Irving BA, Spielmann G, Johannsen NM, Robinson MM,

The abstract in PubMed or at the publisher’s site is linked when available and will open in a new window. Martone M, Irving BA, Spielmann G, Johannsen NM, Robinson MM,
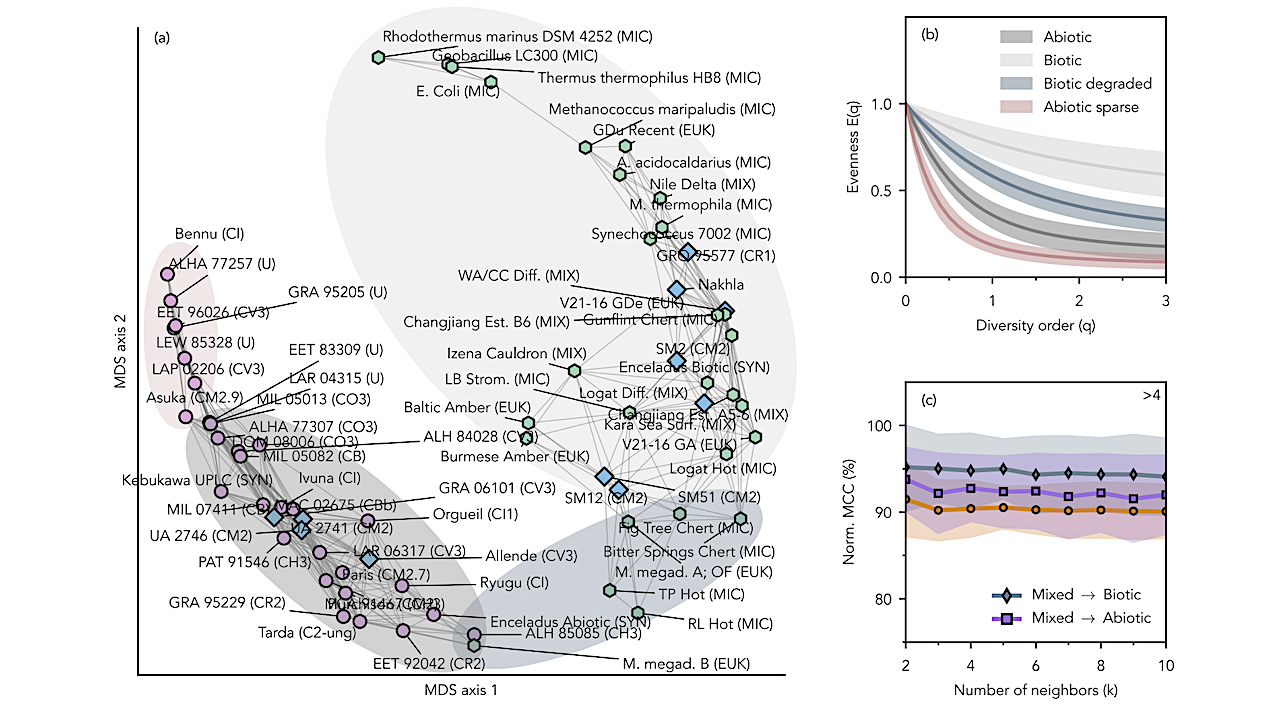
Dissimilarity analysis of evenness curves for amino-acid assemblages. (a) Mul- tidimensional Scaling (MDS) projection of pairwise dissimilarities between evenness curves, E(q). Each point represents a sample; distances increase with statistical
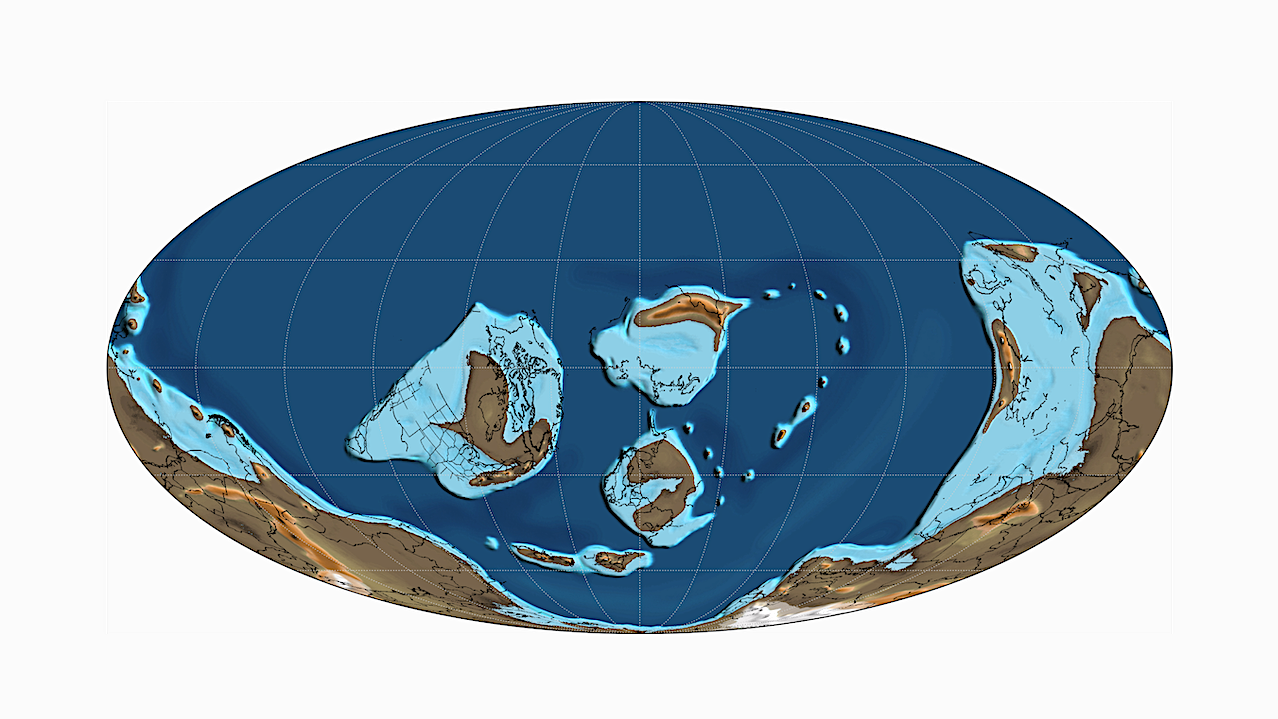
“Phanerozoic-scope supplementary material to “The Cretaceous World: Plate Tectonics, Paleogeography, and Paleoclimate (doi:10.1144/sp544-2024-28)” from the PALEOMAP project”. doi:10.5281/zenodo.10659112 CC BY 4.0 Wikipedia An international collaboration involving researchers from the University
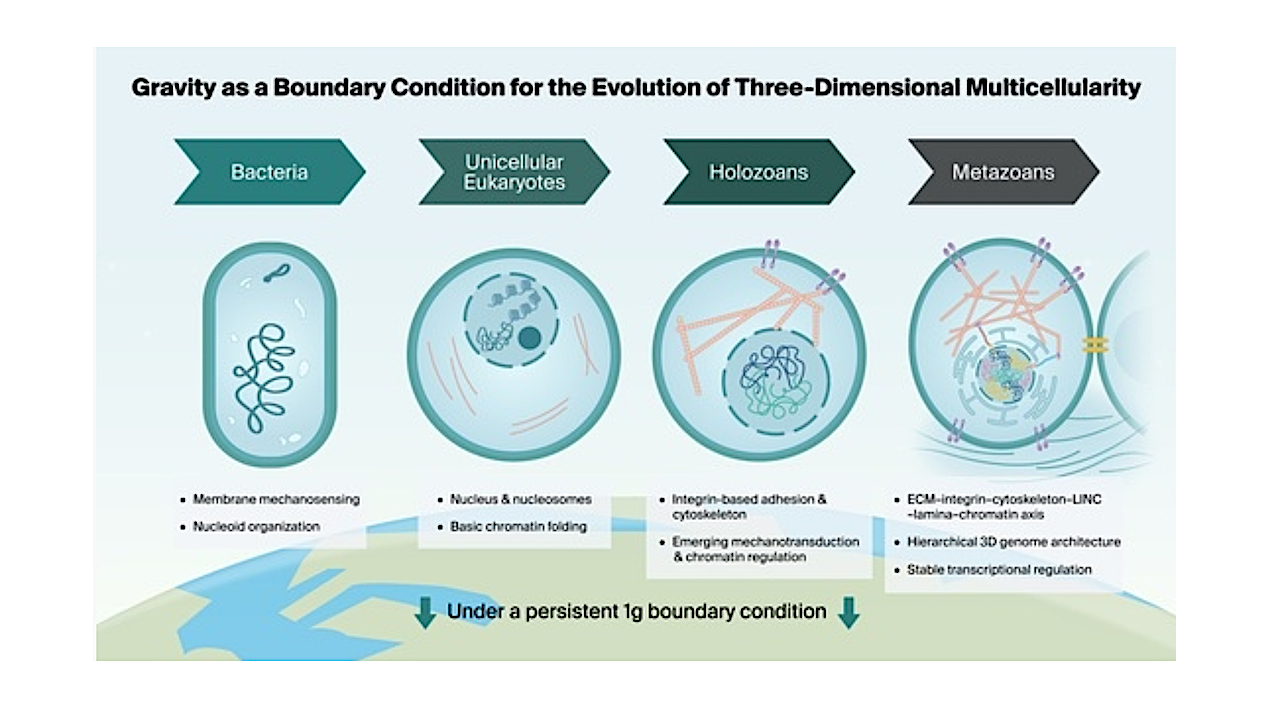
Graphical abstract — Life Life evolved under a persistent 1 g field that is continuous, ubiquitous, and directionally structured. Here, we synthesize evidence across evolutionary biology, mechanobiology, and genome architecture
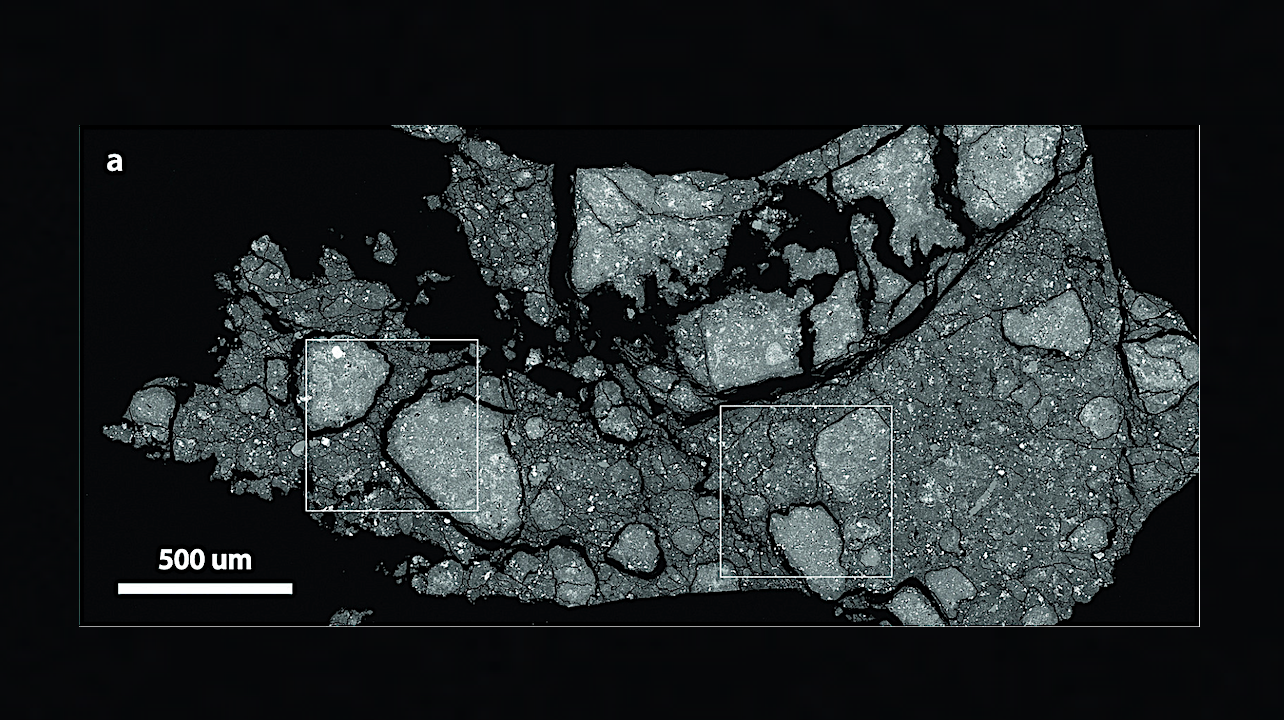
Grayscale backscattered electron images of (a) OREX-803086-100 (“Sample A”, hummocky) — Science Direct Thermal fatigue has been observed to be an important driver of boulder evolution on asteroid Bennu through
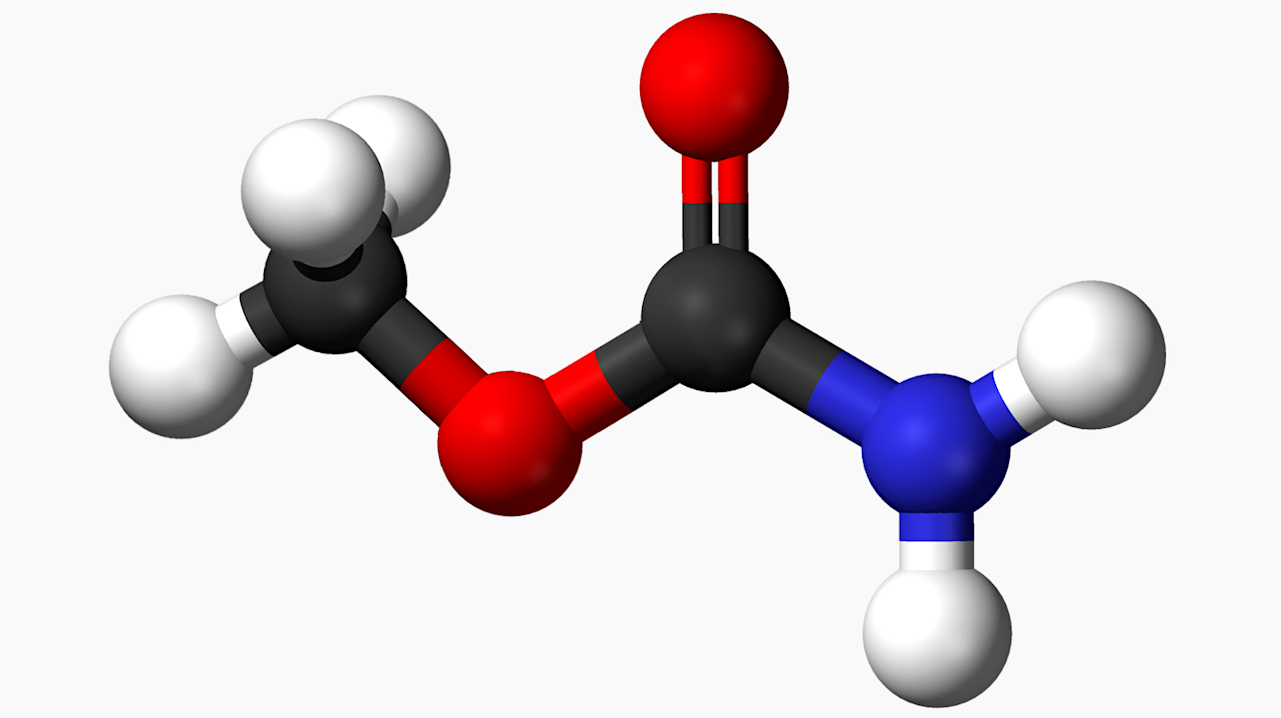
Methyl Carbamate — WIkipedia Glycine-the simplest amino acid-has remained undetected in the interstellar medium despite decades of sensitive searches, motivating alternative approaches to constrain its astrochemical origin. A promising strategy
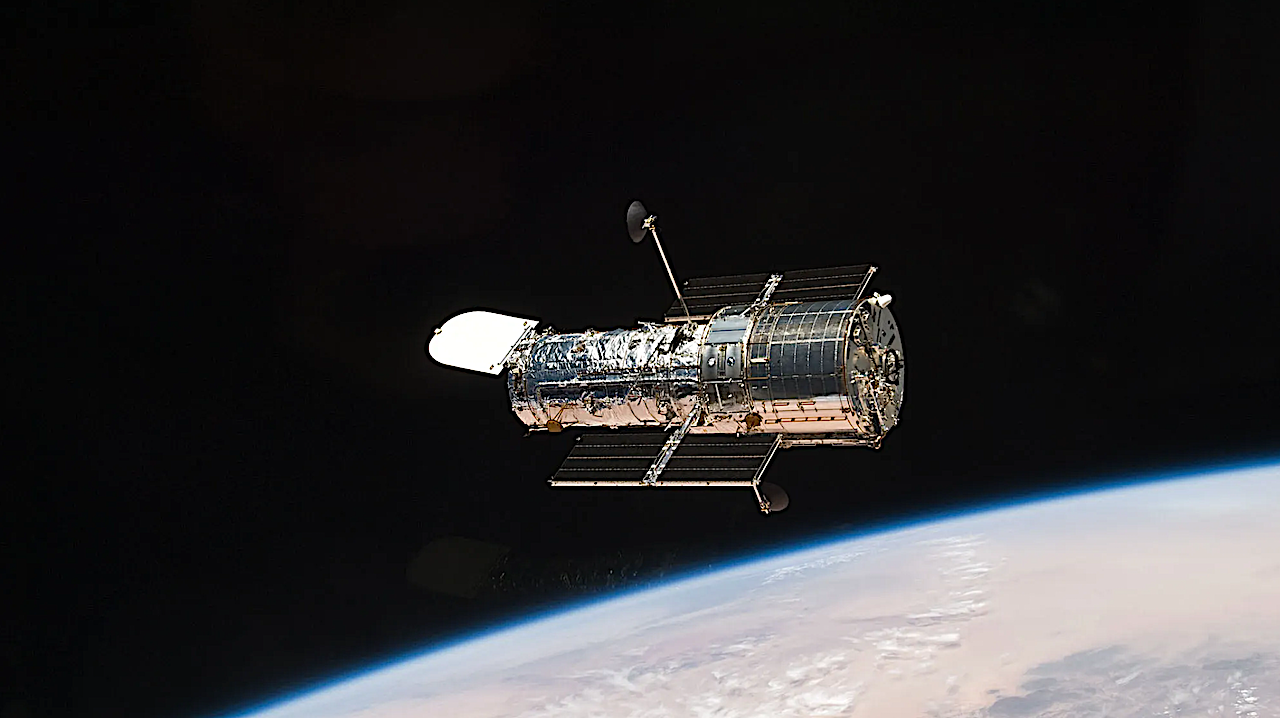
This image of NASA’s Hubble Space Telescope was taken on May 19, 2009 after deployment during Servicing Mission 4. NASA The Hubble Advanced Spectral Products (HASP) program is designed to
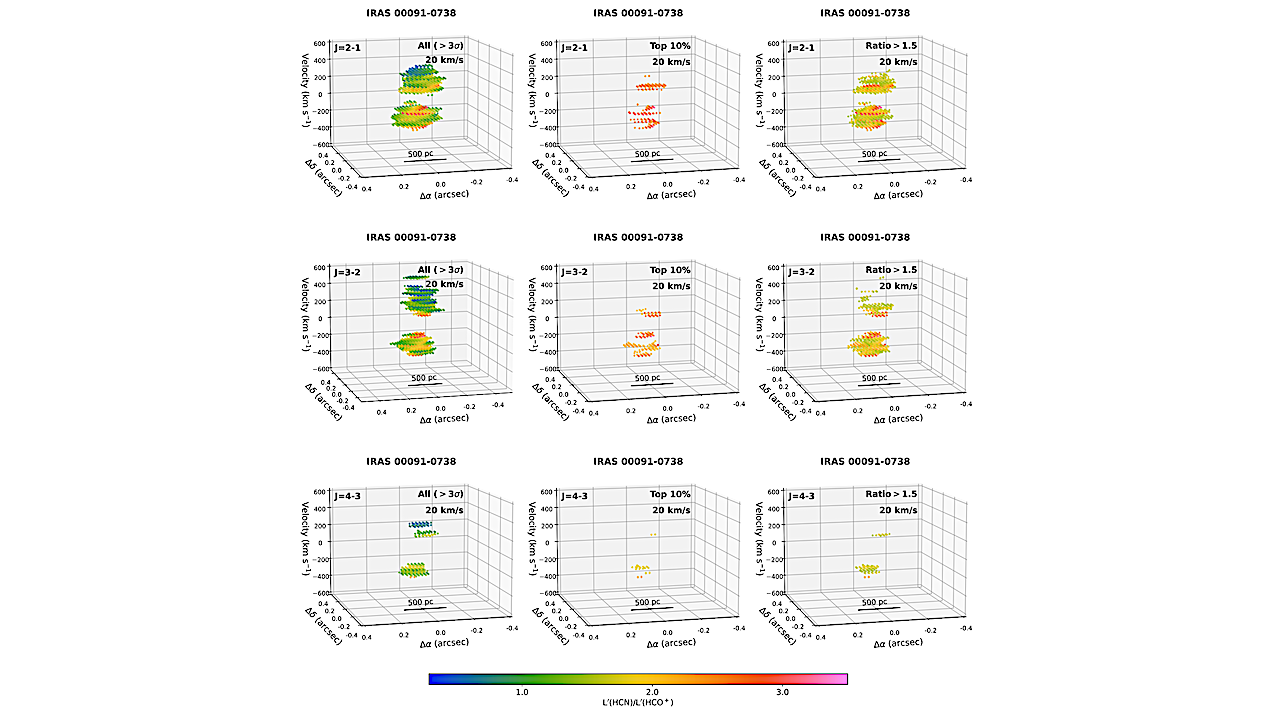
PPV plot of the (sub)millimeter HCN-to-HCO+ flux ratios at J=2–1, J=3–2, and J=4–3, with a velocity resolution of 20 km s−1 and a pixel scale of 0. ′′02 pixel−1 for
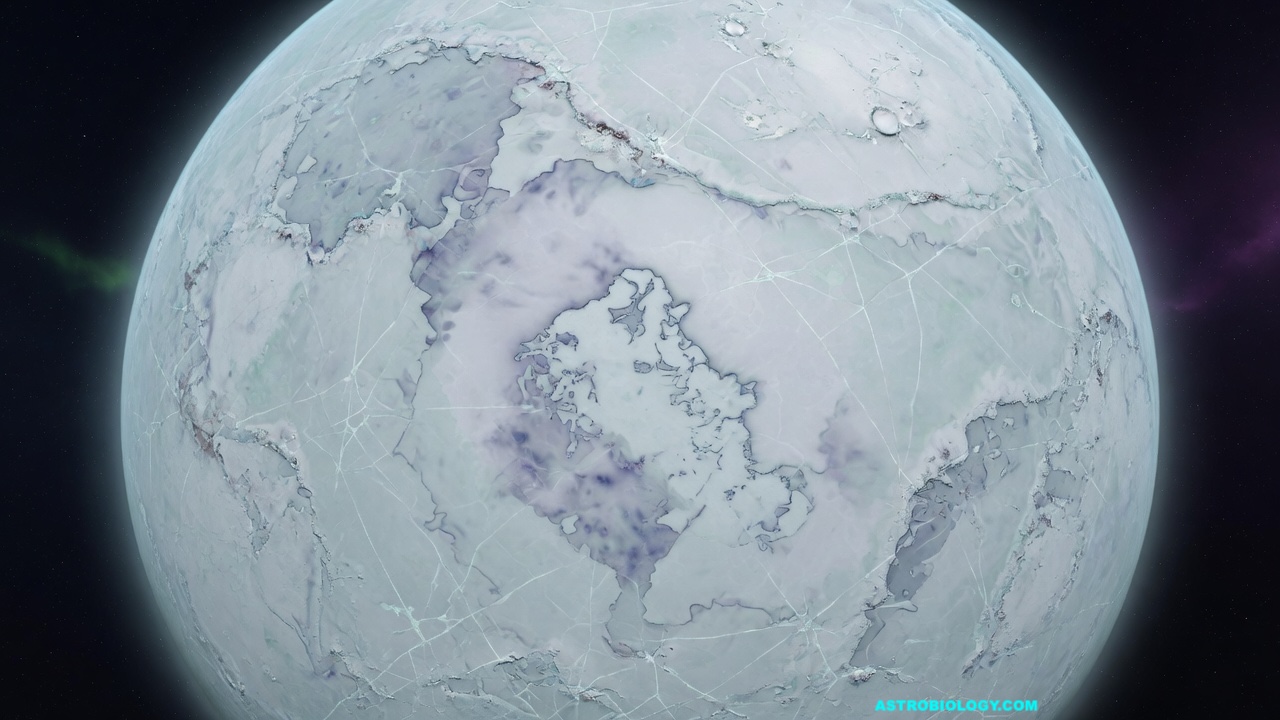
Snowball Earth — Grok via Astrobiology.com A new study by Earth scientists in the Harvard John A. Paulson School of Engineering and Applied Sciences (SEAS) offers an explanation for one

Life on Early Earth — Grok via Astrobiology.com The “NASA definition” enjoys broad popularity among scientists, particularly in the astrobiology community: life is “a self-sustained chemical system capable of Darwinian