In the ever-expanding universe of literature, where countless voices vie for our attention, “Michael Rising: One Man’s Journey to Find a Better World” emerges as a compelling beacon of hope

In the ever-expanding universe of literature, where countless voices vie for our attention, “Michael Rising: One Man’s Journey to Find a Better World” emerges as a compelling beacon of hope
When 3I/ATLAS swept past the sun in late October 2025, it became only the third confirmed visitor from interstellar space ever detected. Unlike the mysterious ‘Oumuamua, which revealed almost nothing
Explore the Cosmos in Style: Pop Threads NASA Worm Logo Vintage Retro Long Sleeve Tee Greetings, Earthlings and cosmic explorers! Are you ready to transcend the ordinary realms of fashion

In this episode of Space Minds, host Mike Gruss is joined by SpaceNews journalists Jason Rainbow, Sandra Erwin, Jeff Foust and Debra Werner for a wide-ranging conversation on
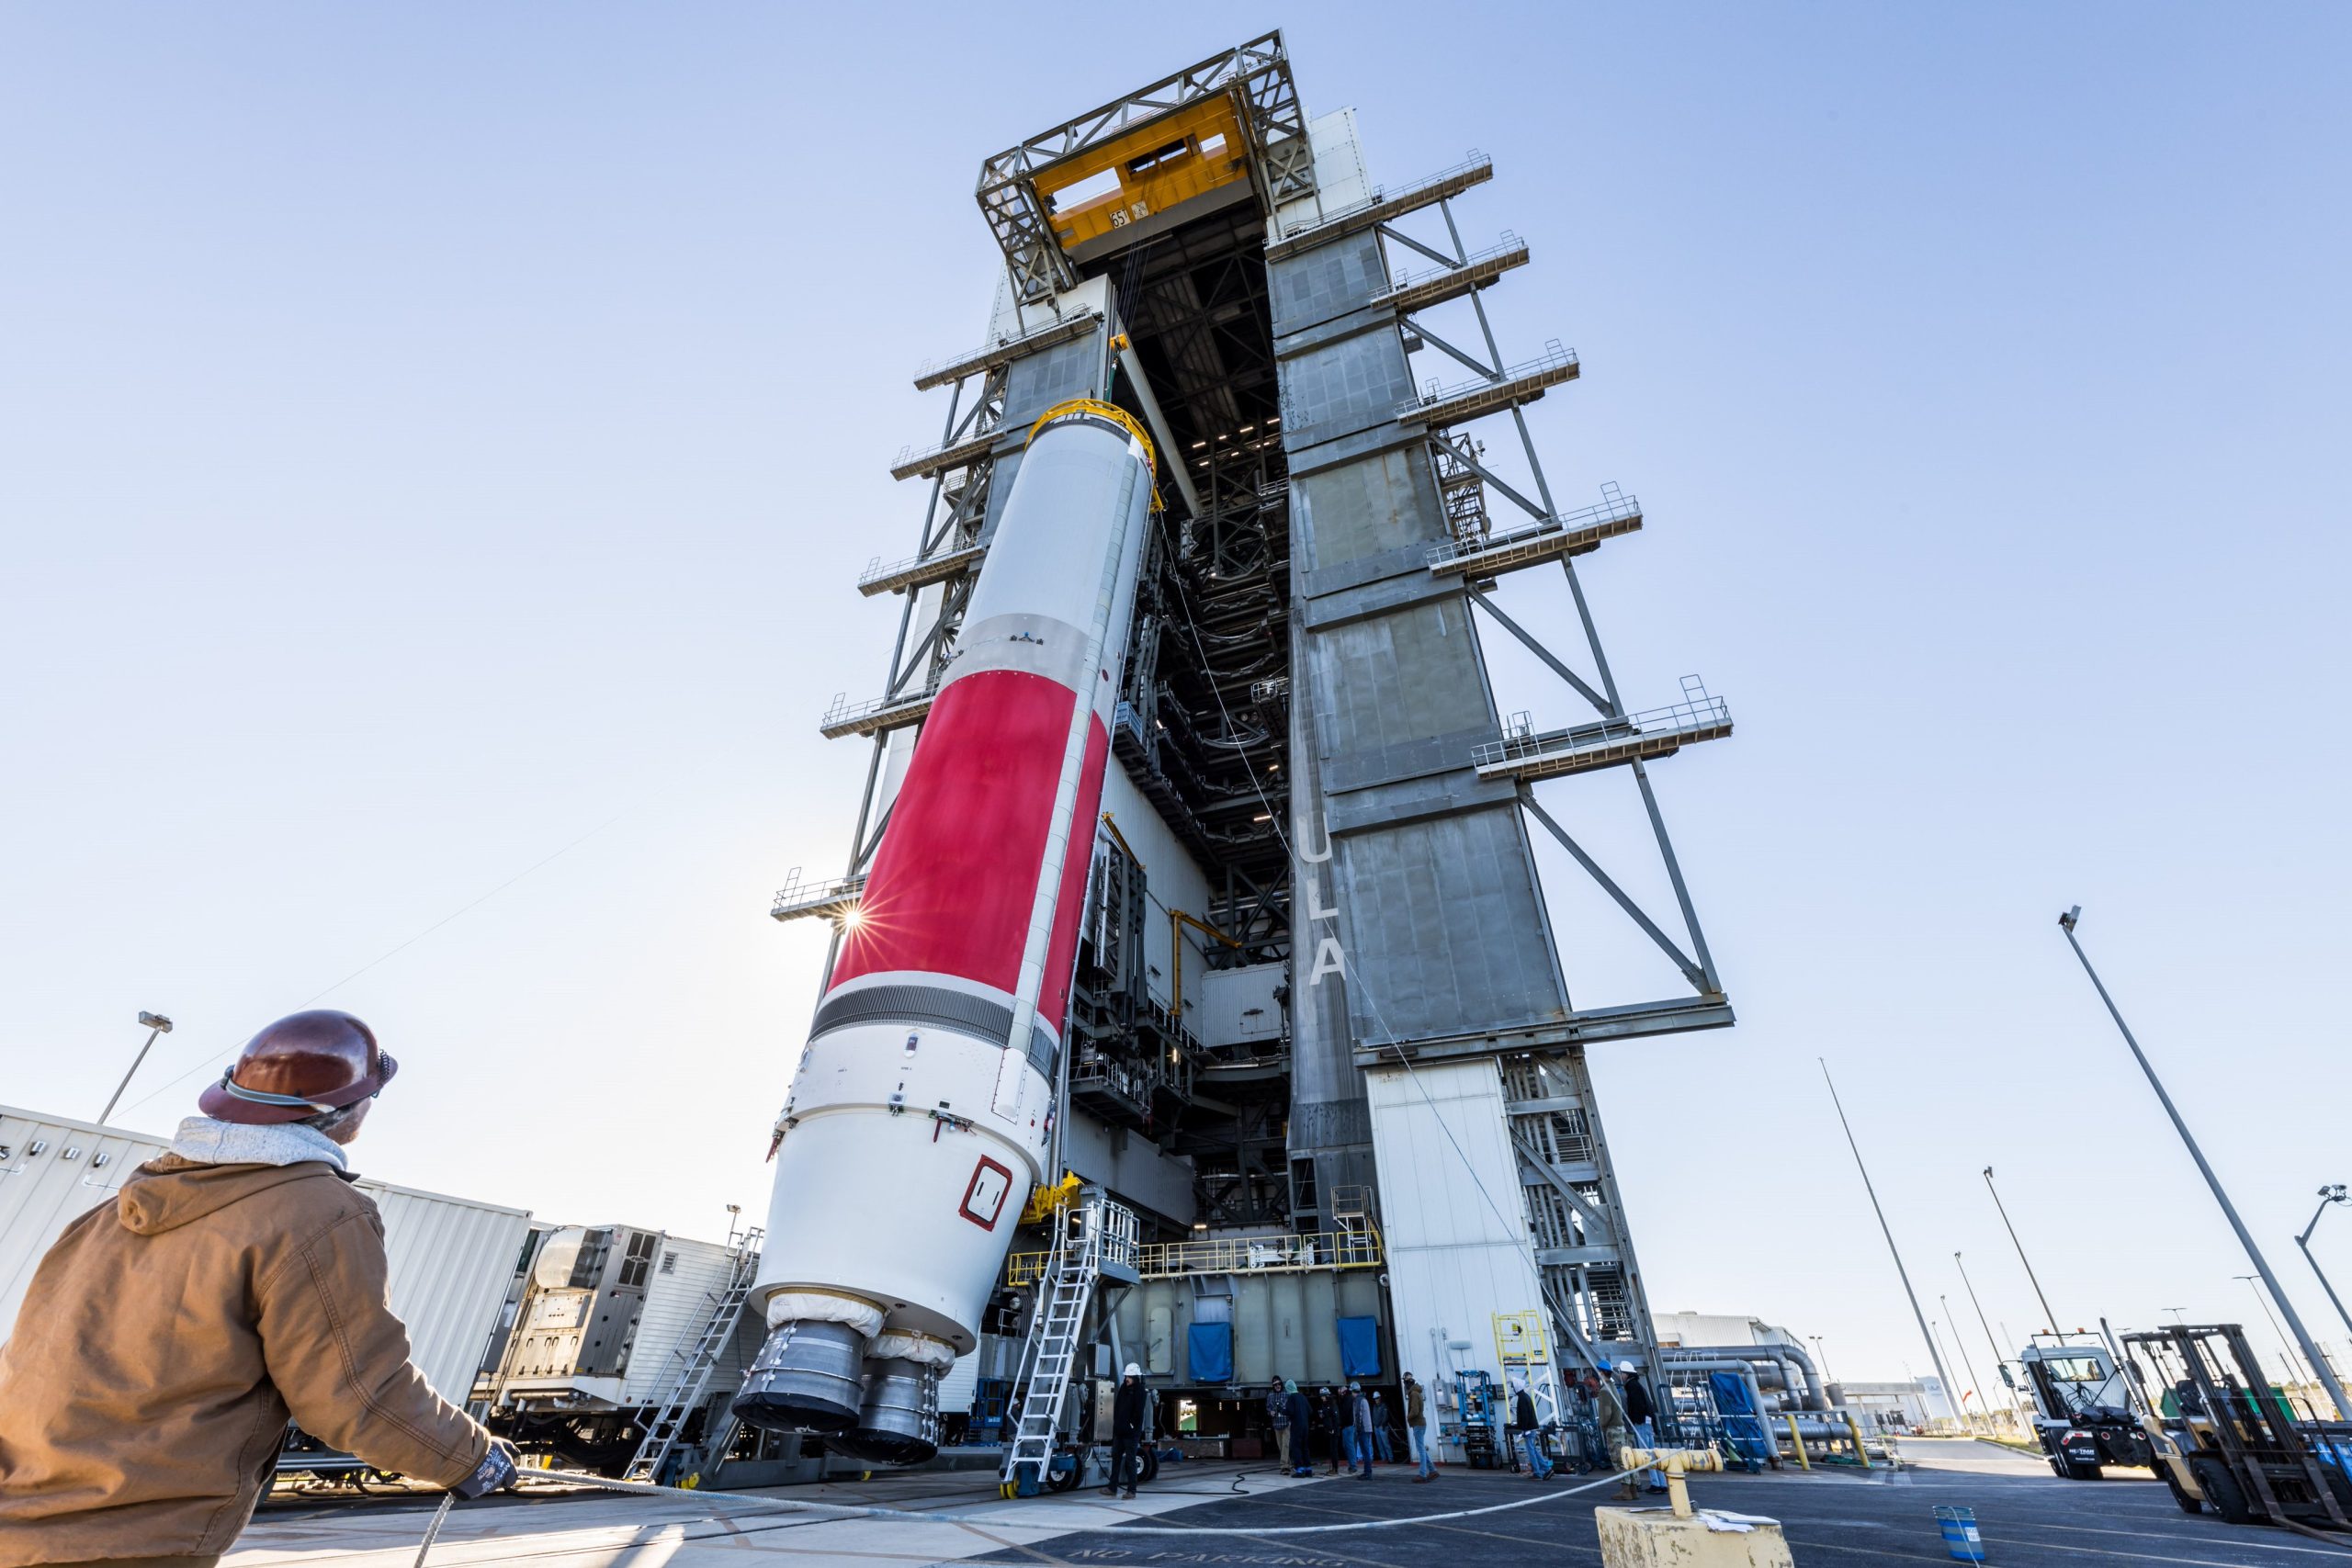
WASHINGTON — United Launch Alliance plans to begin 2026 with a national security mission as its Vulcan Centaur rocket prepares to launch USSF-87 for the U.S. Space Force. The mission
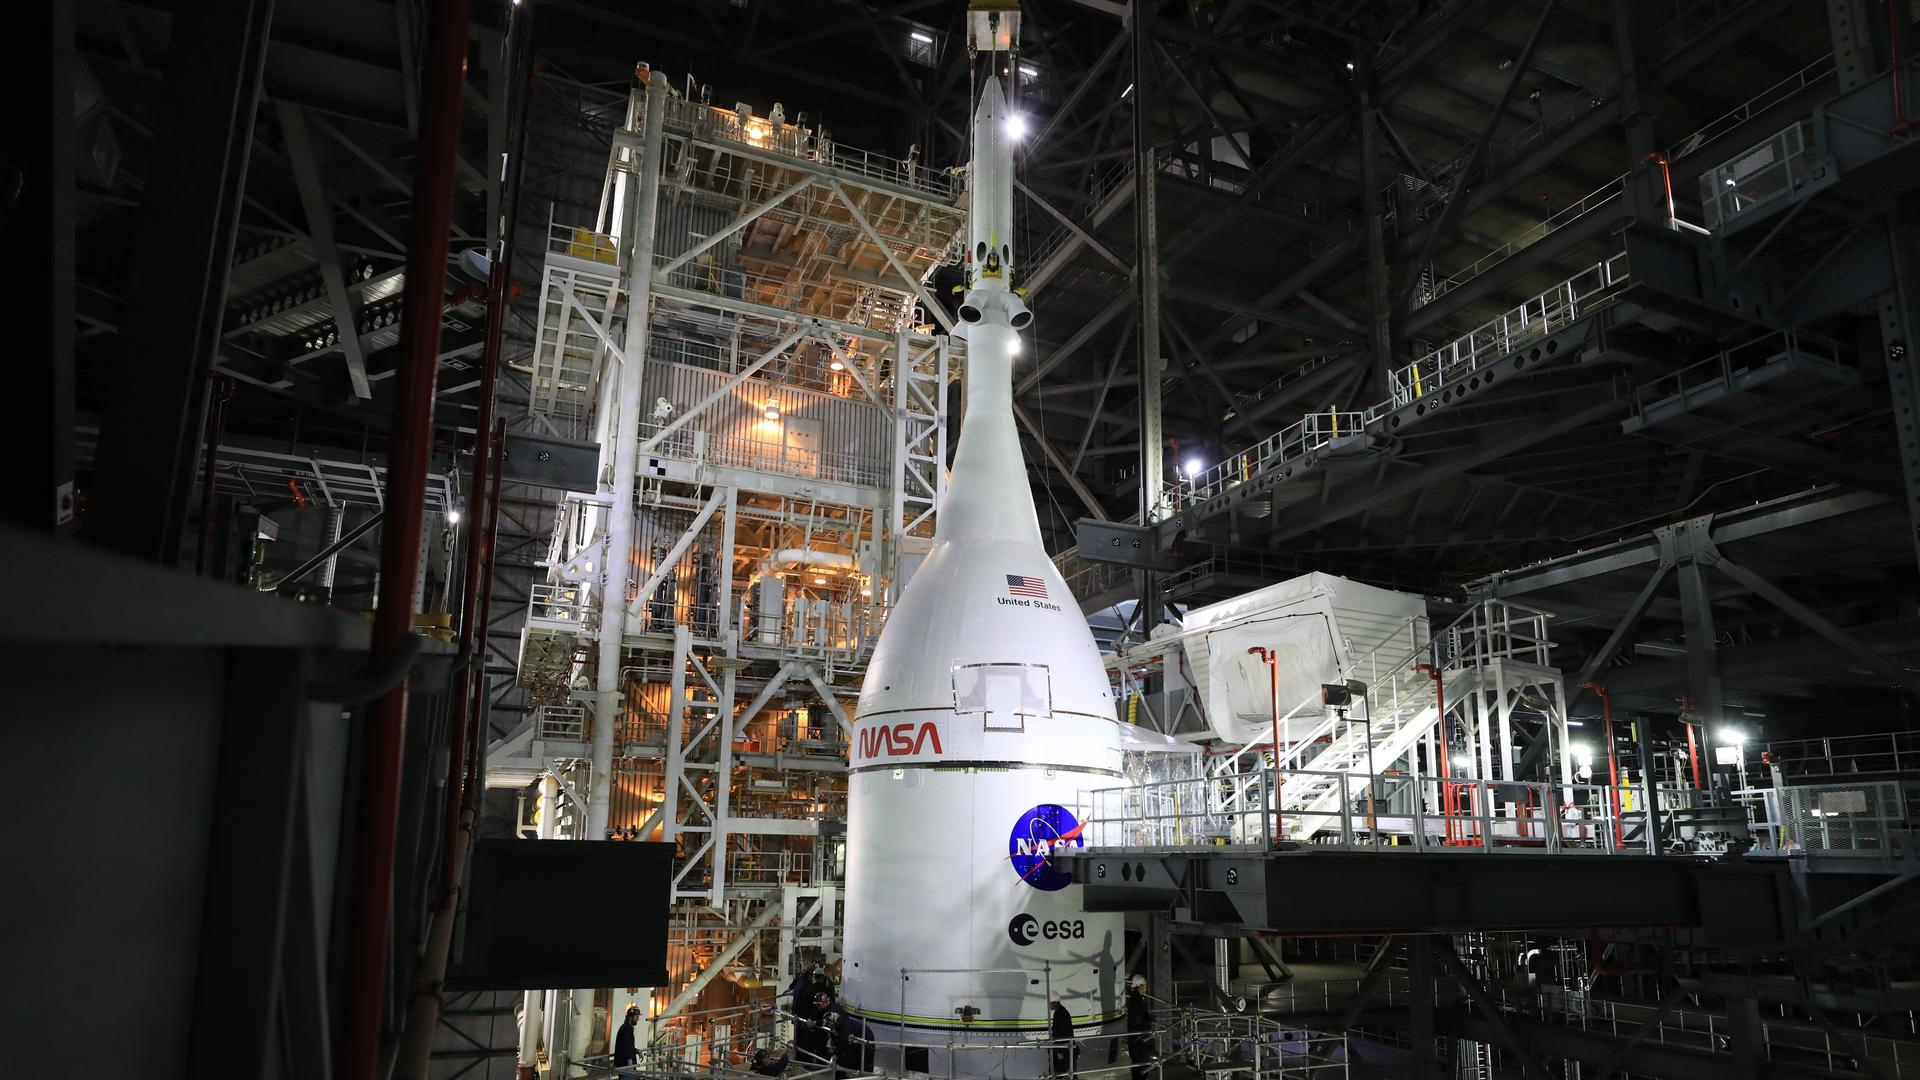
NASA has reached one of its key steps on the road to returning humans to the moon, as NASA’s Exploration Ground Systems team successfully lifted and integrated the Orion spacecraft
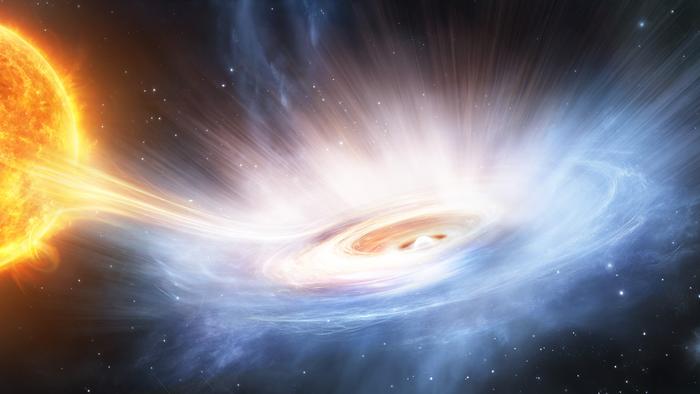
The Universe is a strange place. The X-Ray Imaging and Spectroscopy Mission (XRISM) orbiting observatory recently highlighted this fact, when it was turned on a pulsar to document its powerful
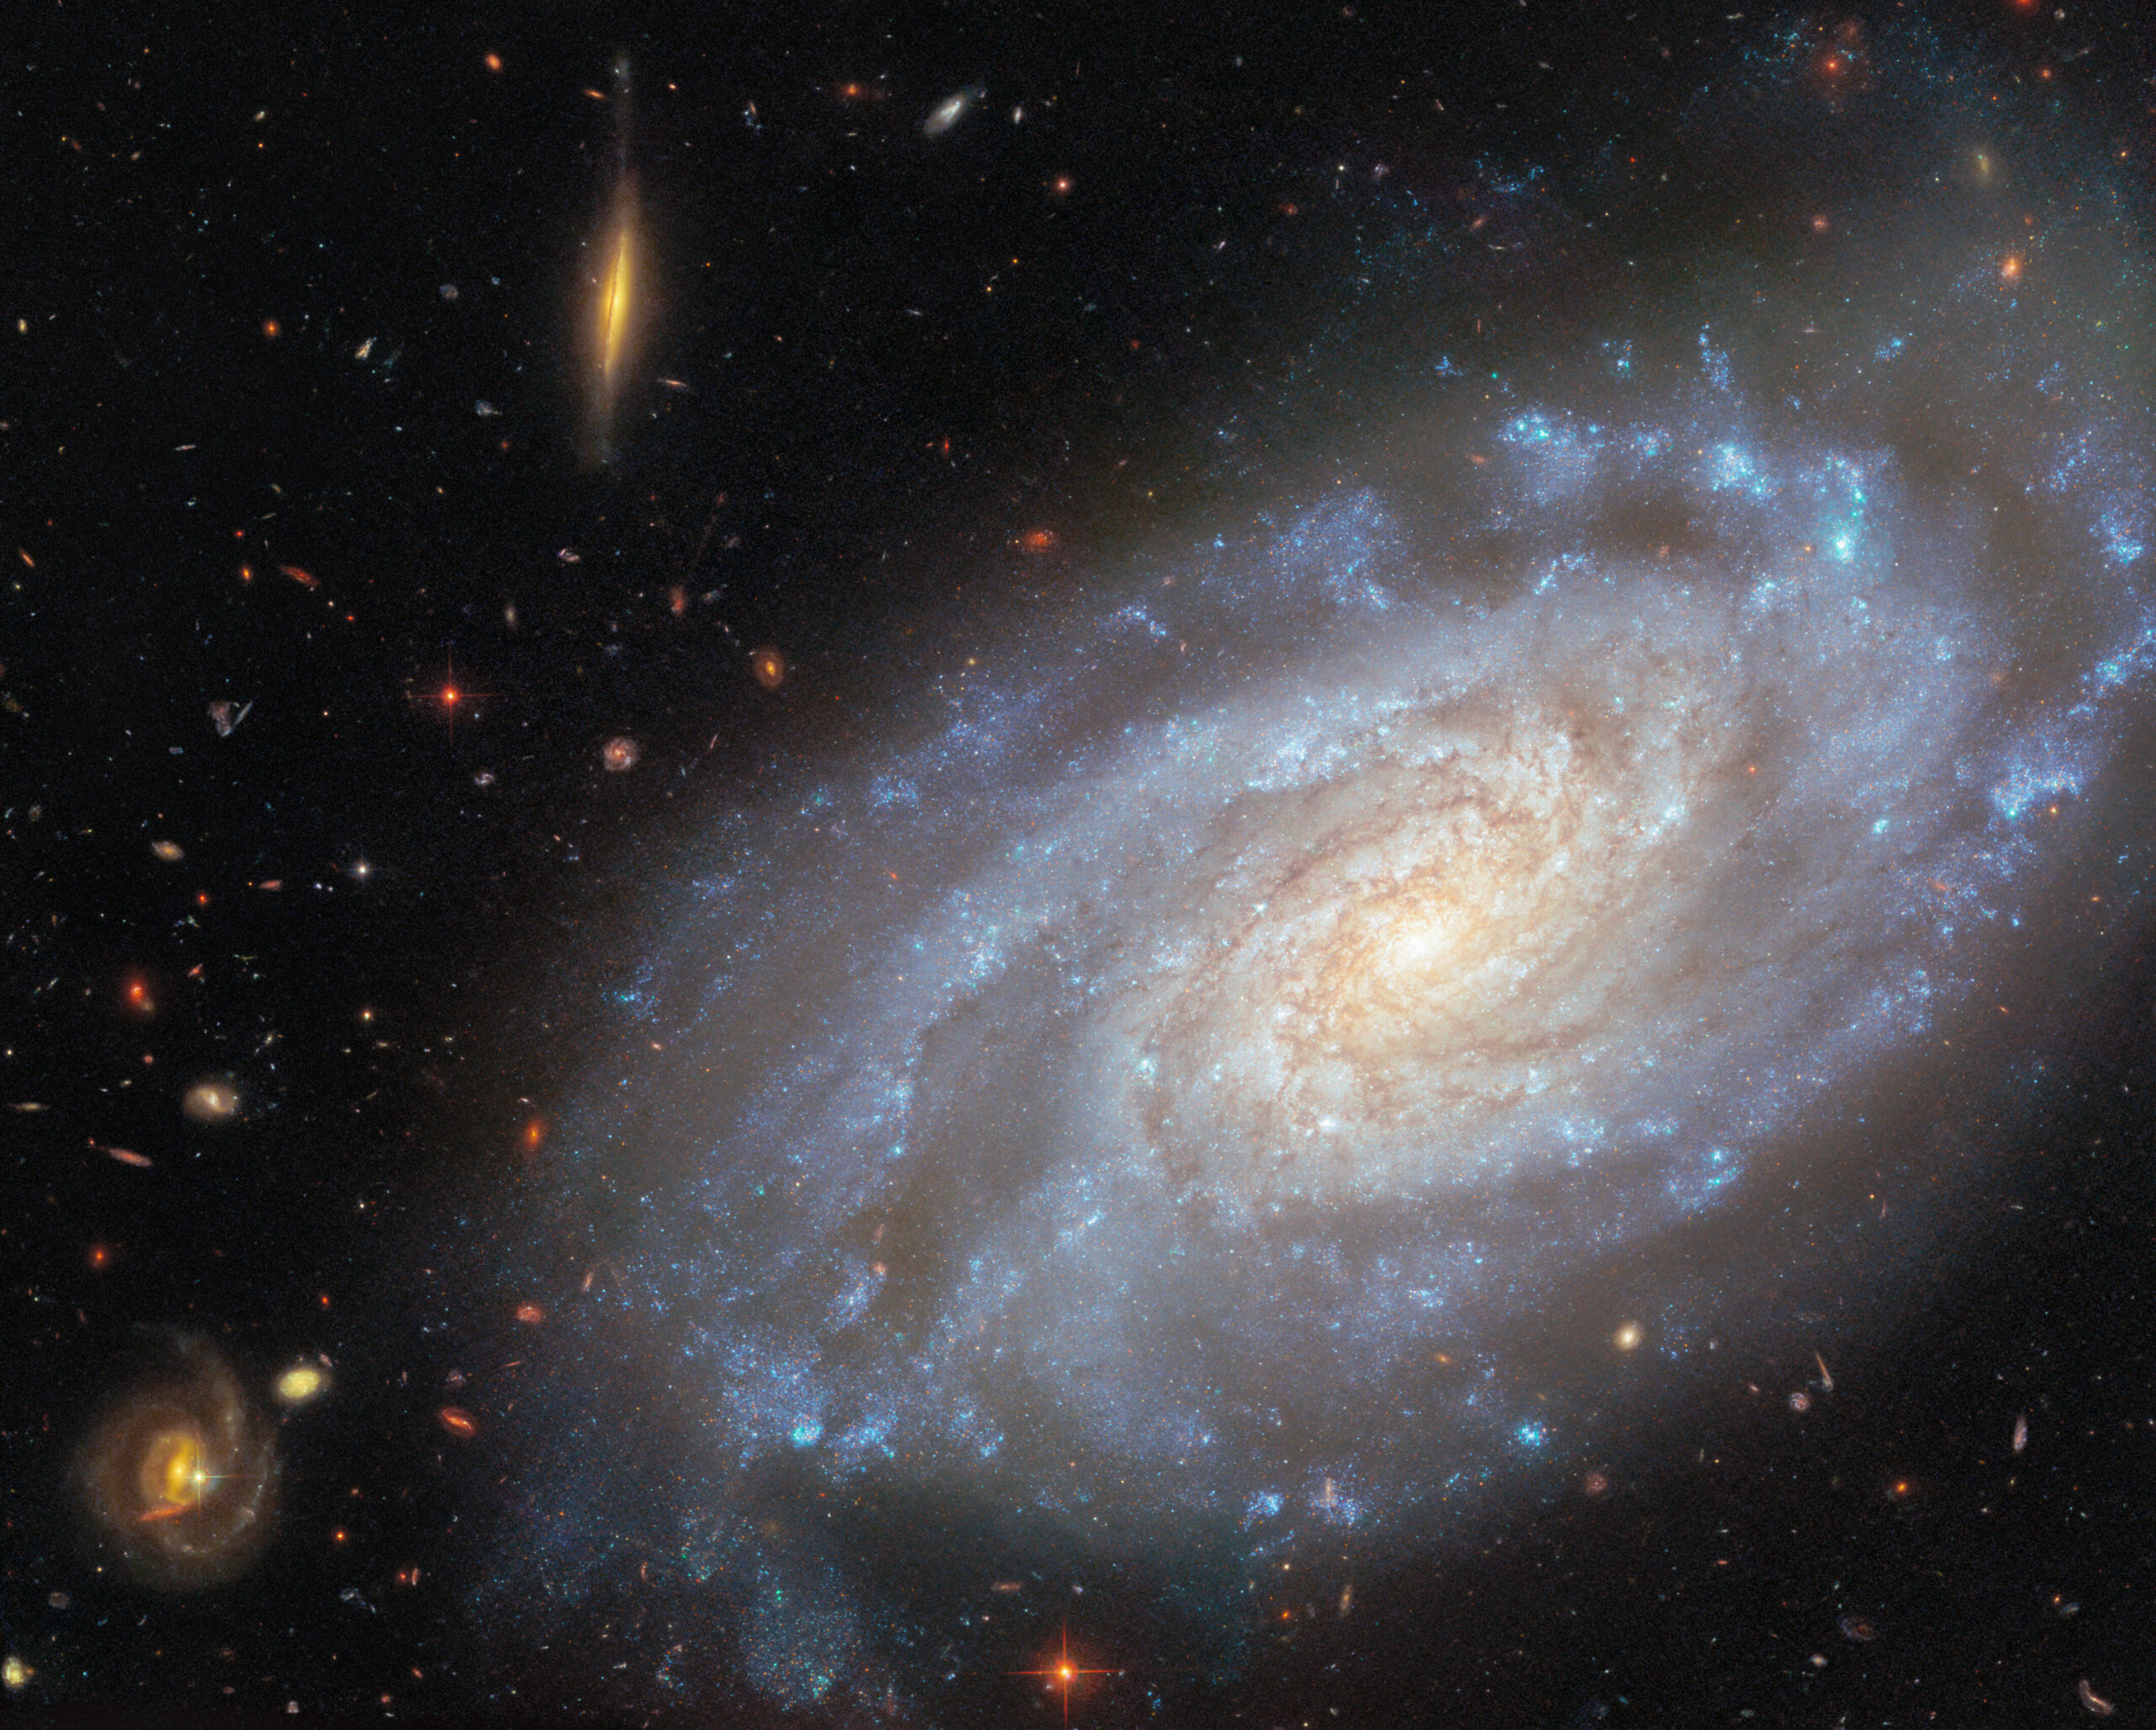
The Hubble Space Telescope has returned its focus to the spiral galaxy NGC 3370, a notable celestial body situated approximately 90 million light-years away in the constellation Leo. Featured as
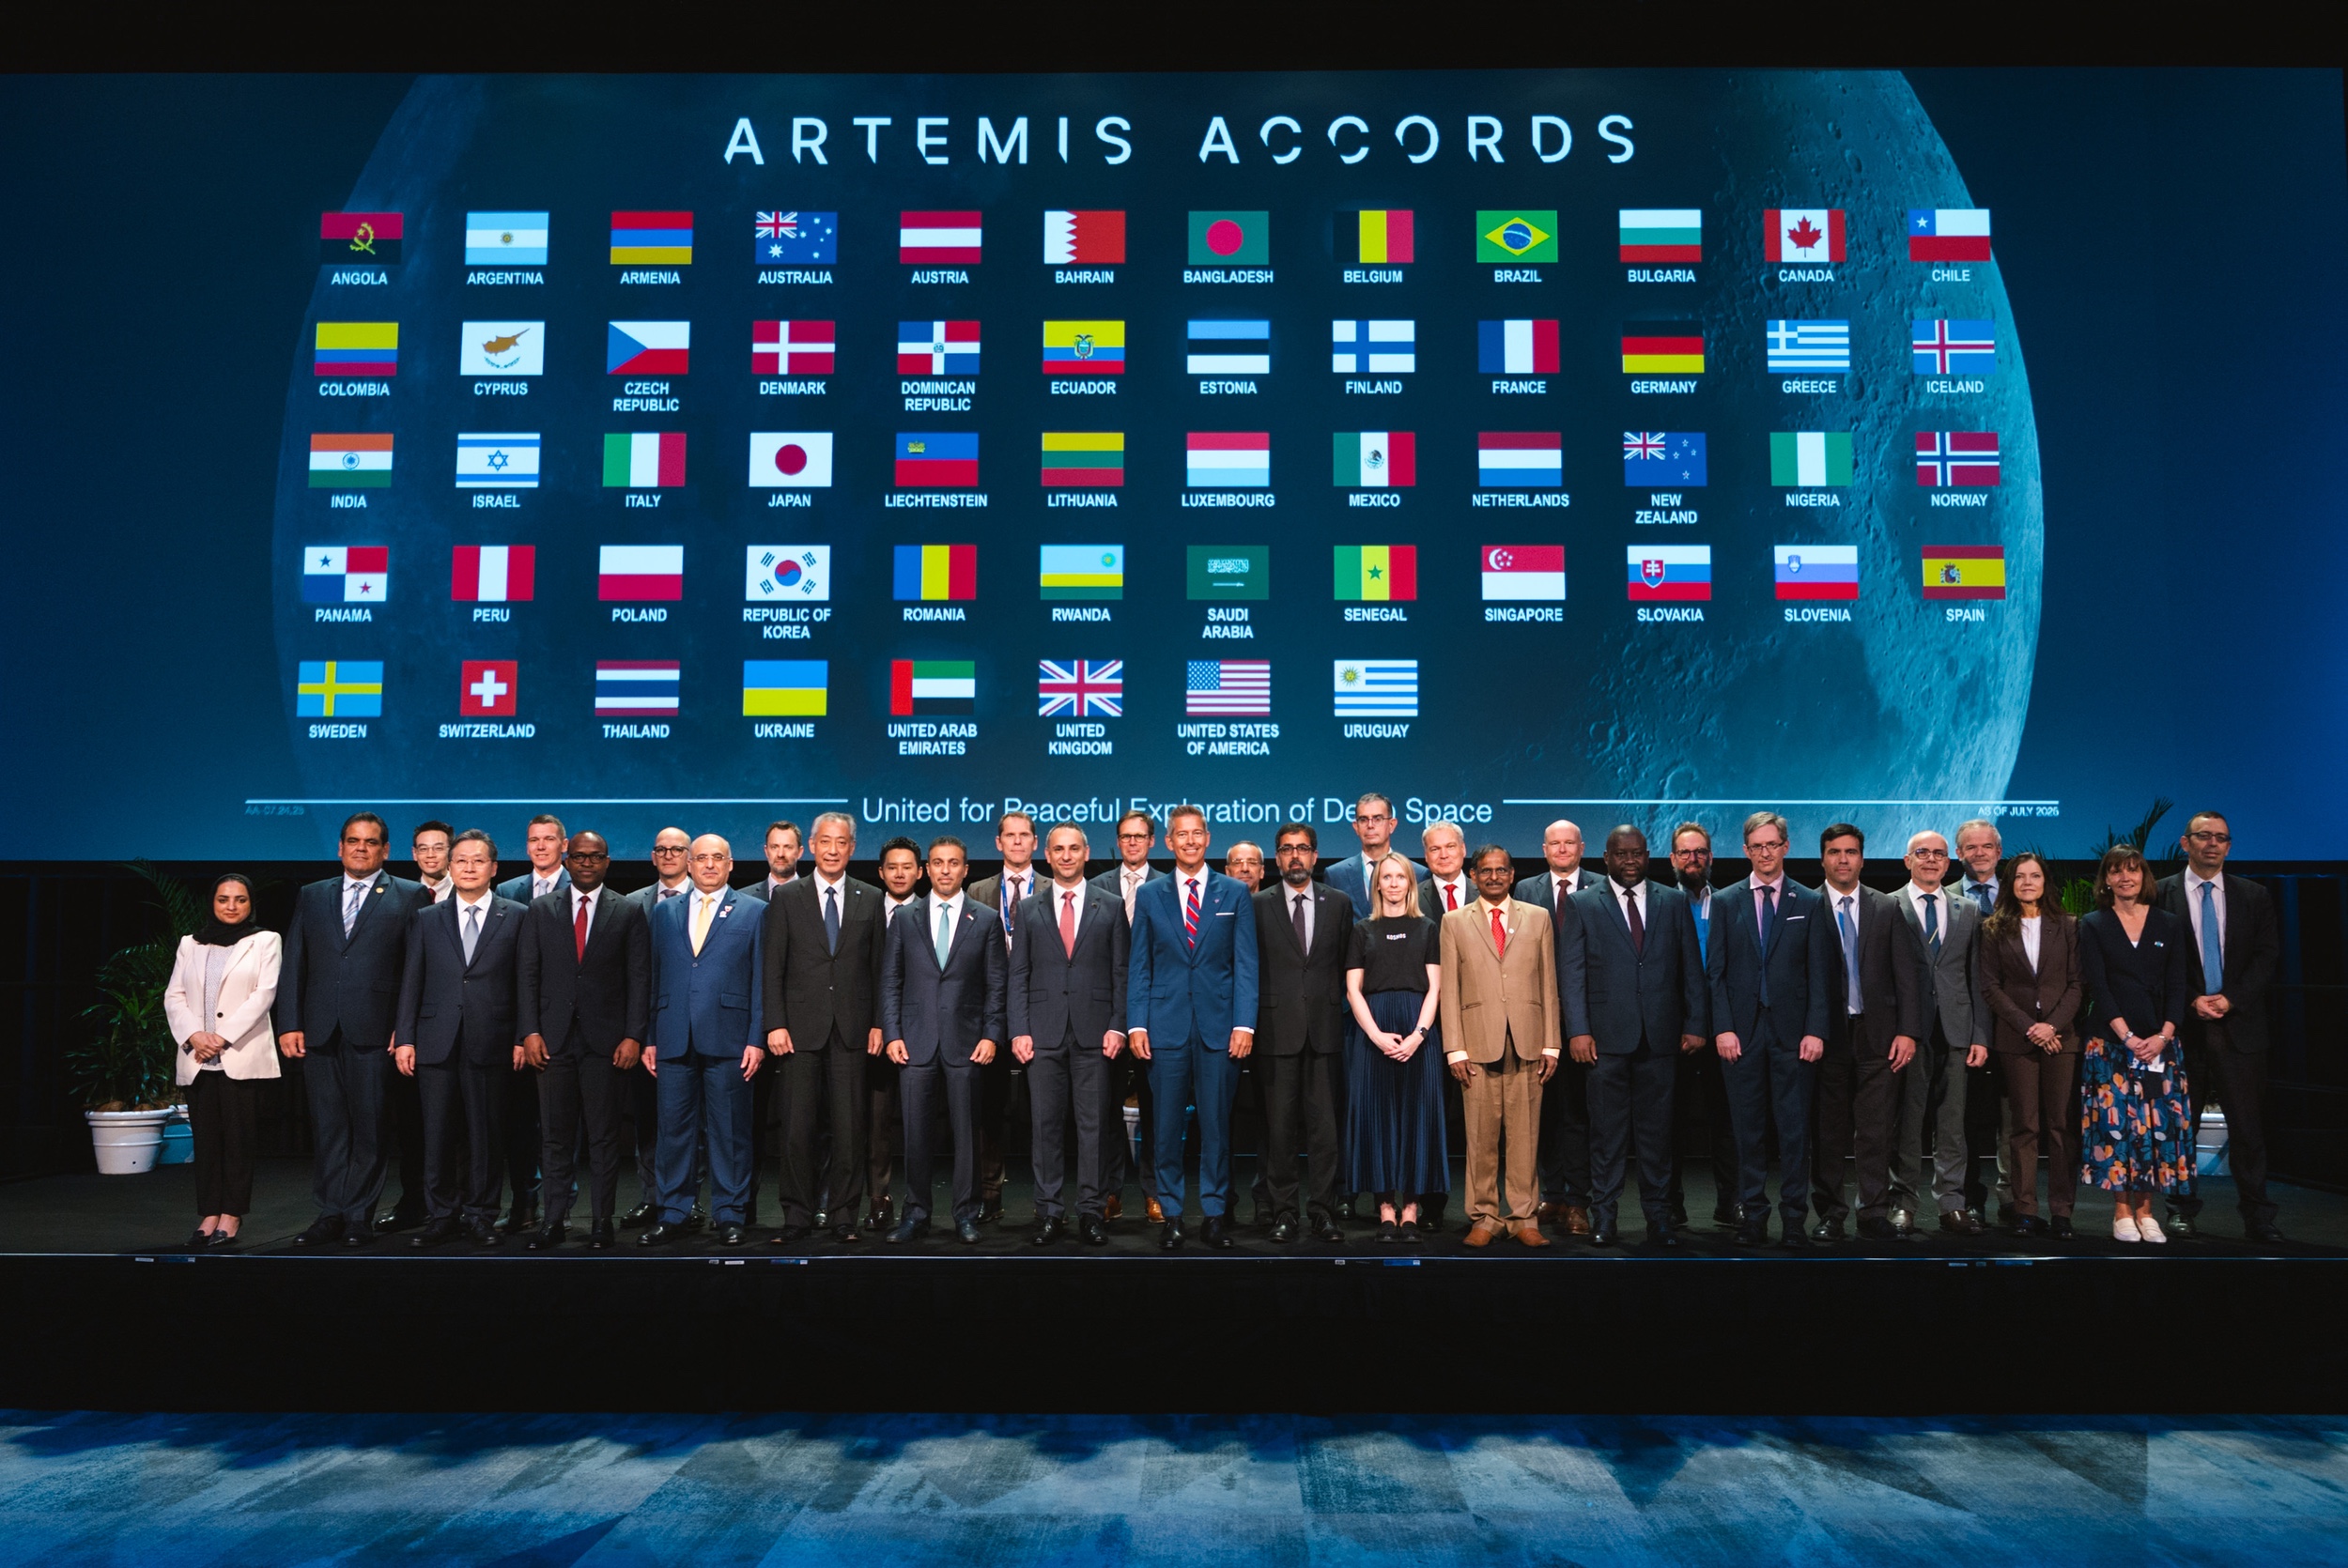
HUNTSVILLE, Ala. — Malaysia and the Philippines have signed the Artemis Accords, which outline norms of behavior for space exploration. The White House announced the signings in an Oct. 26

Applications 29/10/2025 194 views 7 likes Four teams from different countries have been recognised for their breakthrough work in using artificial intelligence to detect earthquake damage from space, marking the