


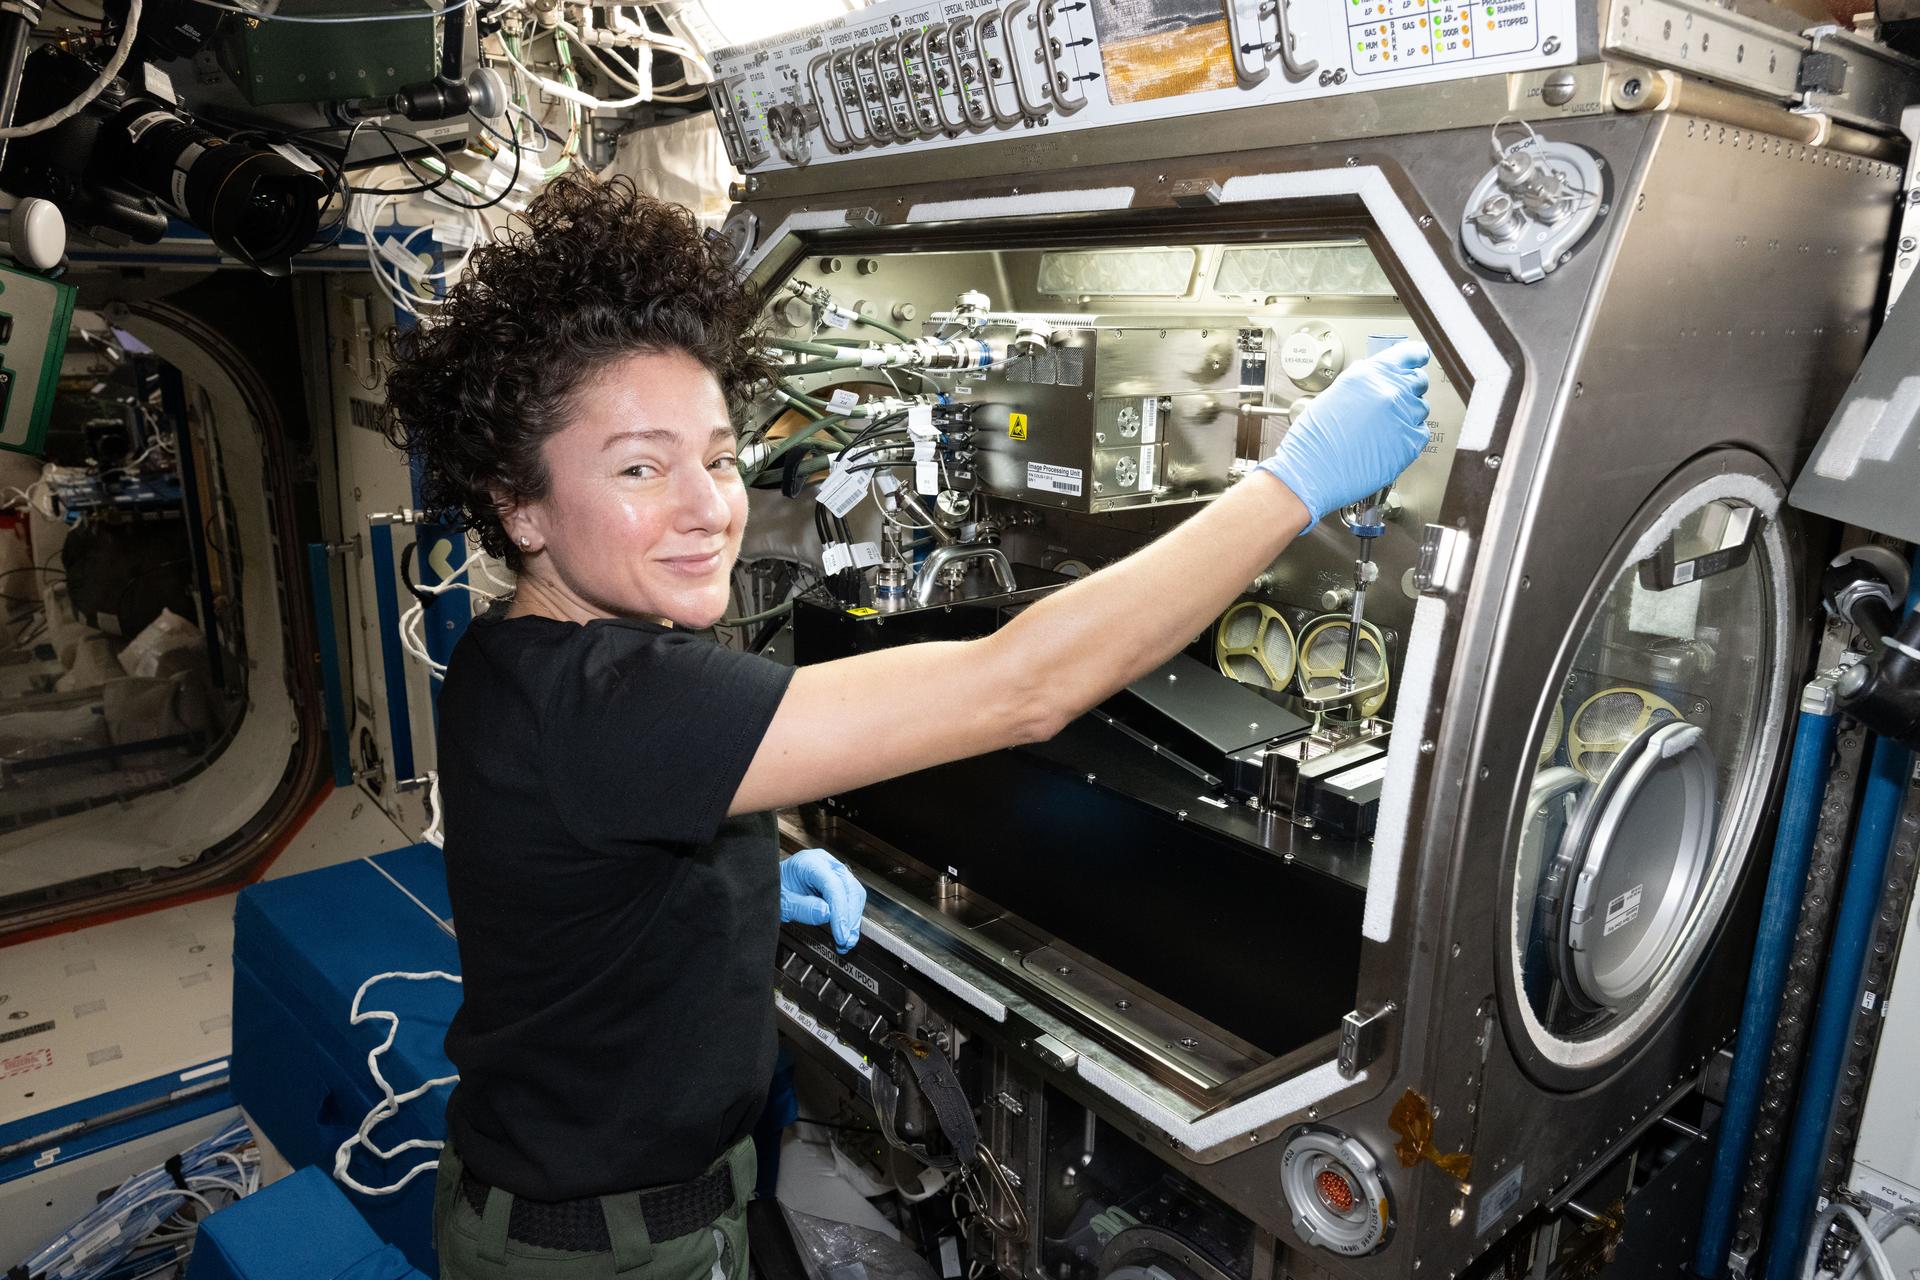
2 min read Preparations for Next Moonwalk Simulations Underway (and Underwater) NASA astronaut and Expedition 74 flight engineer Jessica Meir configures research gear inside the Destiny laboratory module’s Microgravity Science


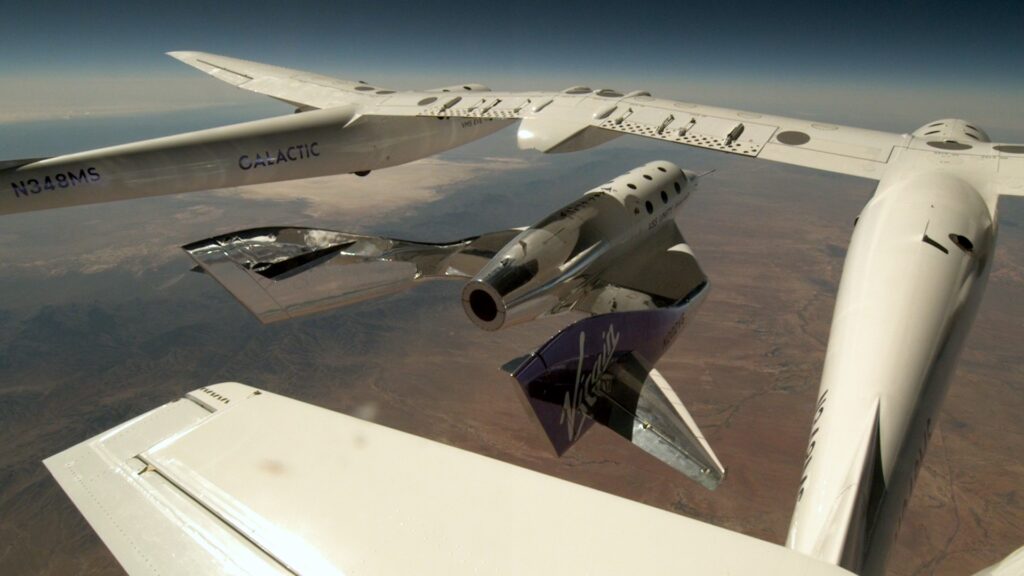
AMSTERDAM — The Virgin Galactic spaceplane used for the company’s first commercial flights has returned to service to train its pilots for its next-generation spacecraft. Virgin Galactic’s VSS Unity spaceplane
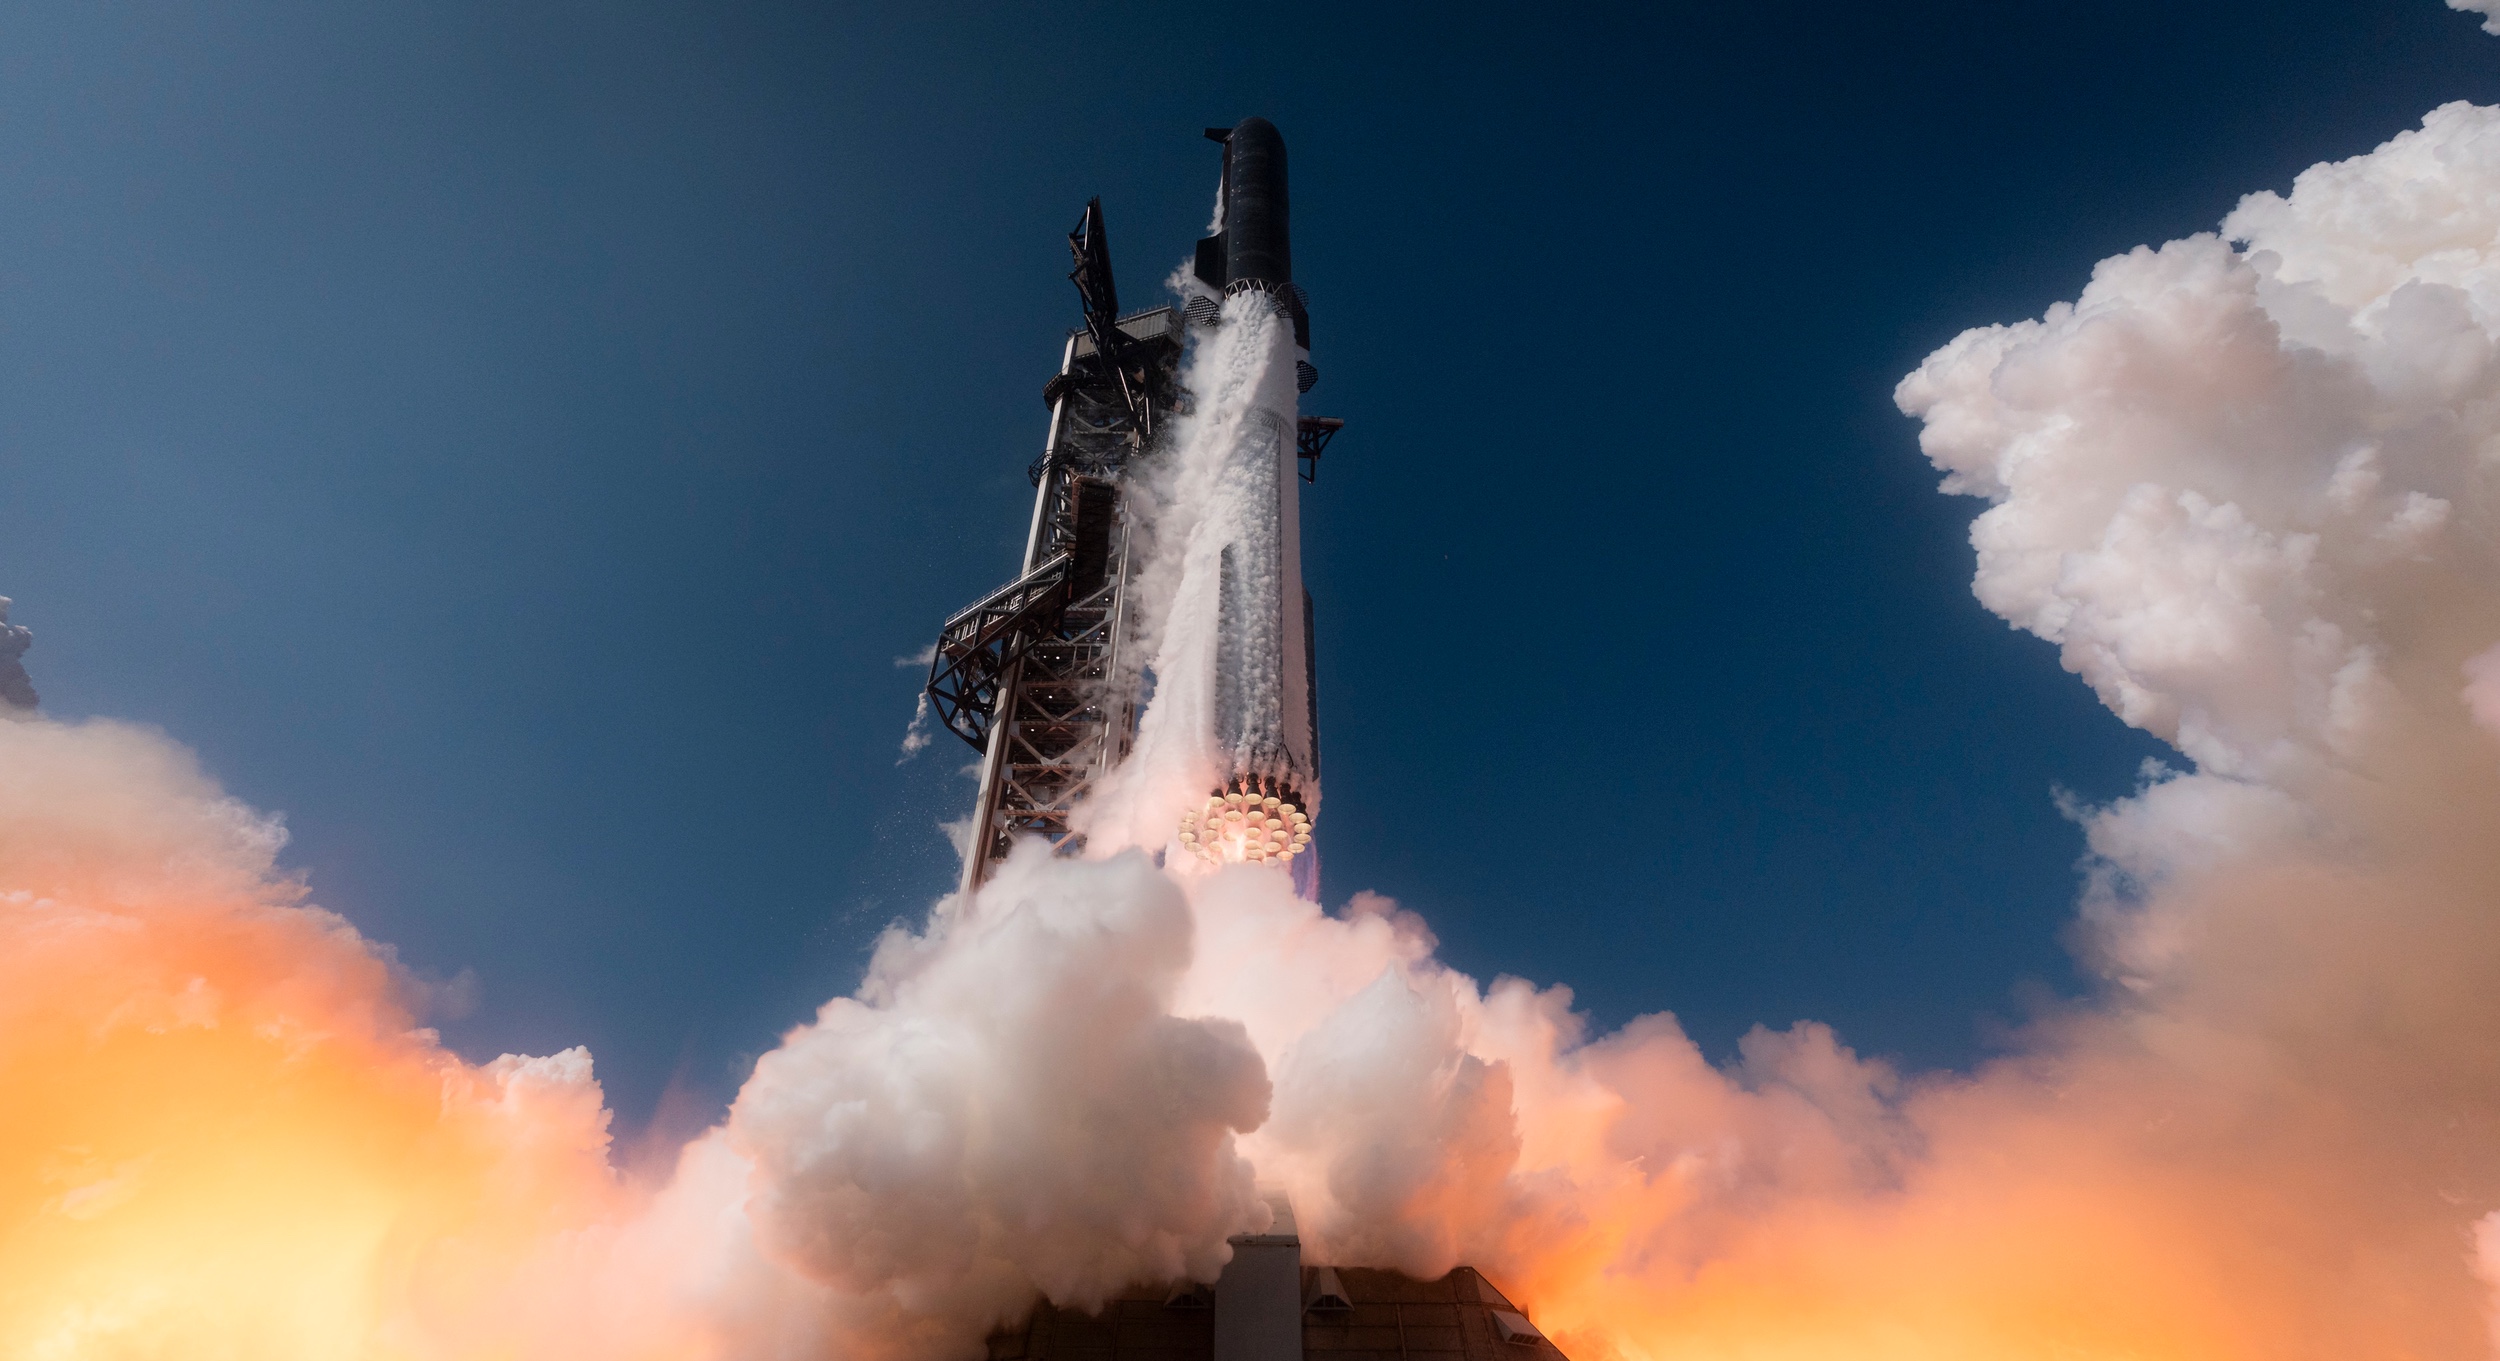
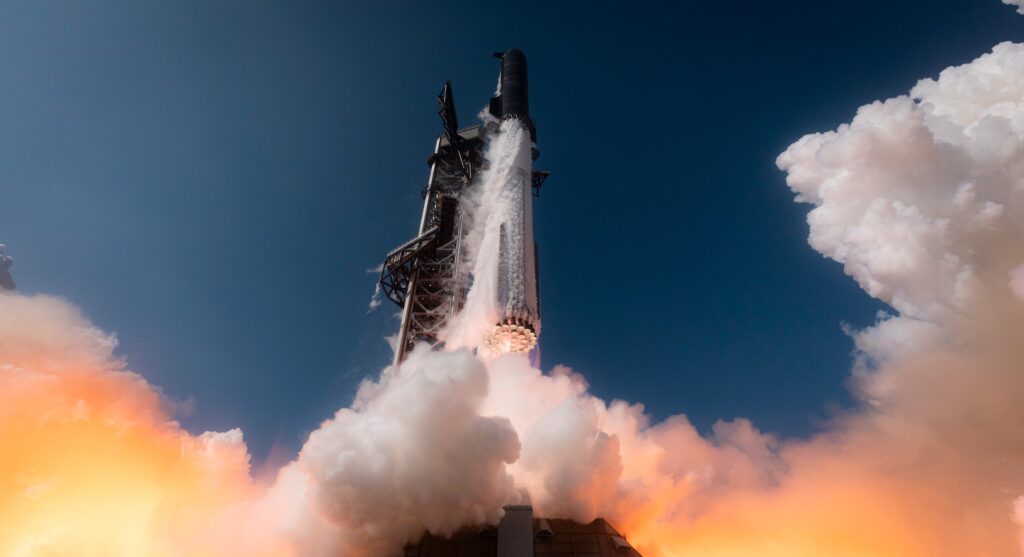
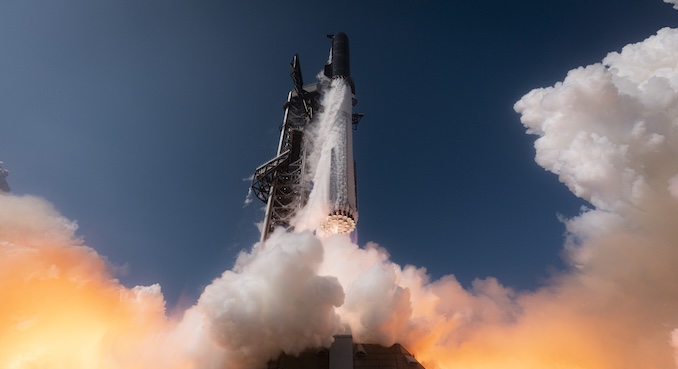
AMSTERDAM — The Federal Aviation Administration will require SpaceX to complete an investigation into its latest Starship test flight before allowing the vehicle to fly again. In a May 27
The LIGO–Virgo–KAGRA (LVK) detector network has a new trick up its sleeve to improve the instruments’ sensitivity to gravitational waves: it’s called Astrophysical Calibration and it plays a role similar
2 min read Preparations for Next Moonwalk Simulations Underway (and Underwater) NASA astronaut and Expedition 74 flight engineer Jessica Meir configures research gear inside the Destiny laboratory module’s Microgravity Science

Masters of The Universe – Official Final Trailer – YouTube Watch On If the sight of the hulking He-Man charging into the fray atop a snarling Battle Cat doesn’t get
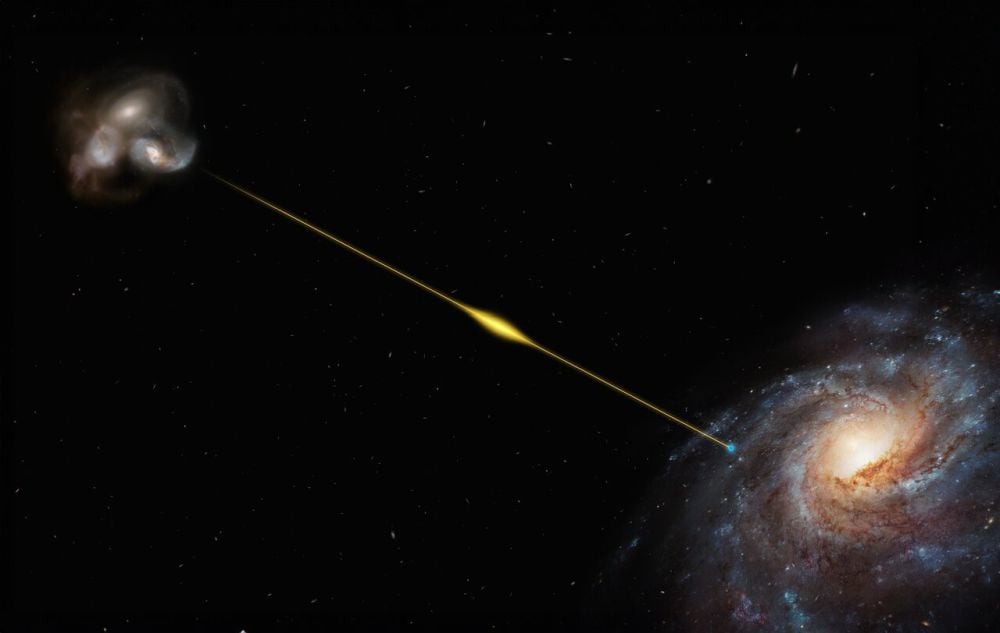
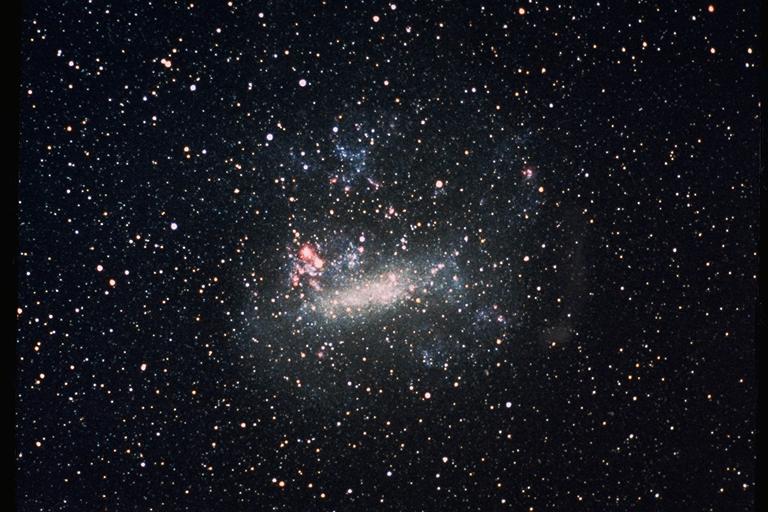
In the heirarchy of black holes, intermediate mass black holes (IMBH) lie in between stellar mass black holes and supermassive black holes. But the problem is that we’ve never found
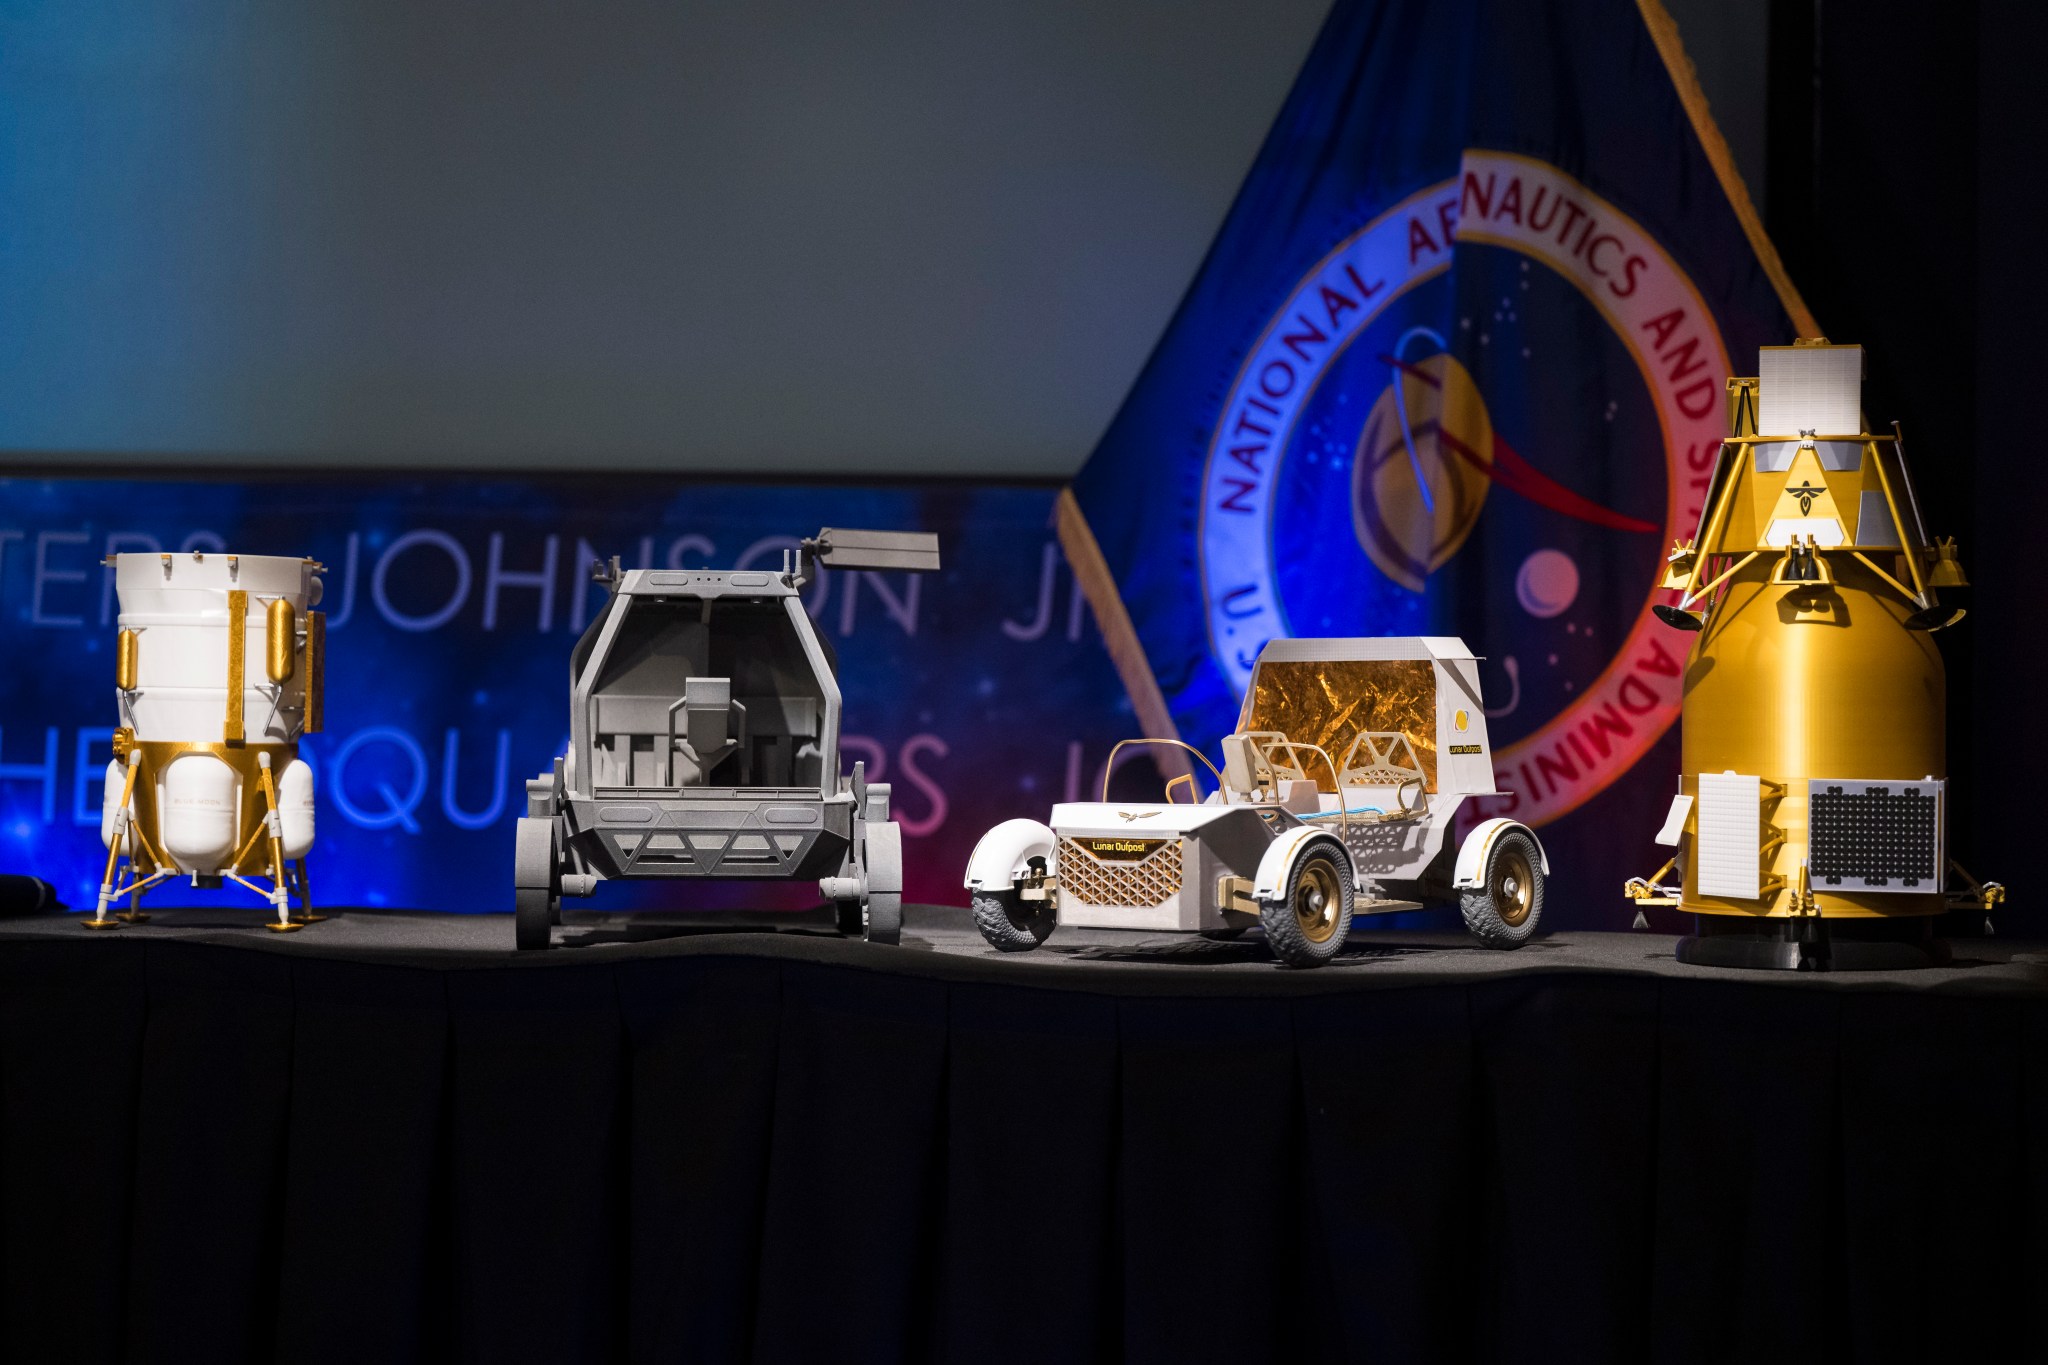
From left to right, models of the Blue Origin Mark 1 Lunar Lander, Astrolab Crewed Lunar Rover, Lunar Outpost Pegasus rover, and the Firely Elytra Dark orbiter are seen at
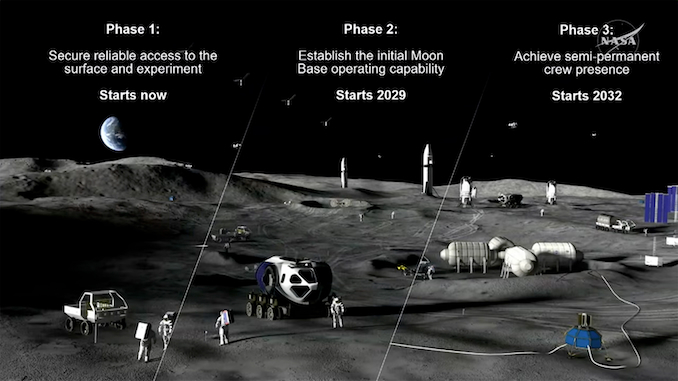
NASA plans to build a planned moon base in three stages, starting with more frequent astronaut and cargo flights to the moon the develop the infrastructure needed to support long-duration
Researchers from the University of Glasgow’s Institute for Gravitational Research are celebrating the publication of a vast new treasure trove of gravitational wave detections, hailed as a milestone marking the

TAMPA, Fla. — Starcloud has ordered optical terminals from SpaceX to use Starlink as a global data-relay network for its future orbital data centers, deepening ties with the company it

AMSTERDAM – The recent surge in European defense spending could bolster Europe’s entrepreneurial space sector, but only if bureaucratic roadblocks are cleared, panelists said at the SmallSat Europe conference. While
A lunar presence is needed for crewed missions to go deeper into space.

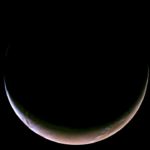
ID: ESP_072381_1430 date: 4 January 2022 altitude: 254 km NASA/JPL-Caltech/University of Arizona Large image Every winter, a layer of carbon dioxide frost (dry ice) forms on the surface of Mars.