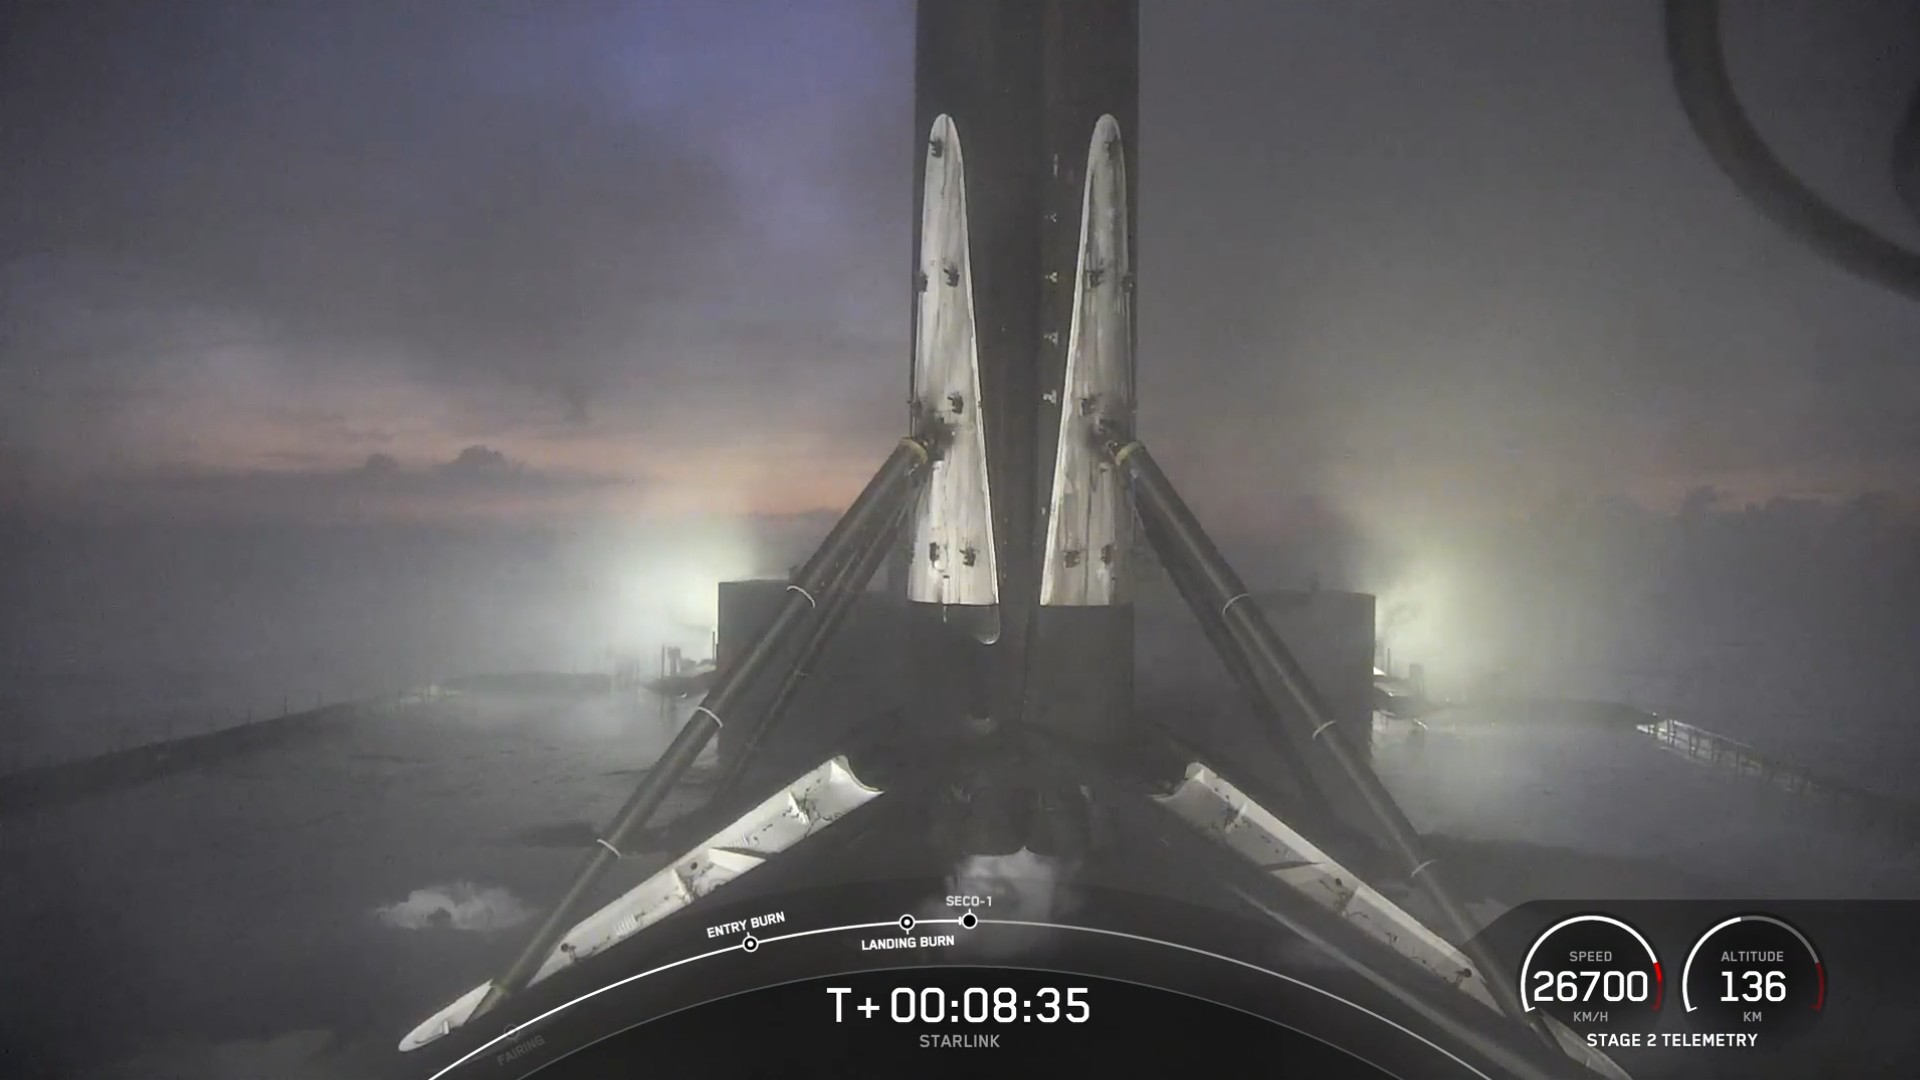
Just months after SpaceX landed a Falcon 9 rocket in the Bahamas for the first time, the country has hit pause on future landings pending an environmental review, according to

Just months after SpaceX landed a Falcon 9 rocket in the Bahamas for the first time, the country has hit pause on future landings pending an environmental review, according to
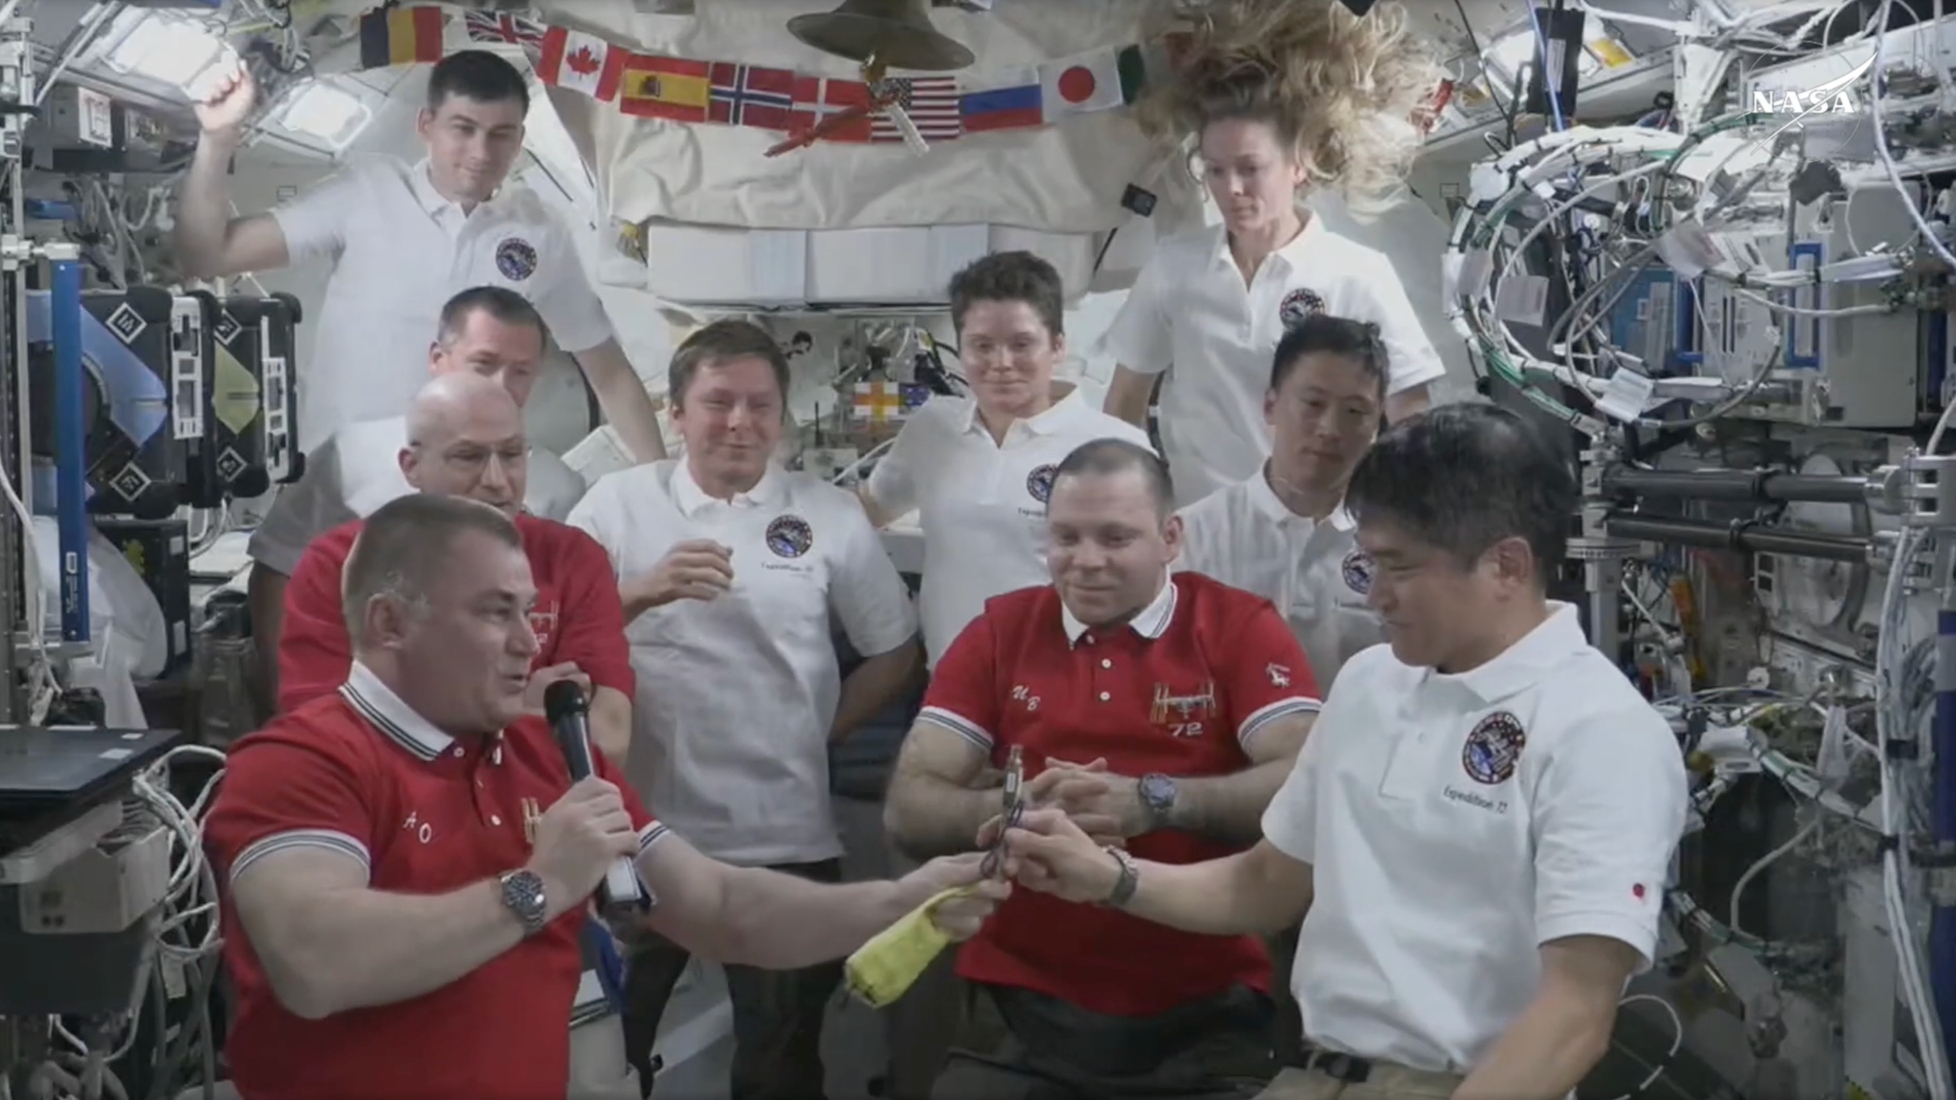
The keys to the International Space Station just changed hands. Cosmonaut Alexey Ovchinin of the Russian space agency Roscosmos passed control of the orbiting lab over to Takuya Onishi of
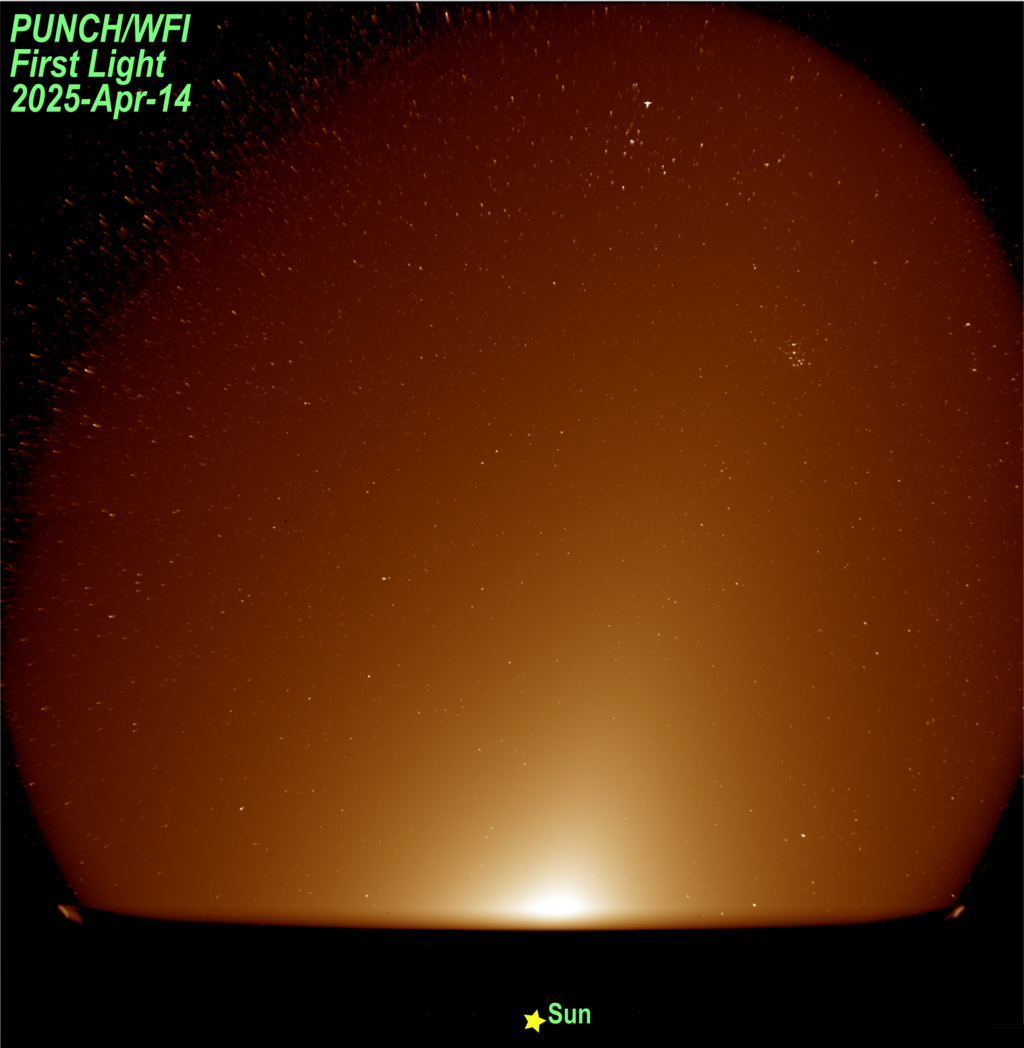
Scientists announced on Friday (April 18) that the newest solar investigator in town has captured its first-light images — or should I say the newest solar investigators. That is, this
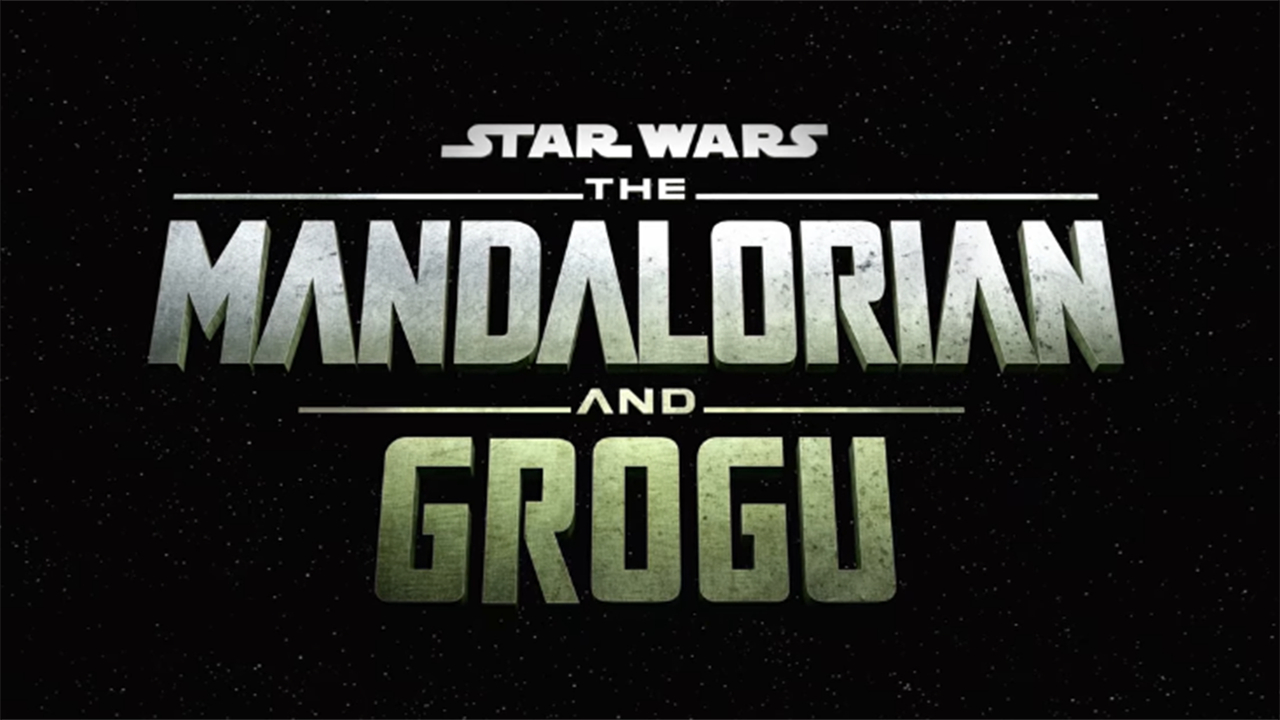
Despite some stumbles along the way, most fans agree The Mandalorian season 3 ended strong with a season finale that felt conclusive (mostly). With The Mandalorian & Grogu set to
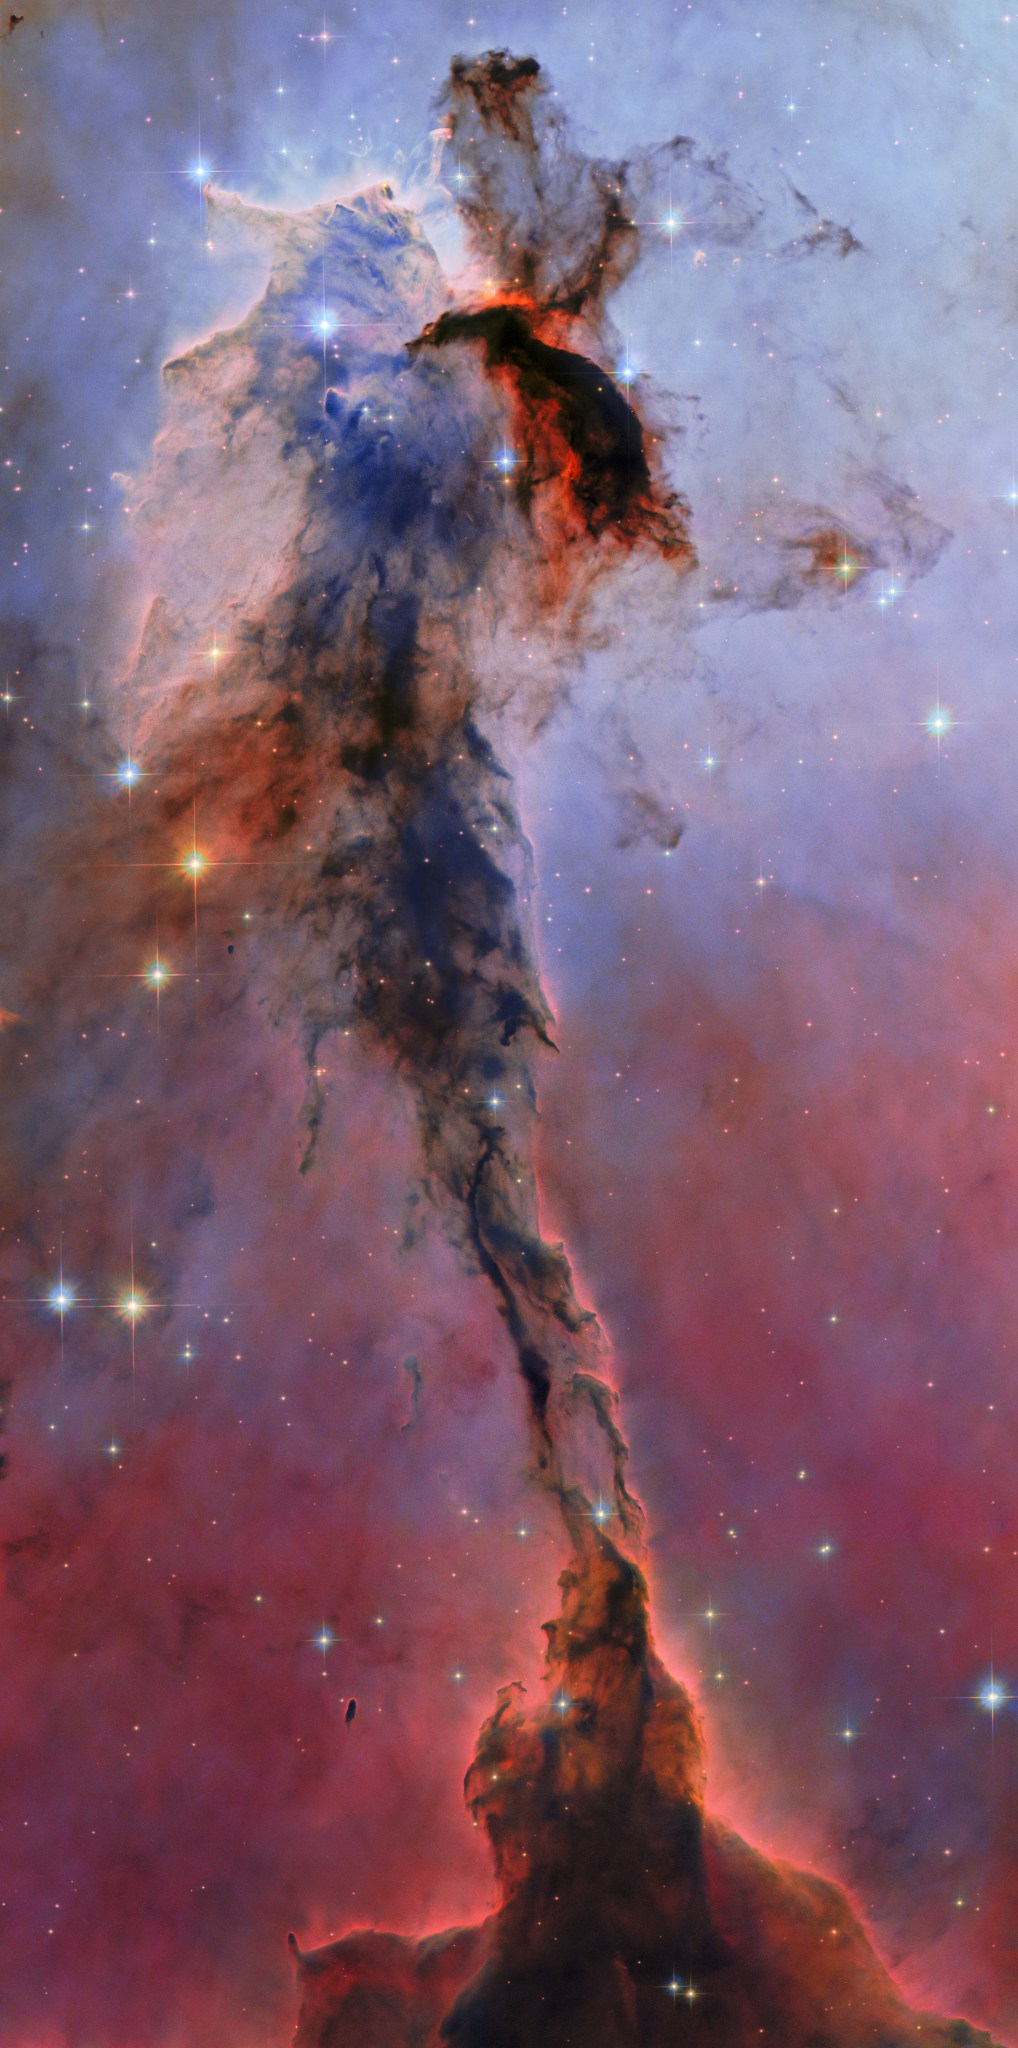
ESA/Hubble & NASA, K. Noll This newly reprocessed image released on April 18, 2025, provides a new view of an enormous, 9.5-light-year-tall pillar of cold gas and dust. Despite its
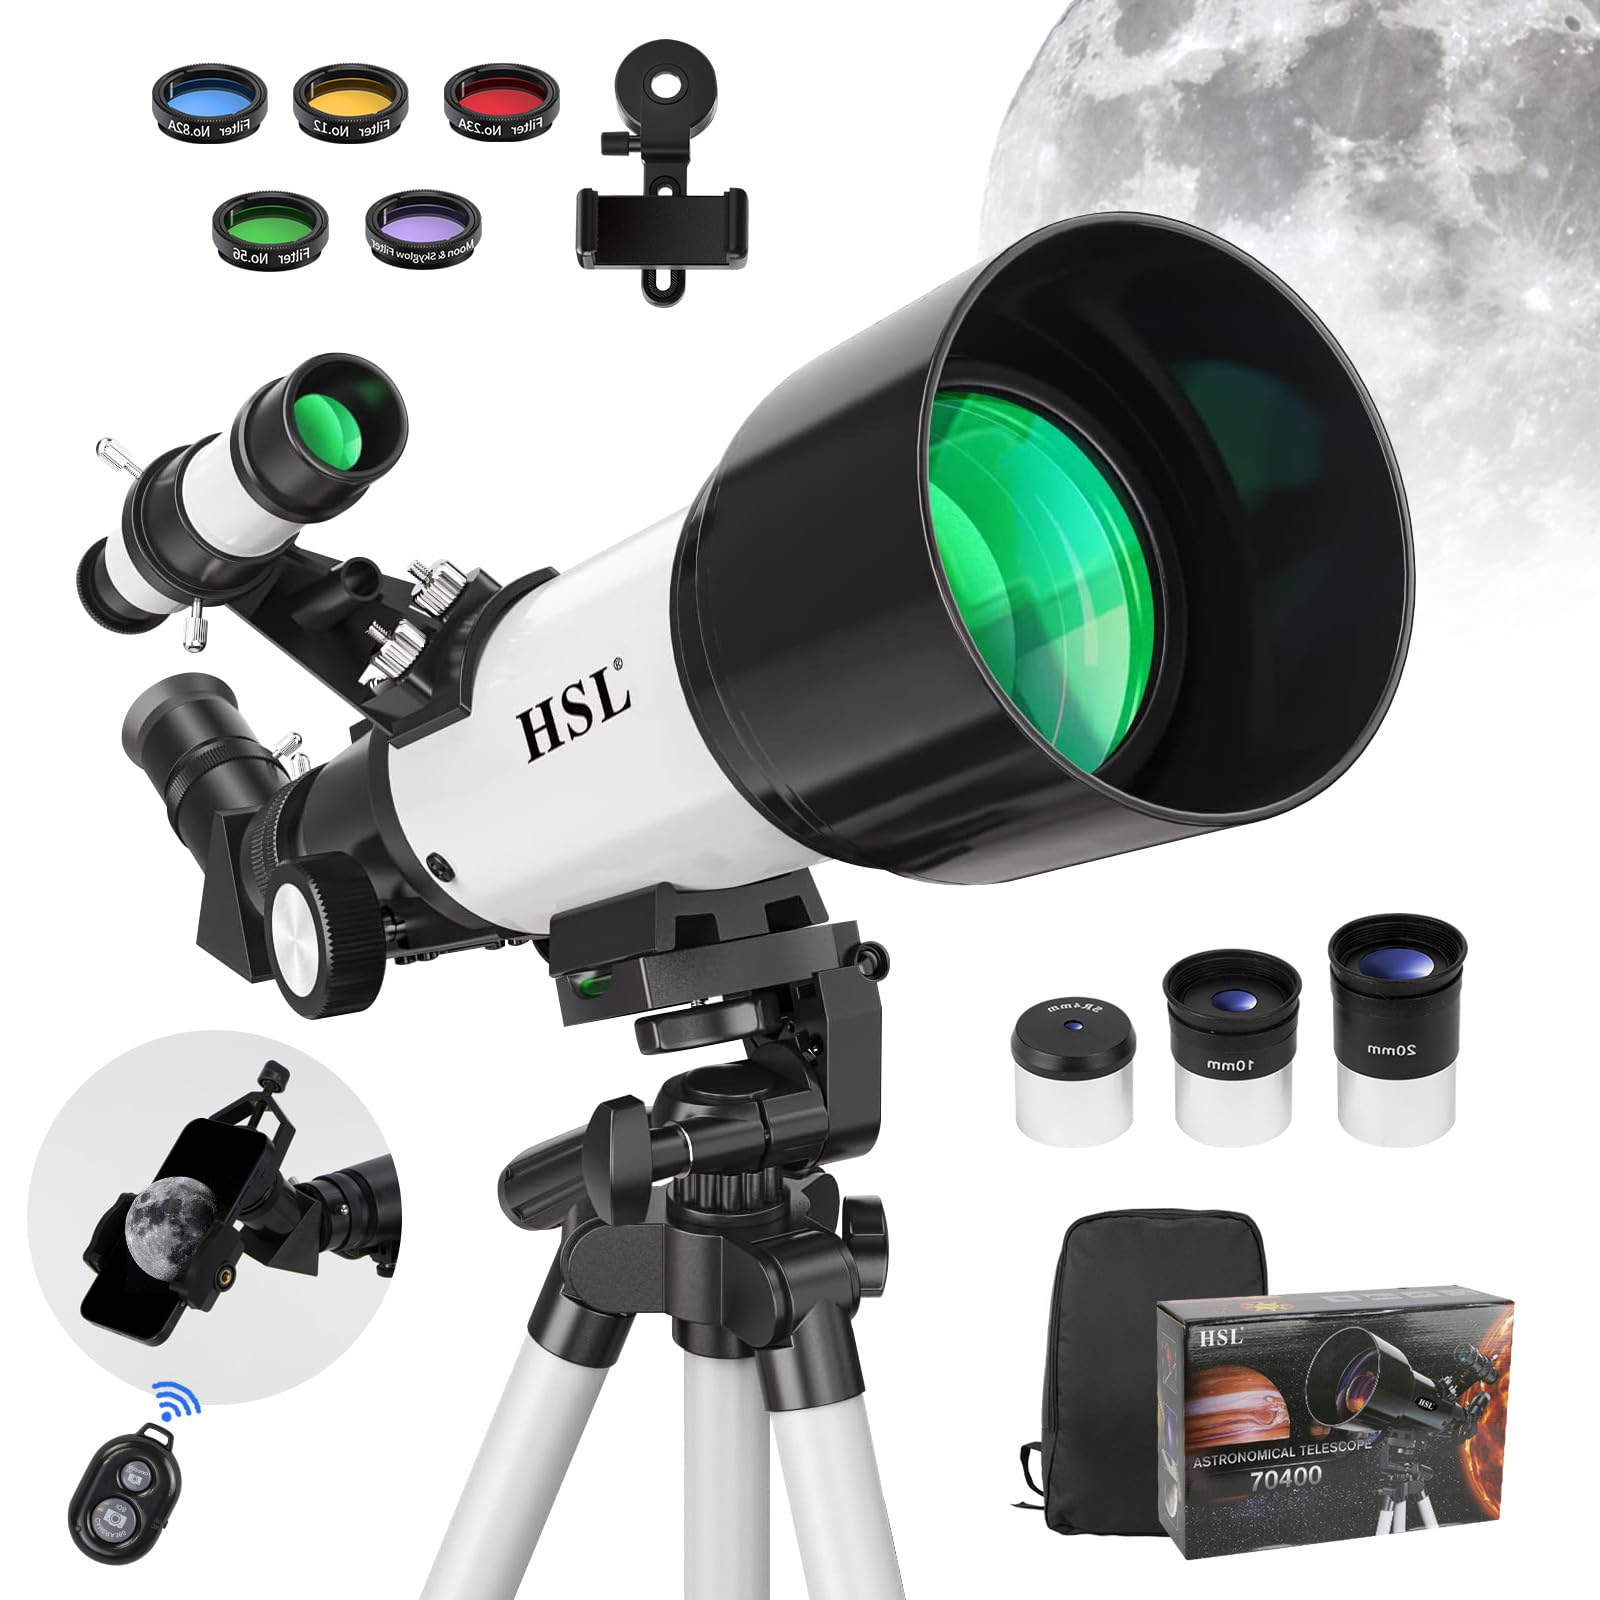
With the current focus on where the mysteries of the cosmos beckon to both the young and the young at heart, the HSL Telescope emerges as a beacon for budding
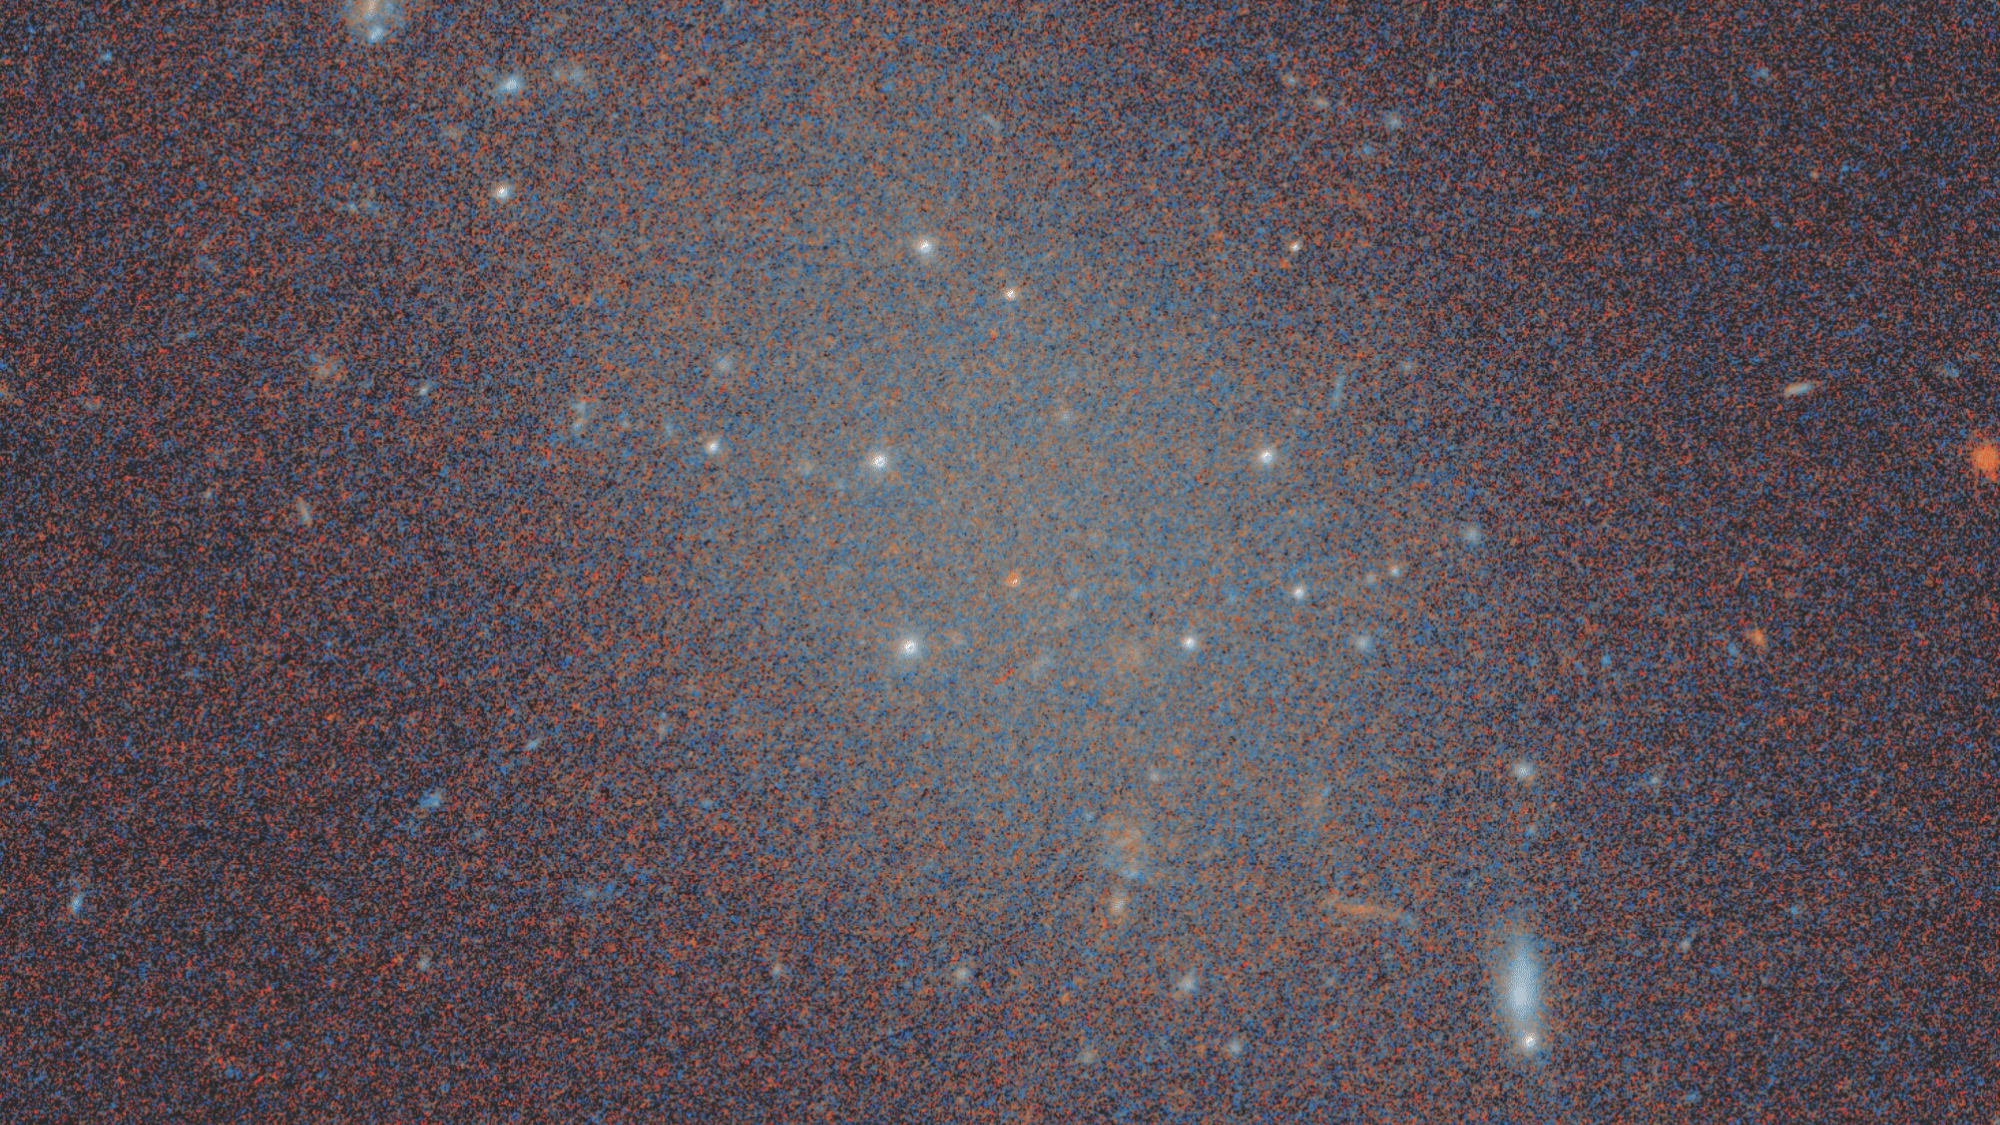
Astronomers have stumbled upon yet another ghostly galaxy that appears to be devoid of dark matter. Dark matter, the invisible substance astronomers believe dominates the universe, provides the gravitational scaffolding
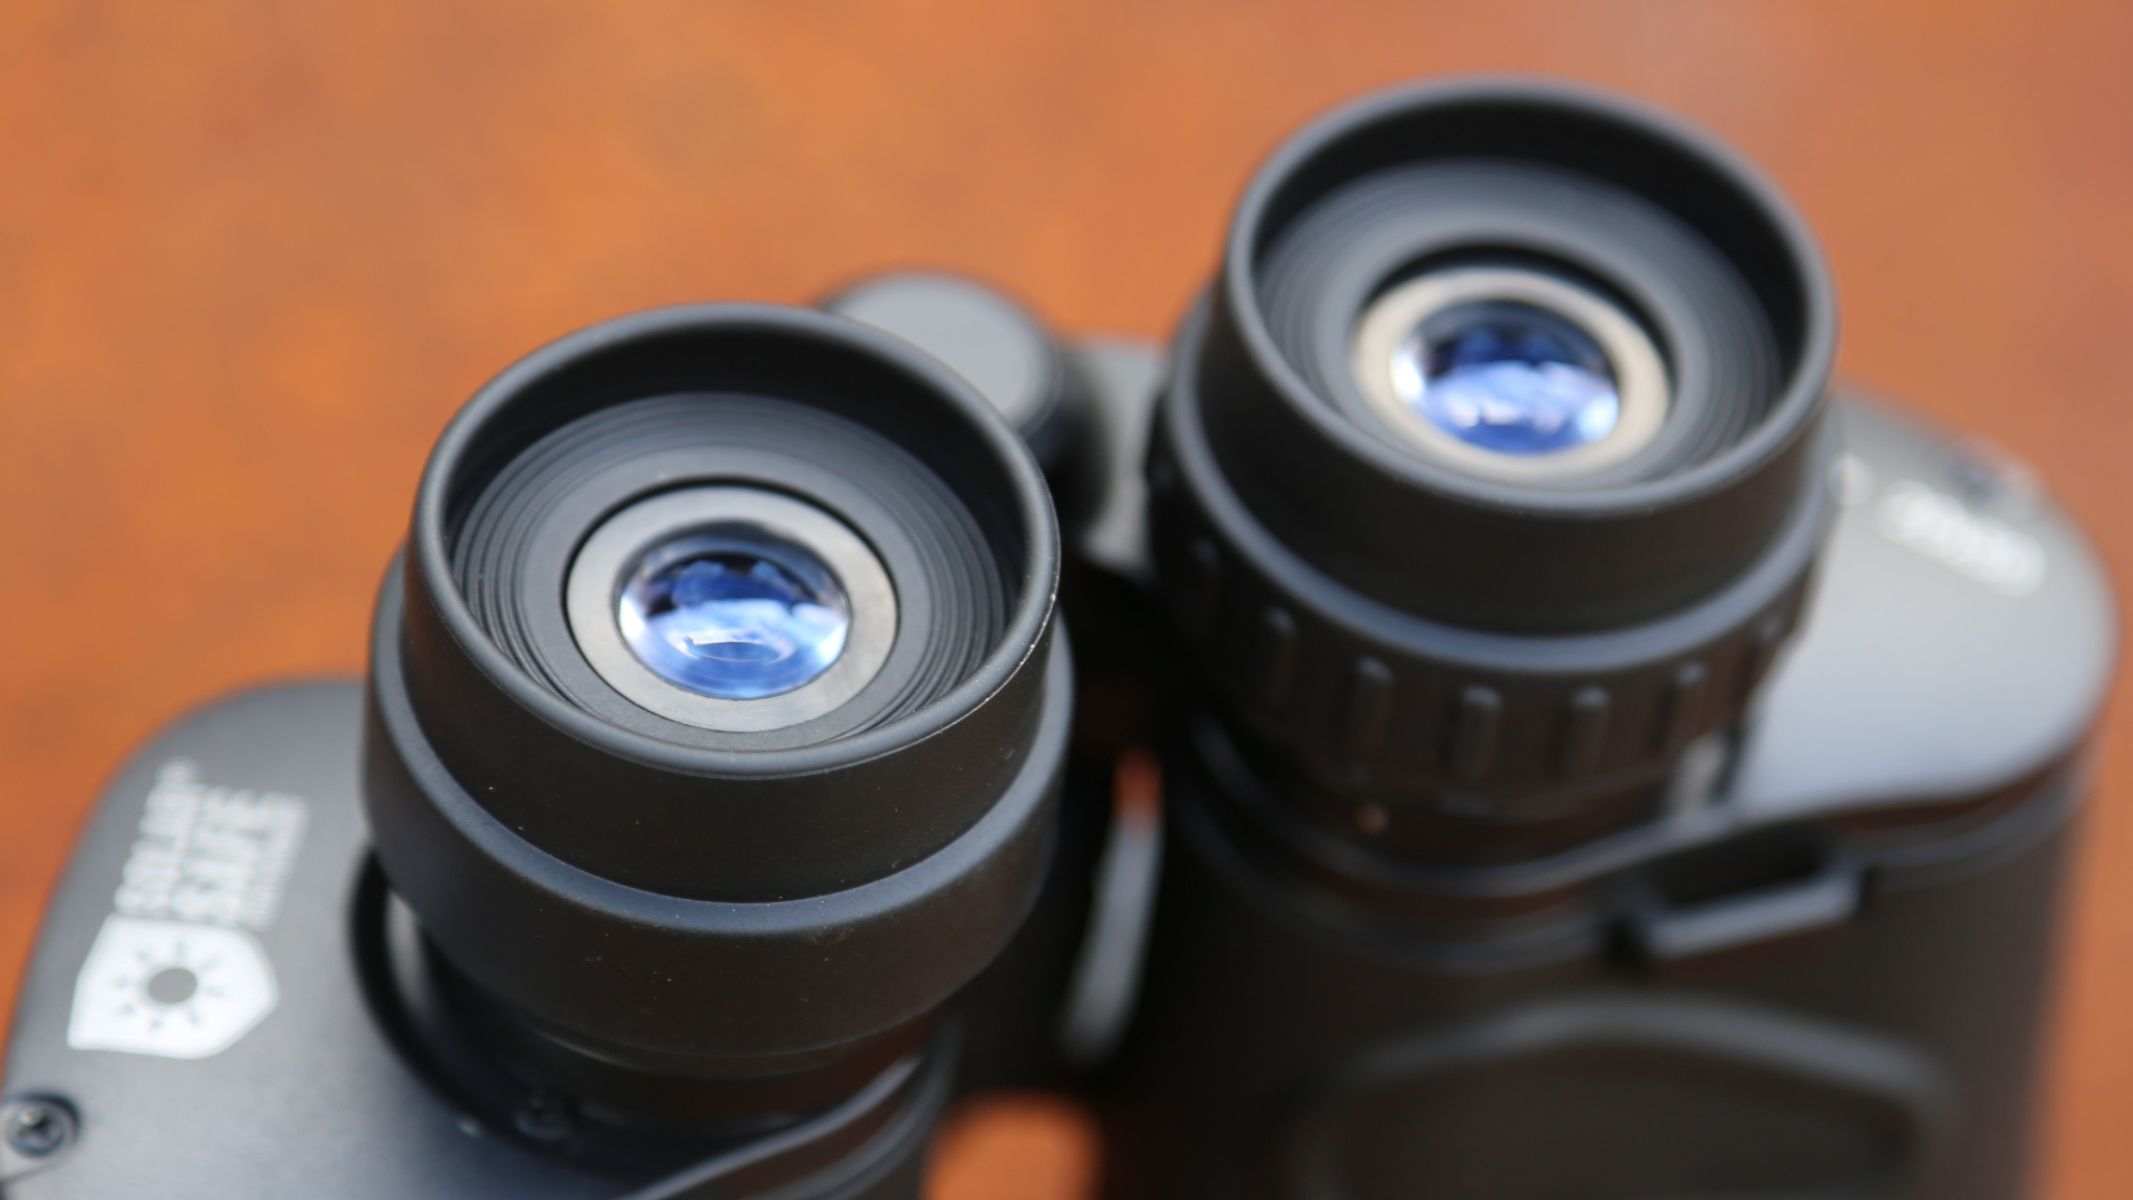
Specifications Optics: BK-7 Solar filter: White-light solar filter (ISO 12312-2:2015(E)) Design: Porro prism Magnification: 20x Objective lens diameter: 50 mm Waterproof/fog-proof: Water resistant Eye relief: 8 mm Weight: 1.96 pounds
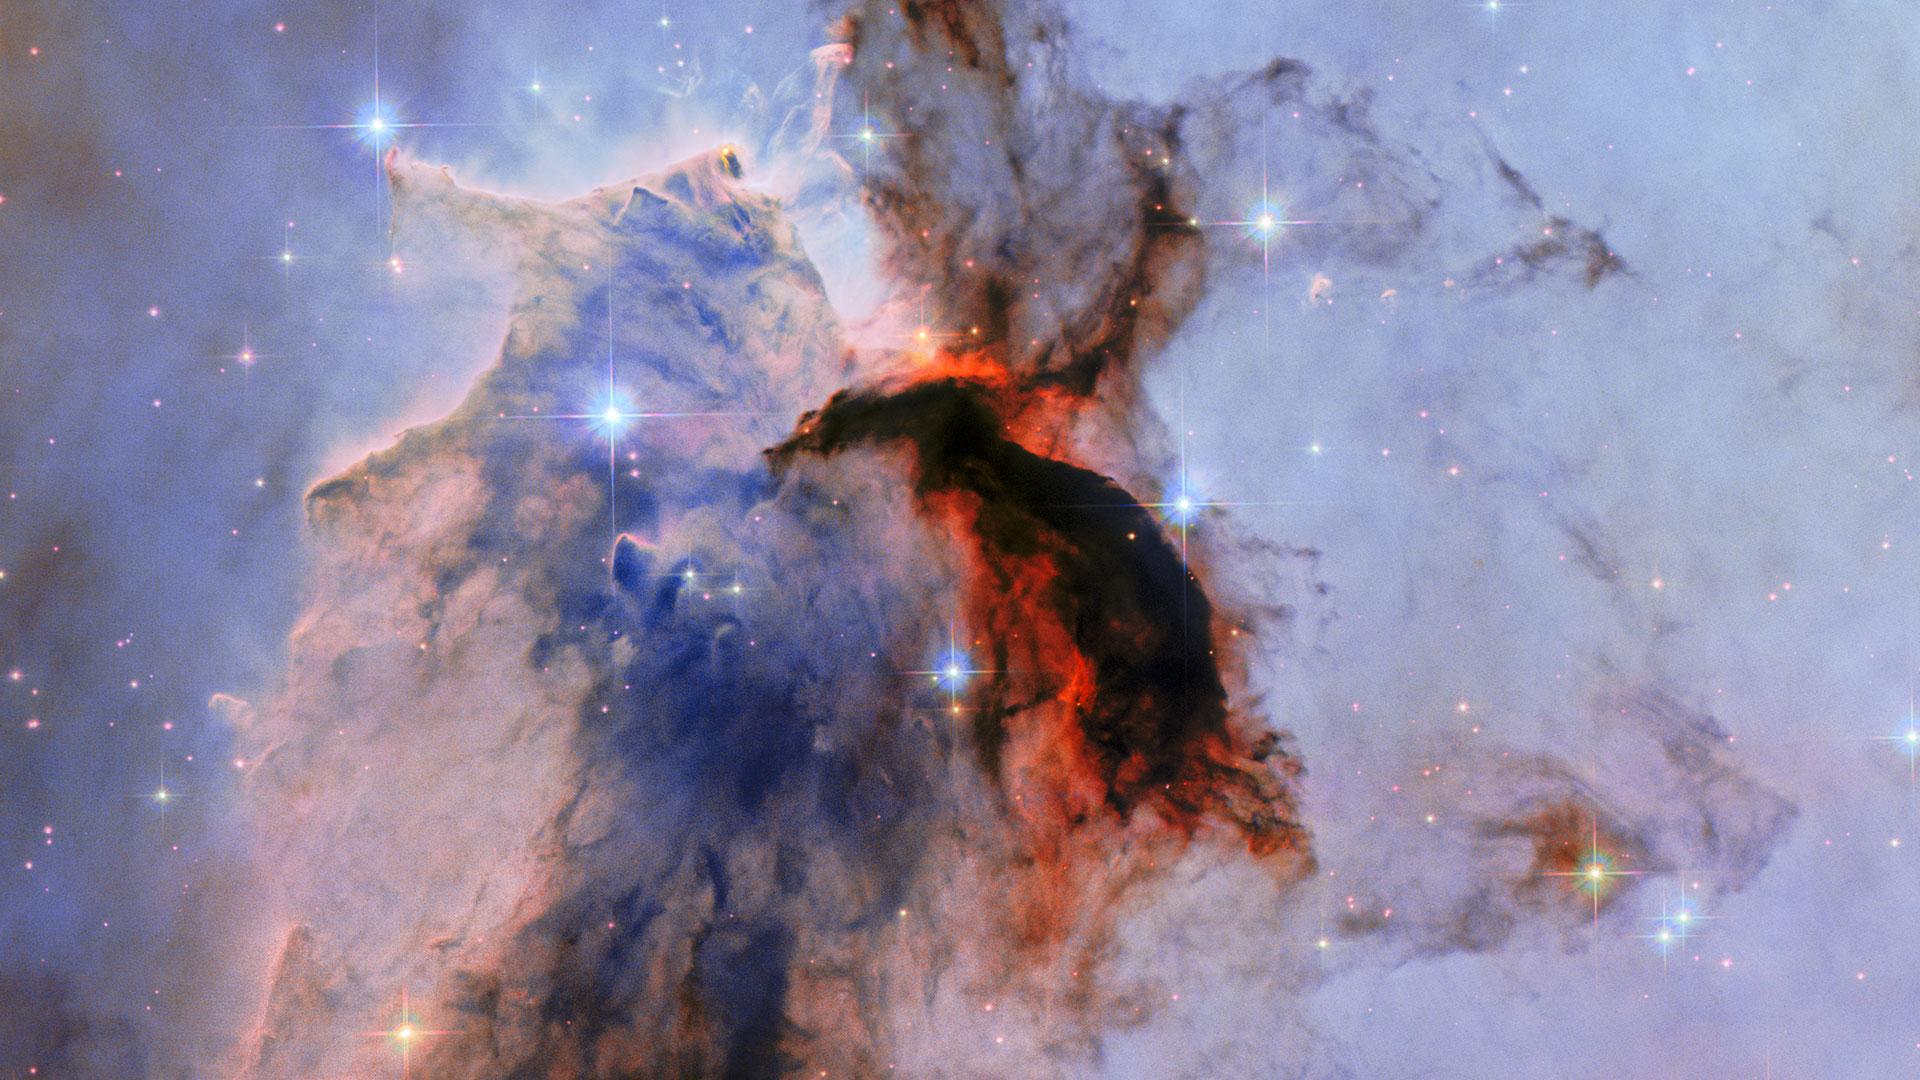
A vast stellar nursery in the Eagle Nebula is seen as a towering spire of gas and dust through the use of the Hubble Space Telescope and new data processing
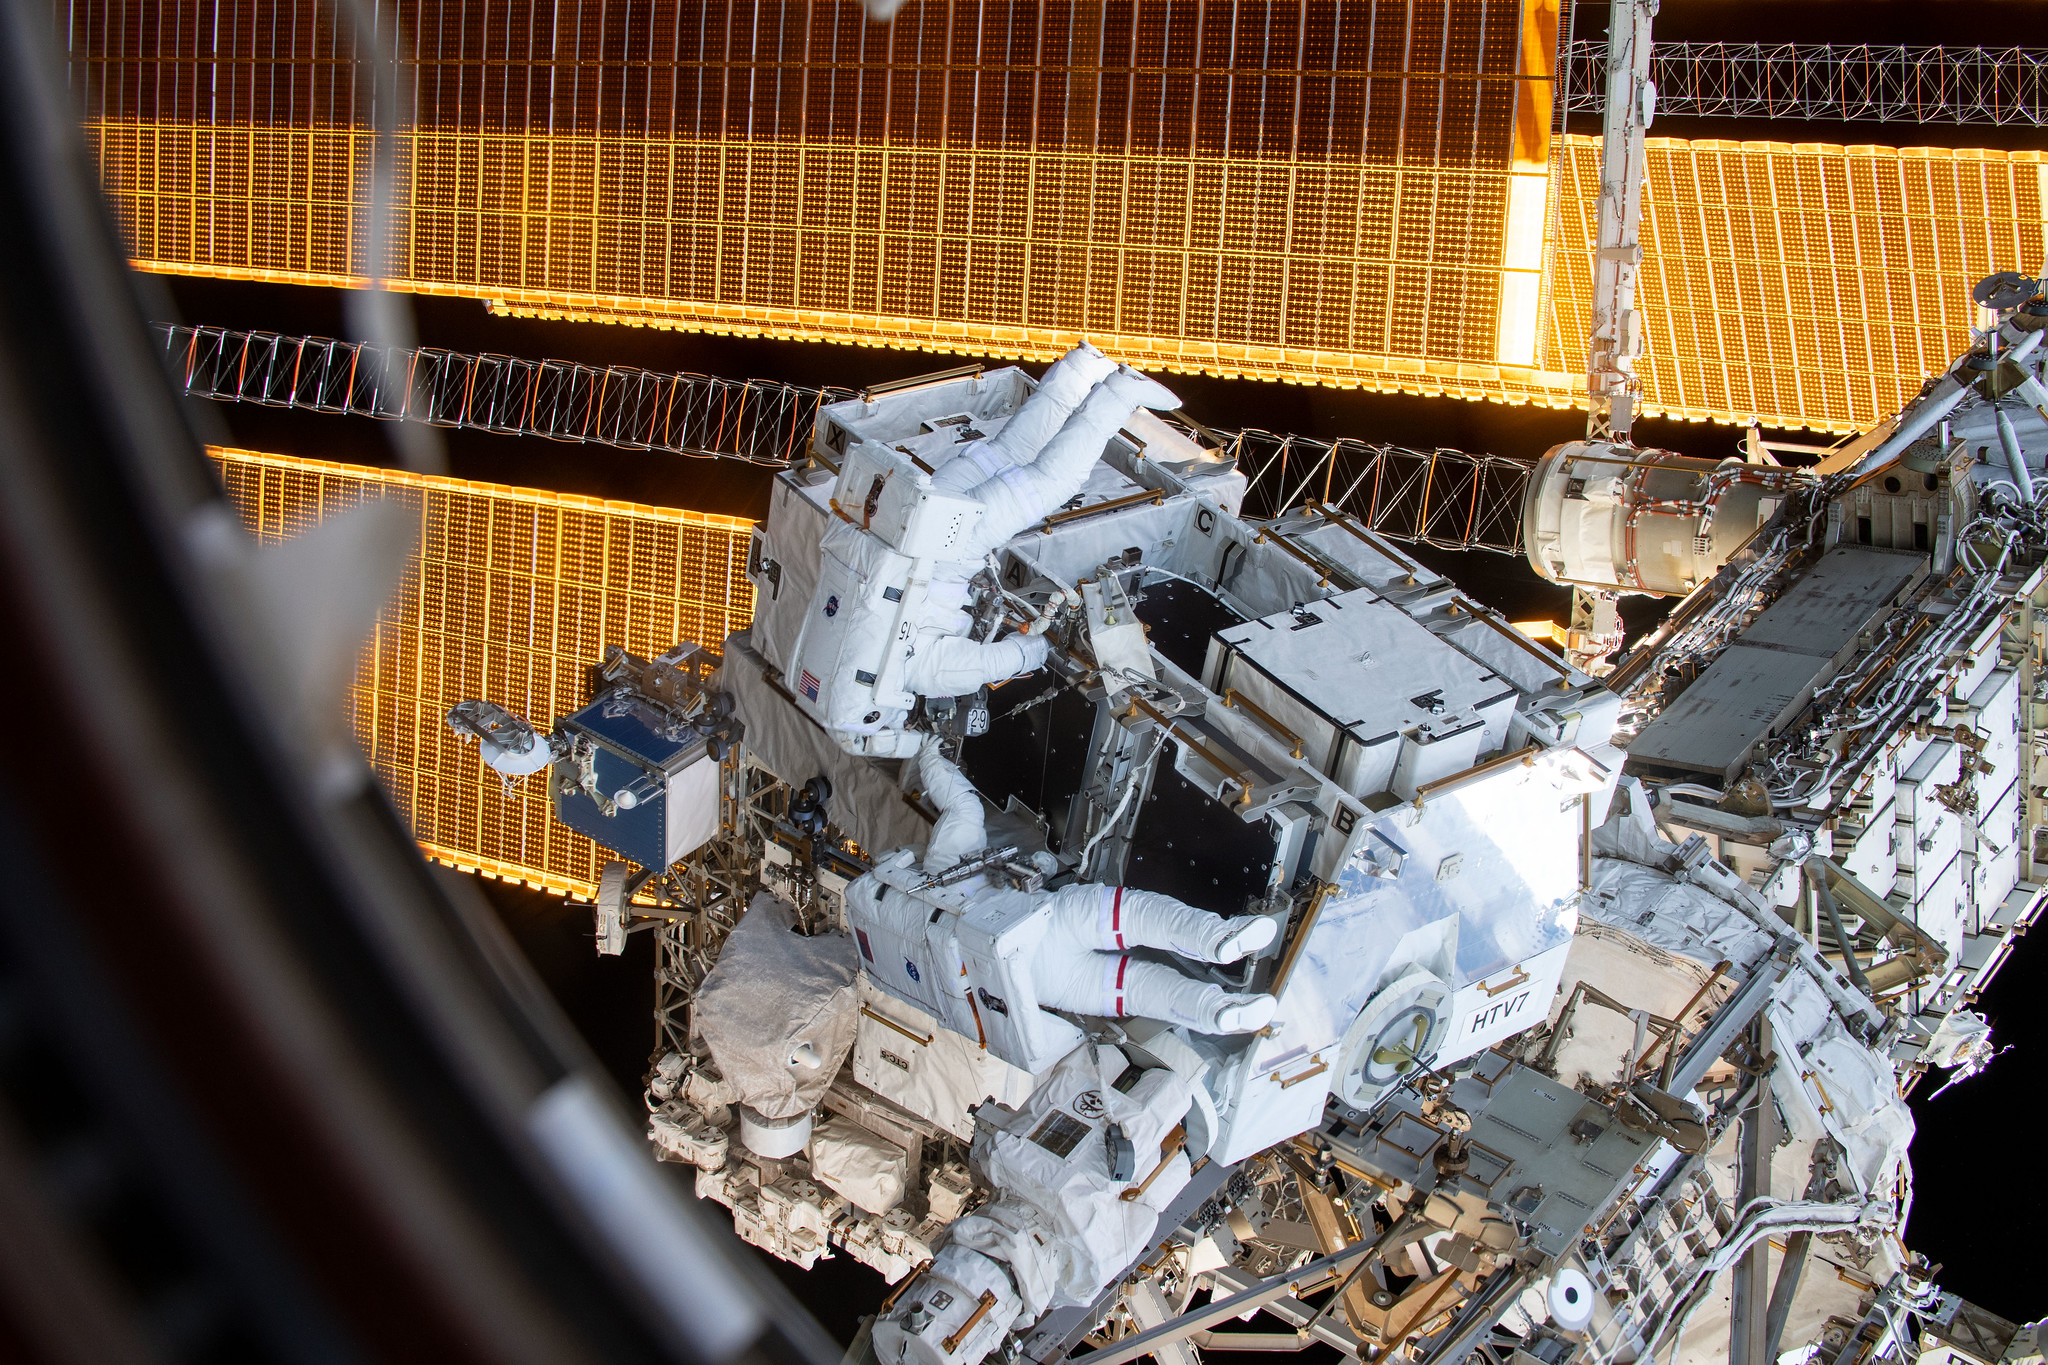
NASA astronauts work to retrieve batteries and adapter plates from an external pallet during a spacewalk to upgrade the International Space Station’s power storage capacity. Credit: NASA Two NASA astronauts