Another holiday and another sales event are upon us as Amazon Memorial Day deals are officially landing. Big retailers are dropping prices and Amazon is one of the frontrunners when

Another holiday and another sales event are upon us as Amazon Memorial Day deals are officially landing. Big retailers are dropping prices and Amazon is one of the frontrunners when
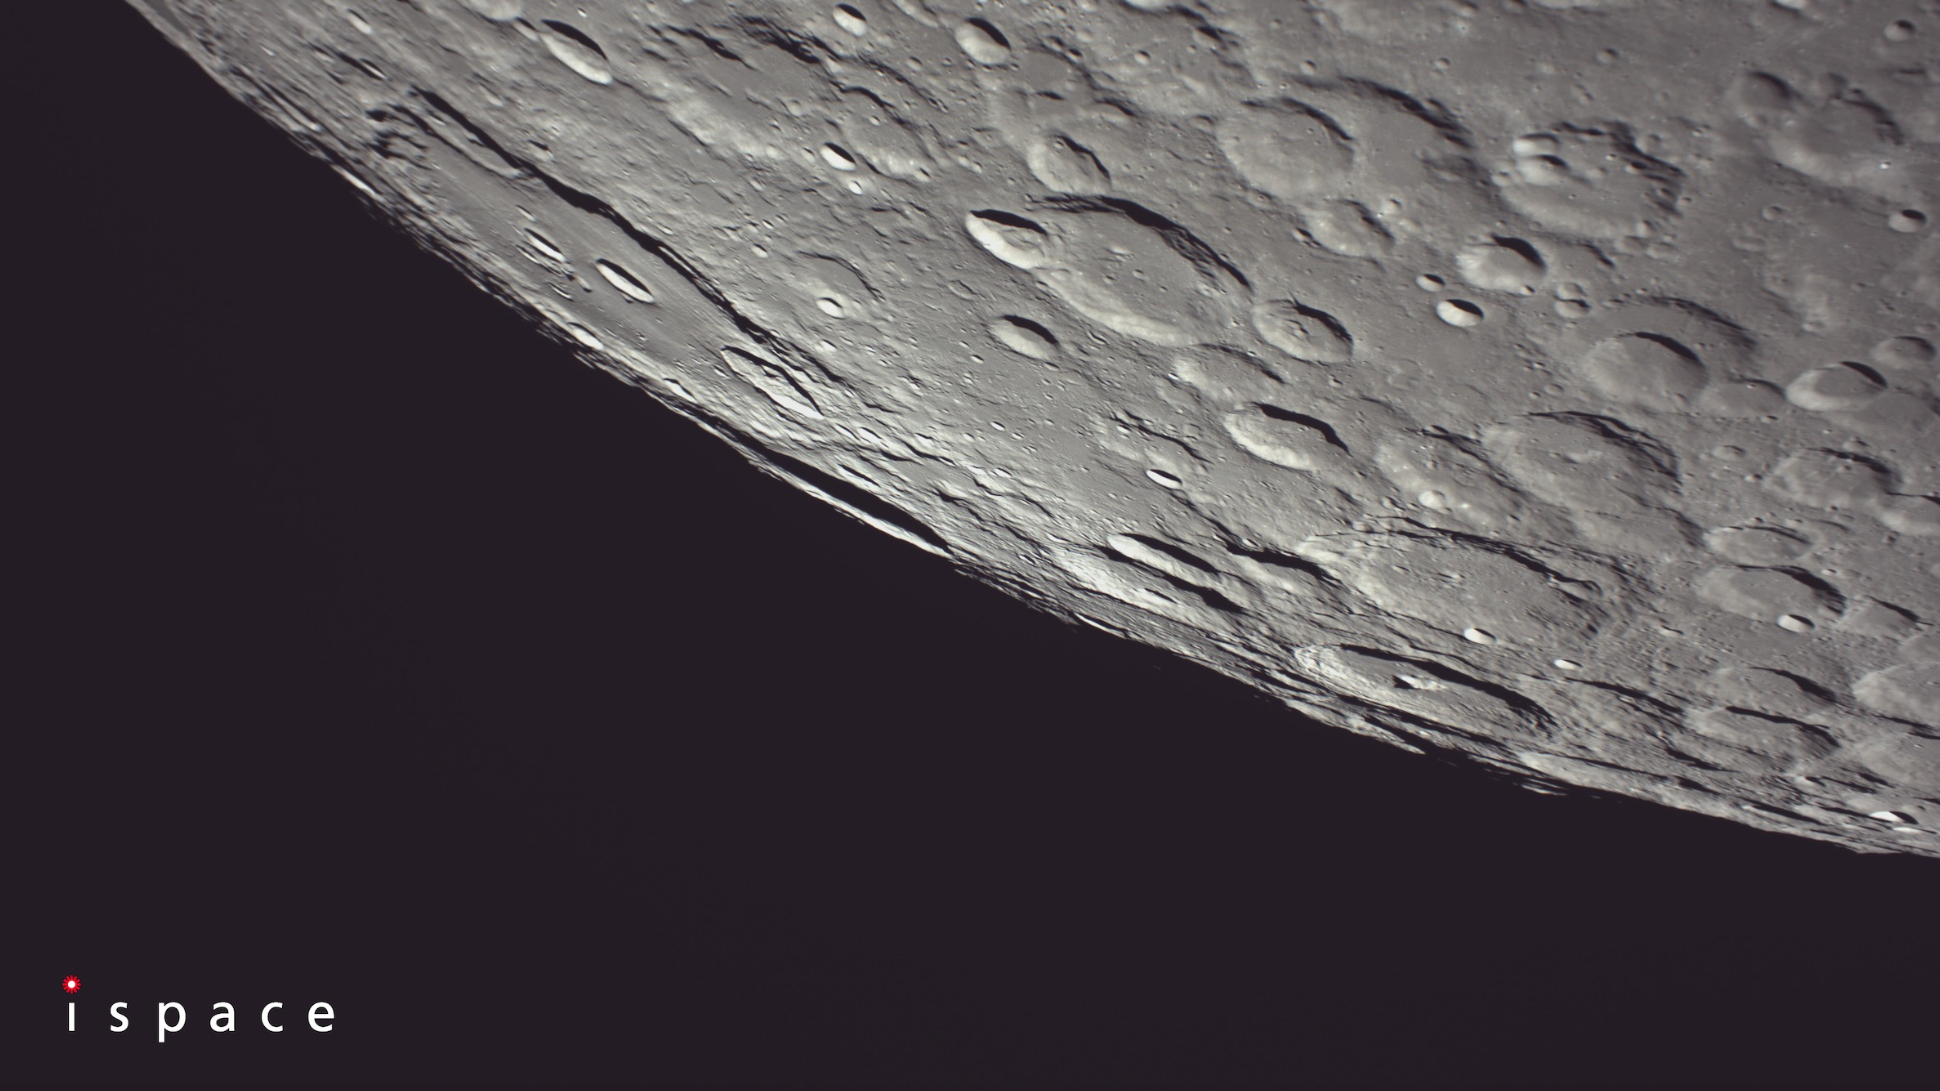
Japan’s private Resilience lunar lander has given us a nice shot of the moon just two weeks before its historic touchdown attempt. On Thursday morning (May 22), the Tokyo-based company
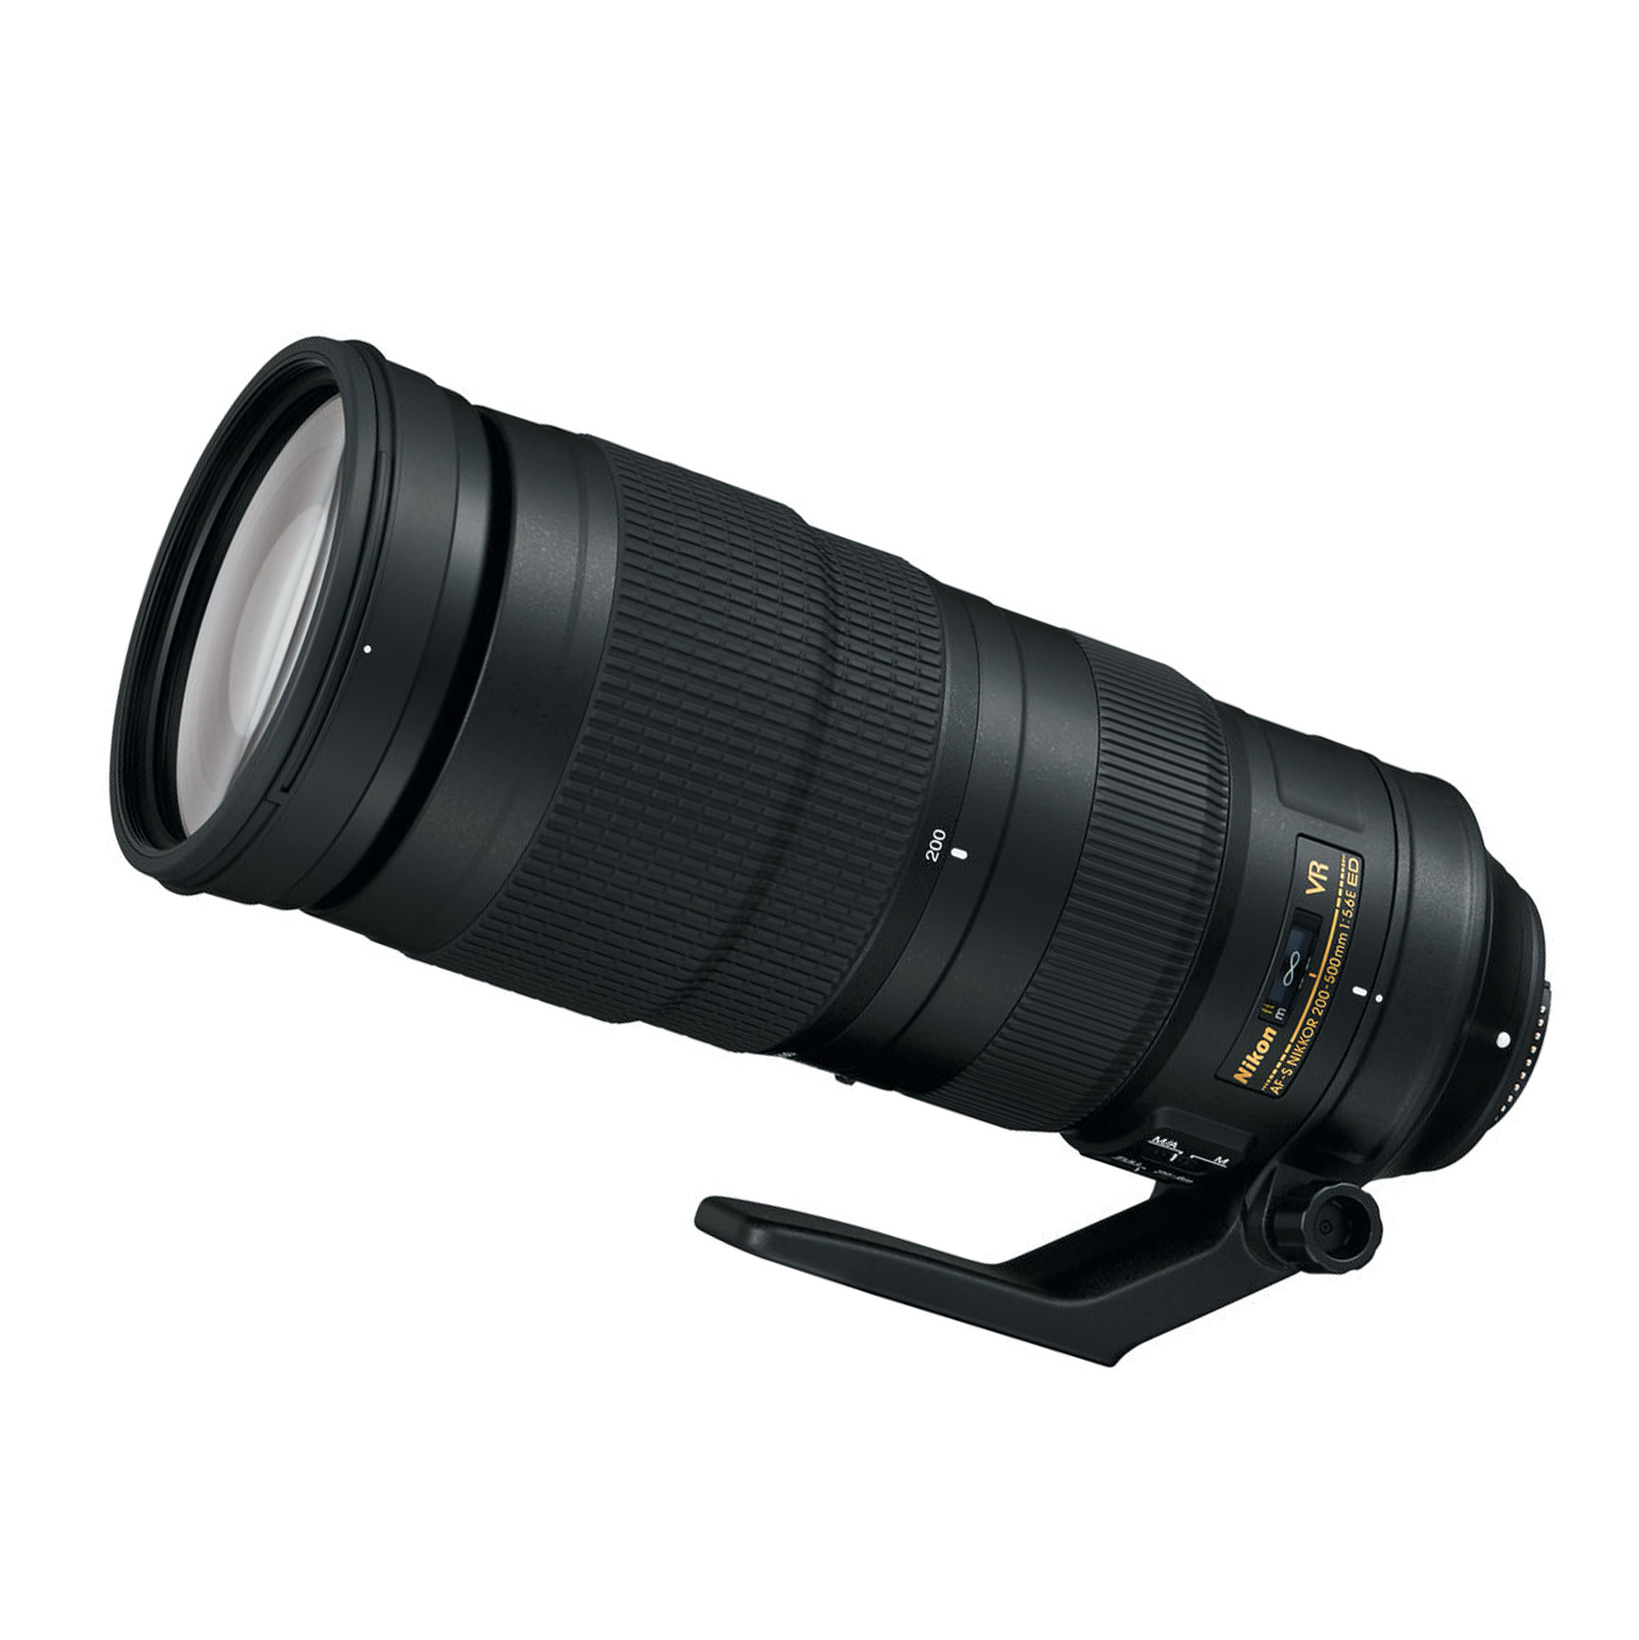
When you own one of the best cameras for photos and videos, you’ll naturally want to pair it up with one of the best lenses for astrophotography or one of
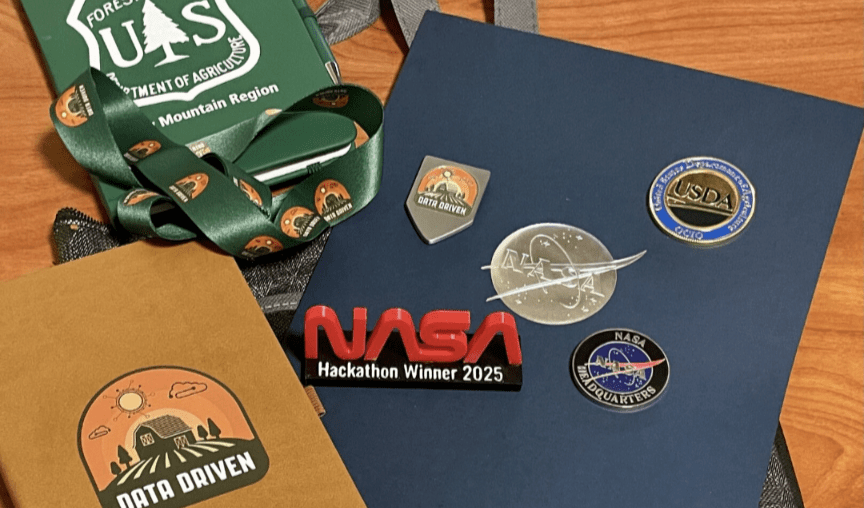
In collaboration with the United States Department of Agriculture, Amazon Web Services, and Colorado State University, NASA turned to students for AI-driven solutions. NASA On March 28, 80 college students
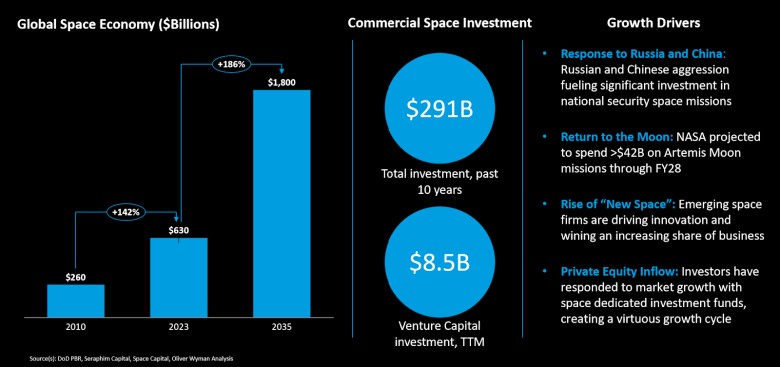
As a new era of space exploration and development unfolds — one with far more private-sector investment and leadership — the potential for rapid growth is promising. National security, deep
The most powerful explosions in the known universe come from what are known as gamma-ray bursts — though they may not sound particularly exciting, scientists usually speak about these incredible
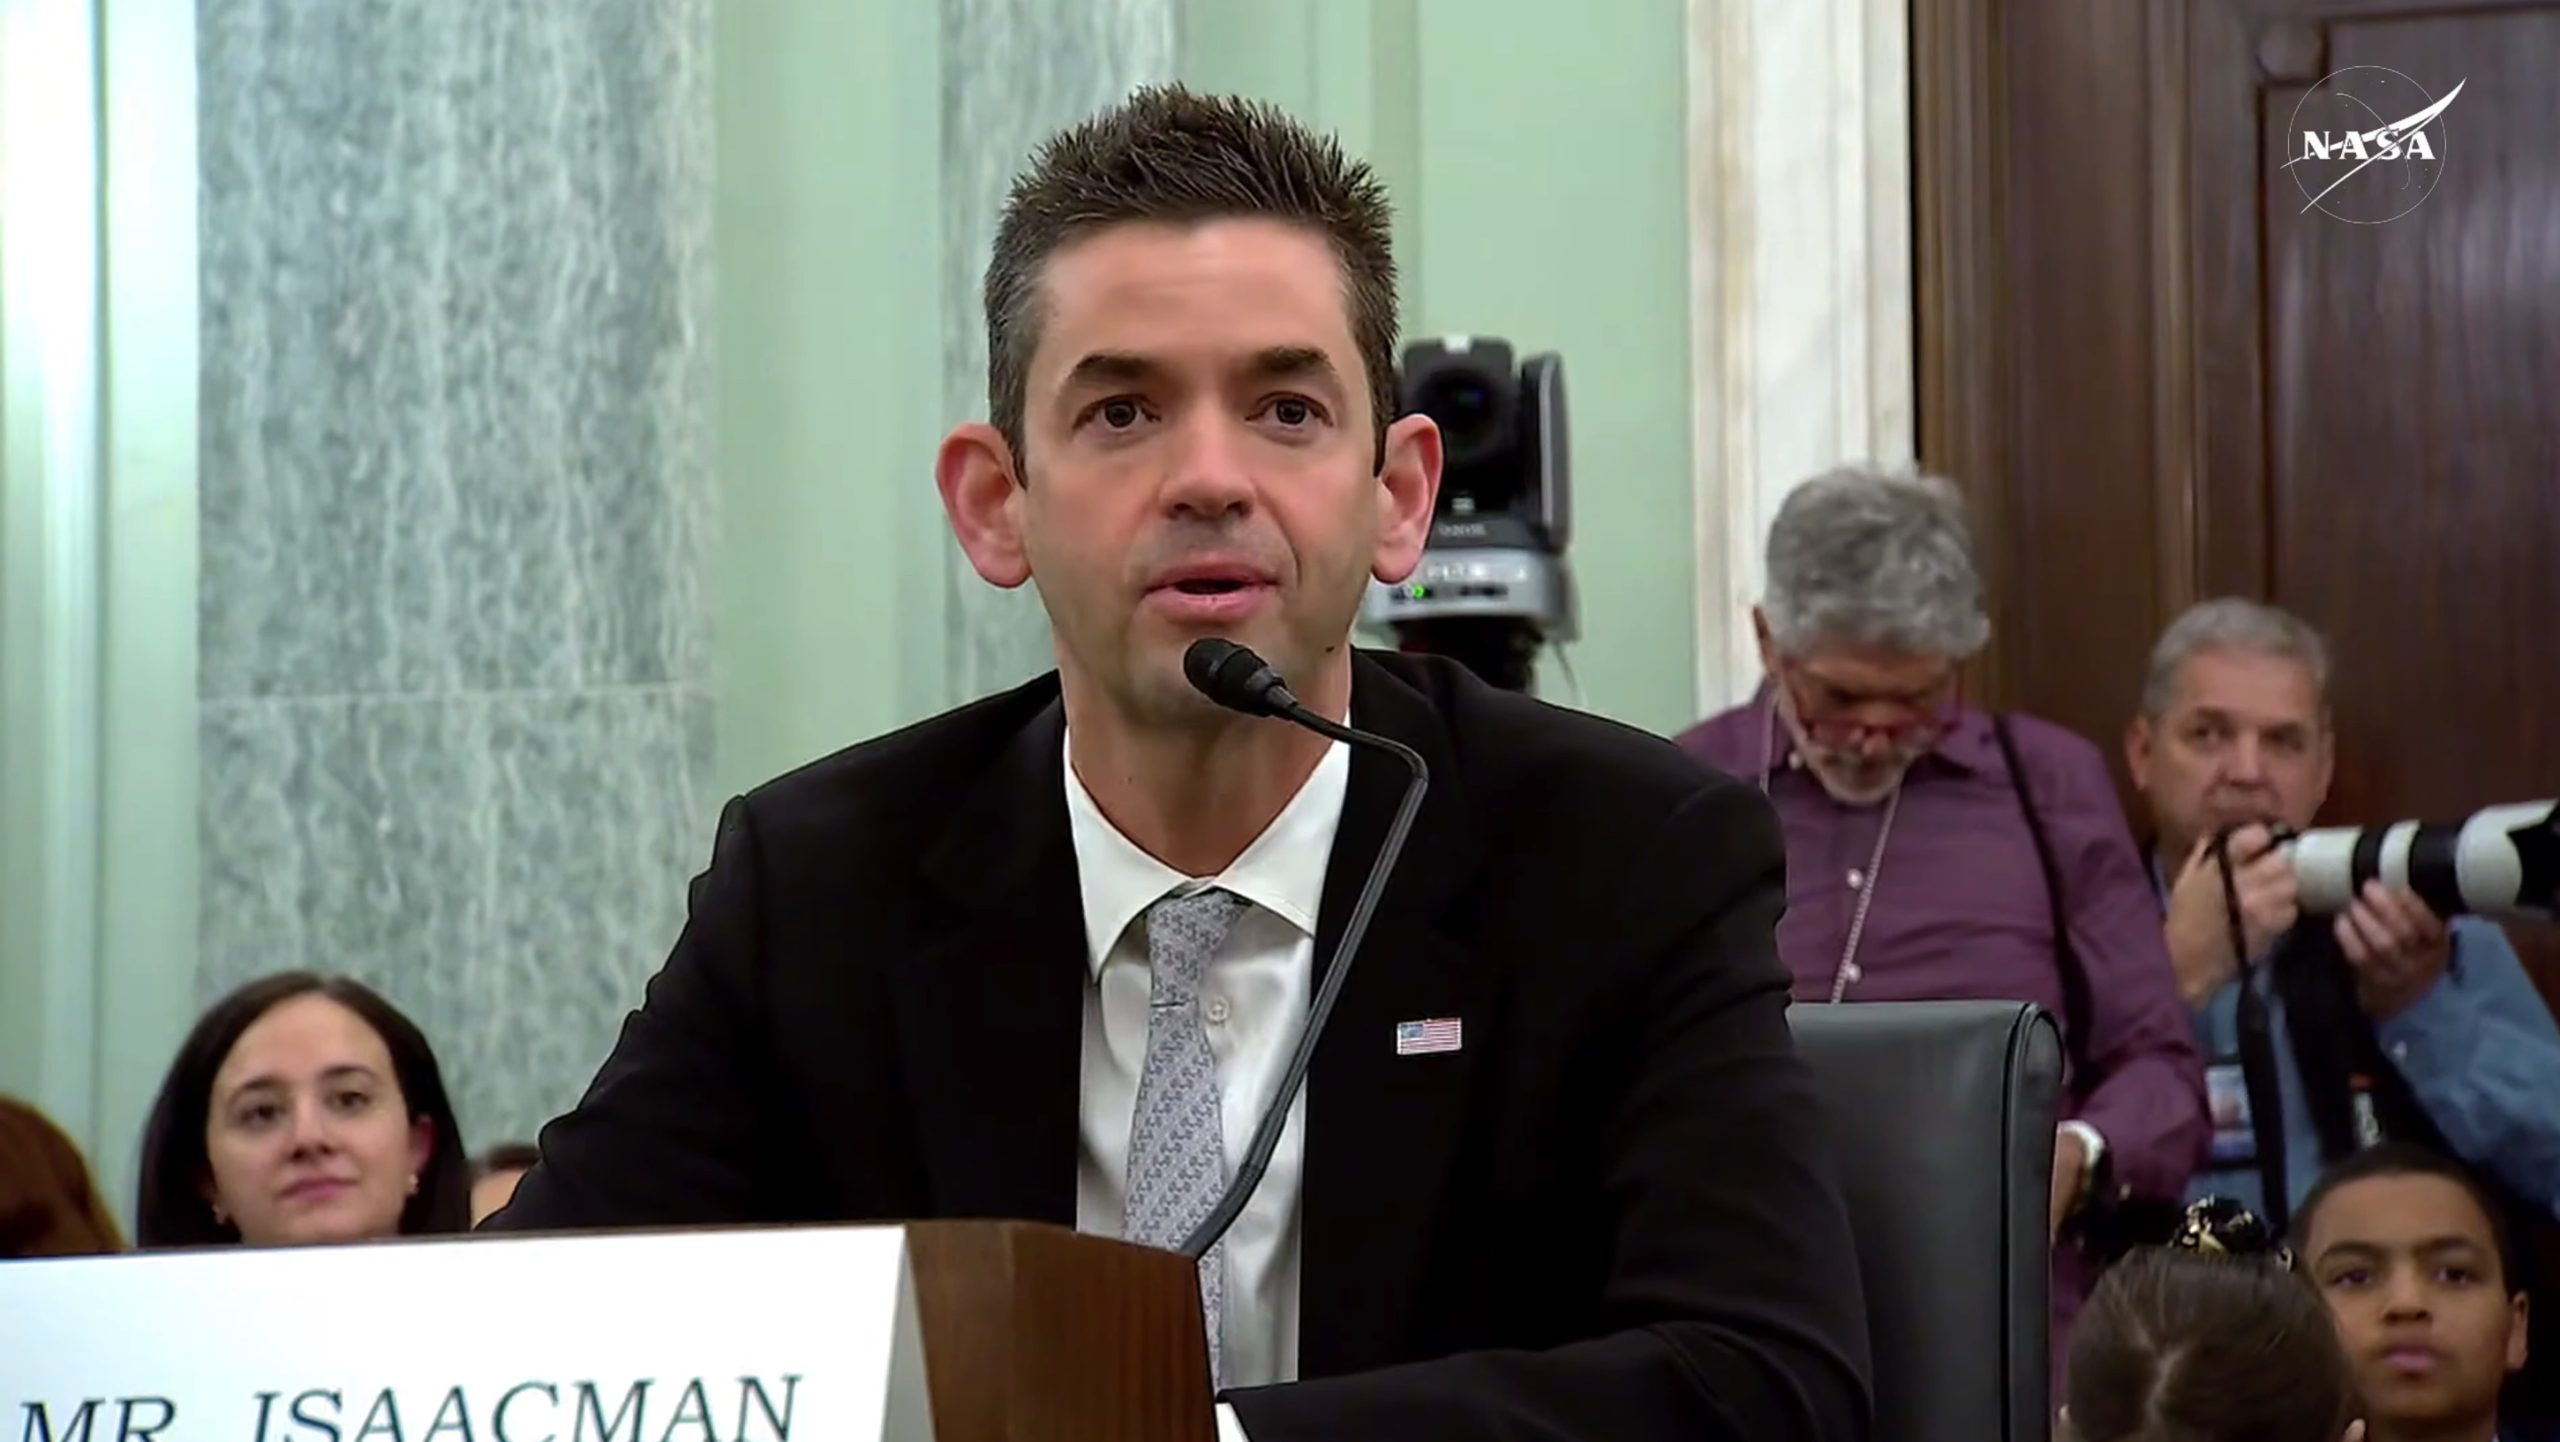
WASHINGTON — The Senate is set to vote on confirming Jared Isaacman’s nomination to be NASA administrator in early June. Senate Majority Leader John Thune (R-S.D.) filed cloture on Isaacman’s
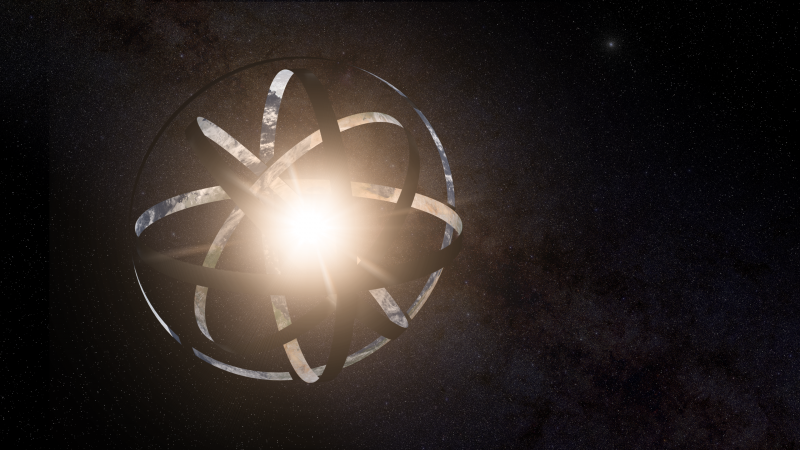
Artist’s concept of a Dyson sphere. Dyson spheres are structures that would form rings or hollow spheres around stars and harness their energy. However, they would be unstable around a
Explore Hubble Hubble Home Overview About Hubble The History of Hubble Hubble Timeline Why Have a Telescope in Space? Hubble by the Numbers At the Museum FAQs Impact & Benefits
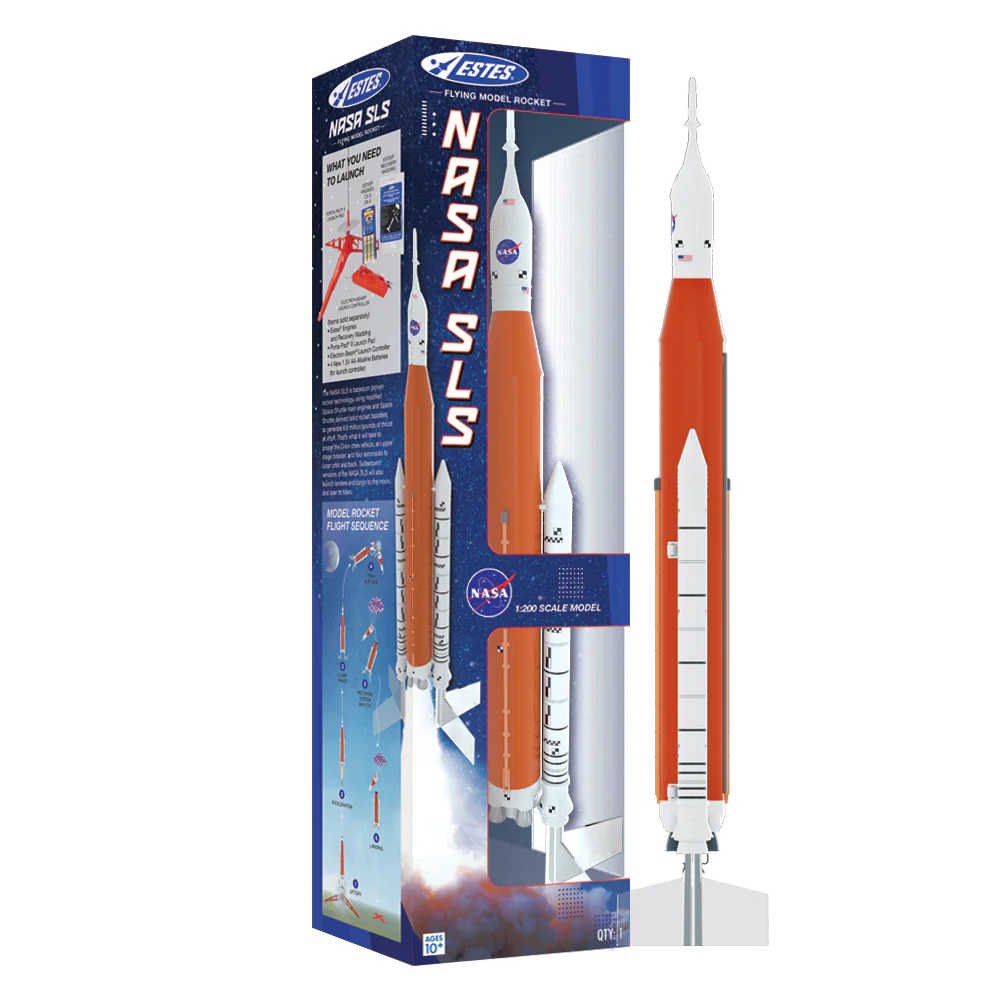
We can’t all get down to Cape Canaveral, so we’ve rounded up the best model rockets on the market, suitable for all ages and budgets. The best model rockets are