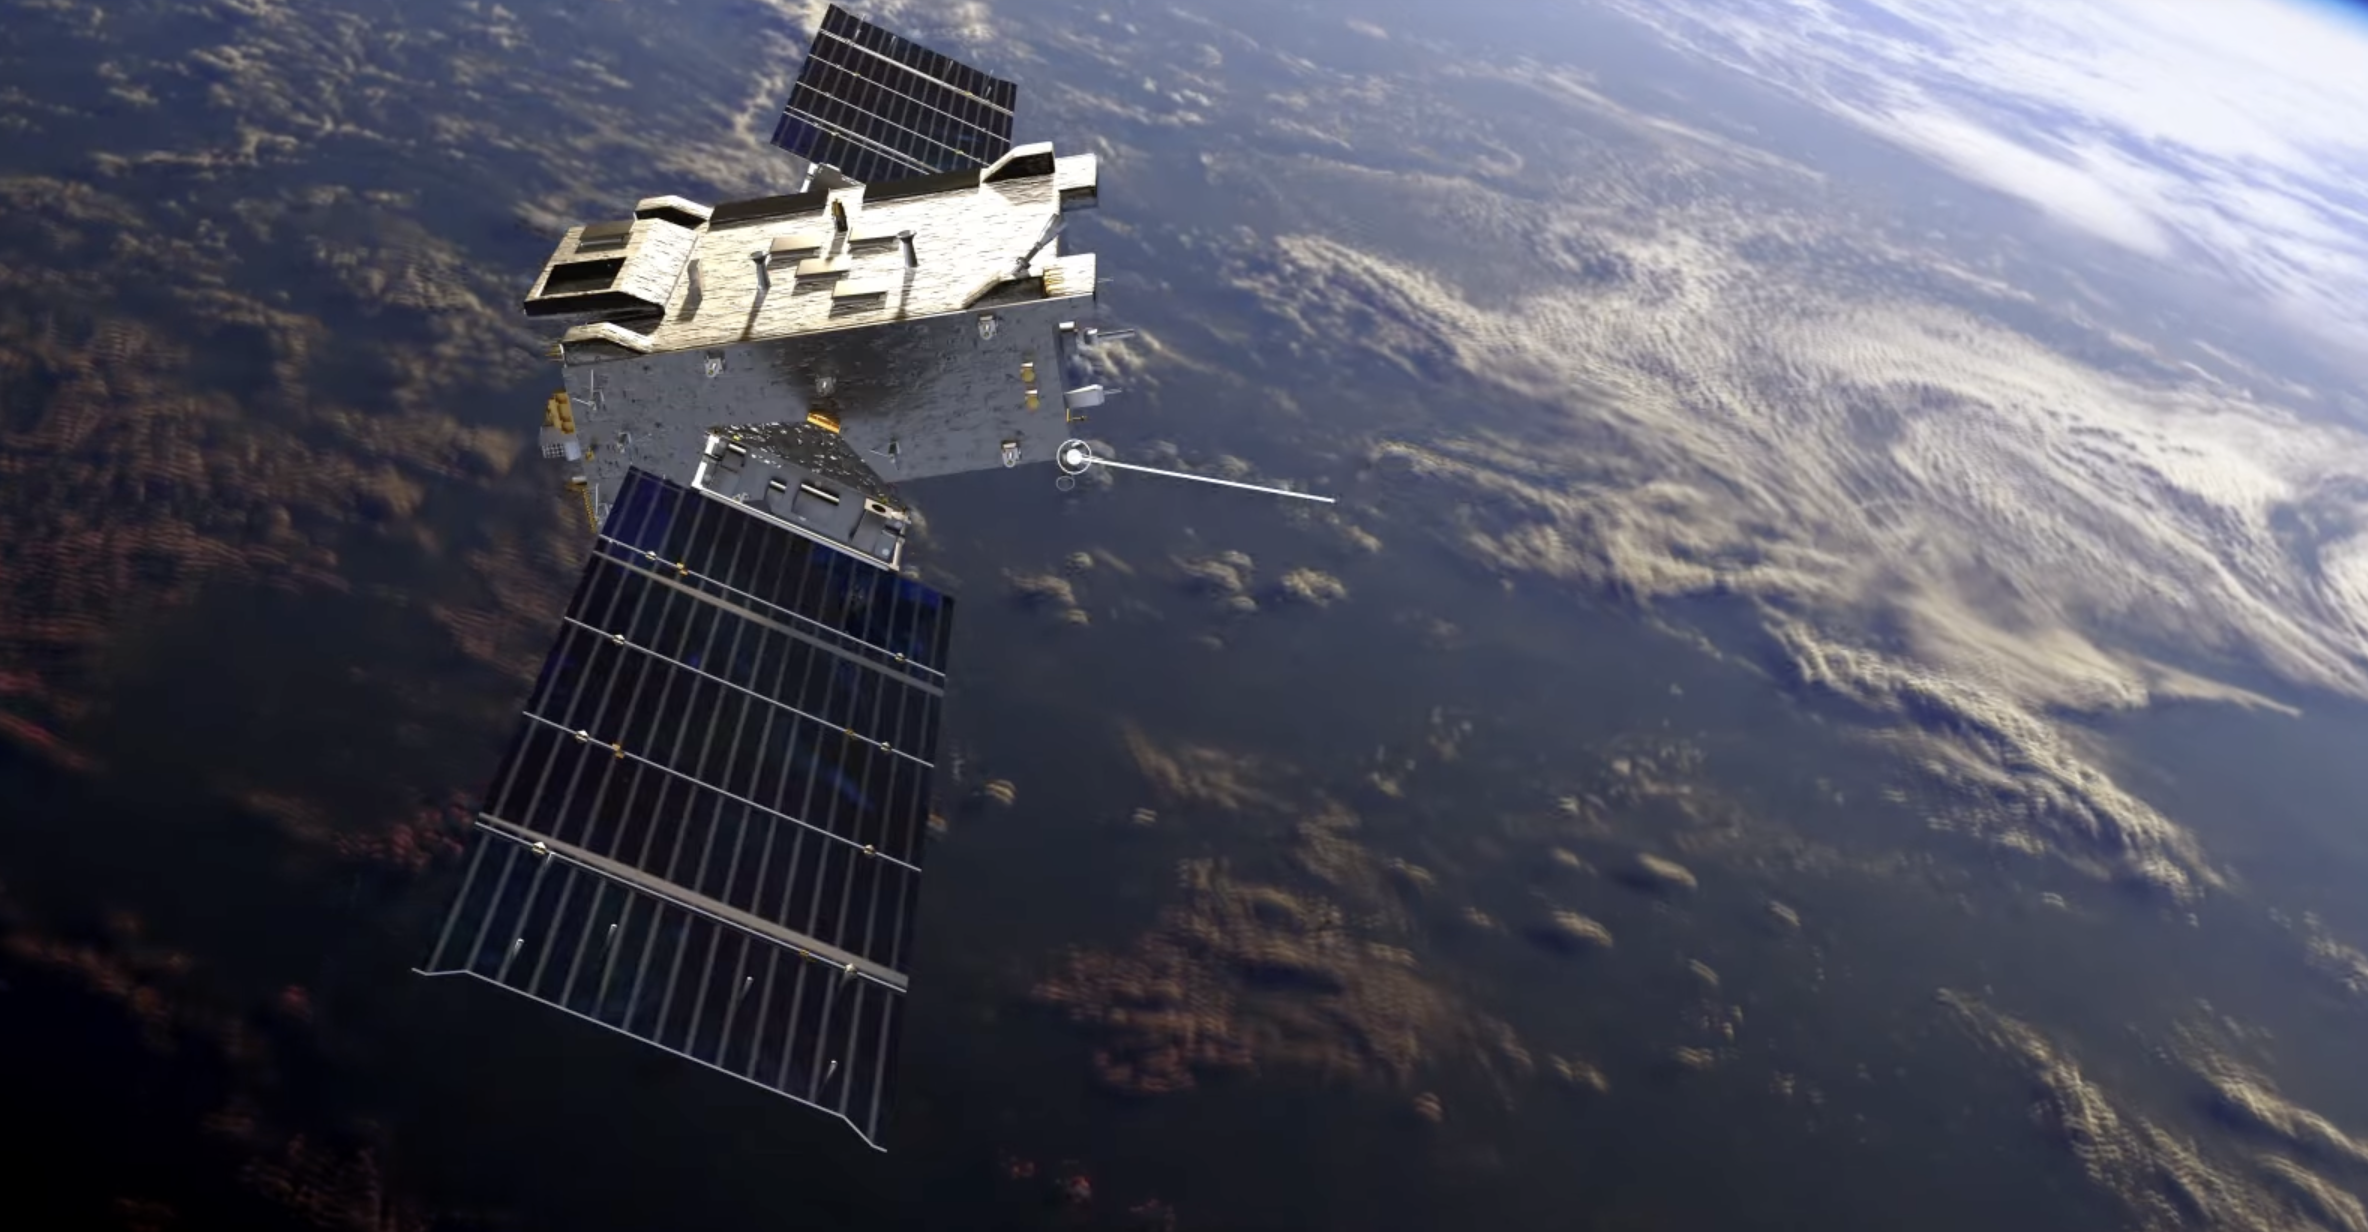
WASHINGTON — The Space Development Agency is preparing for a high-stakes series of satellite deployments that could define the future of its national security space architecture. The upcoming launches, set

WASHINGTON — The Space Development Agency is preparing for a high-stakes series of satellite deployments that could define the future of its national security space architecture. The upcoming launches, set
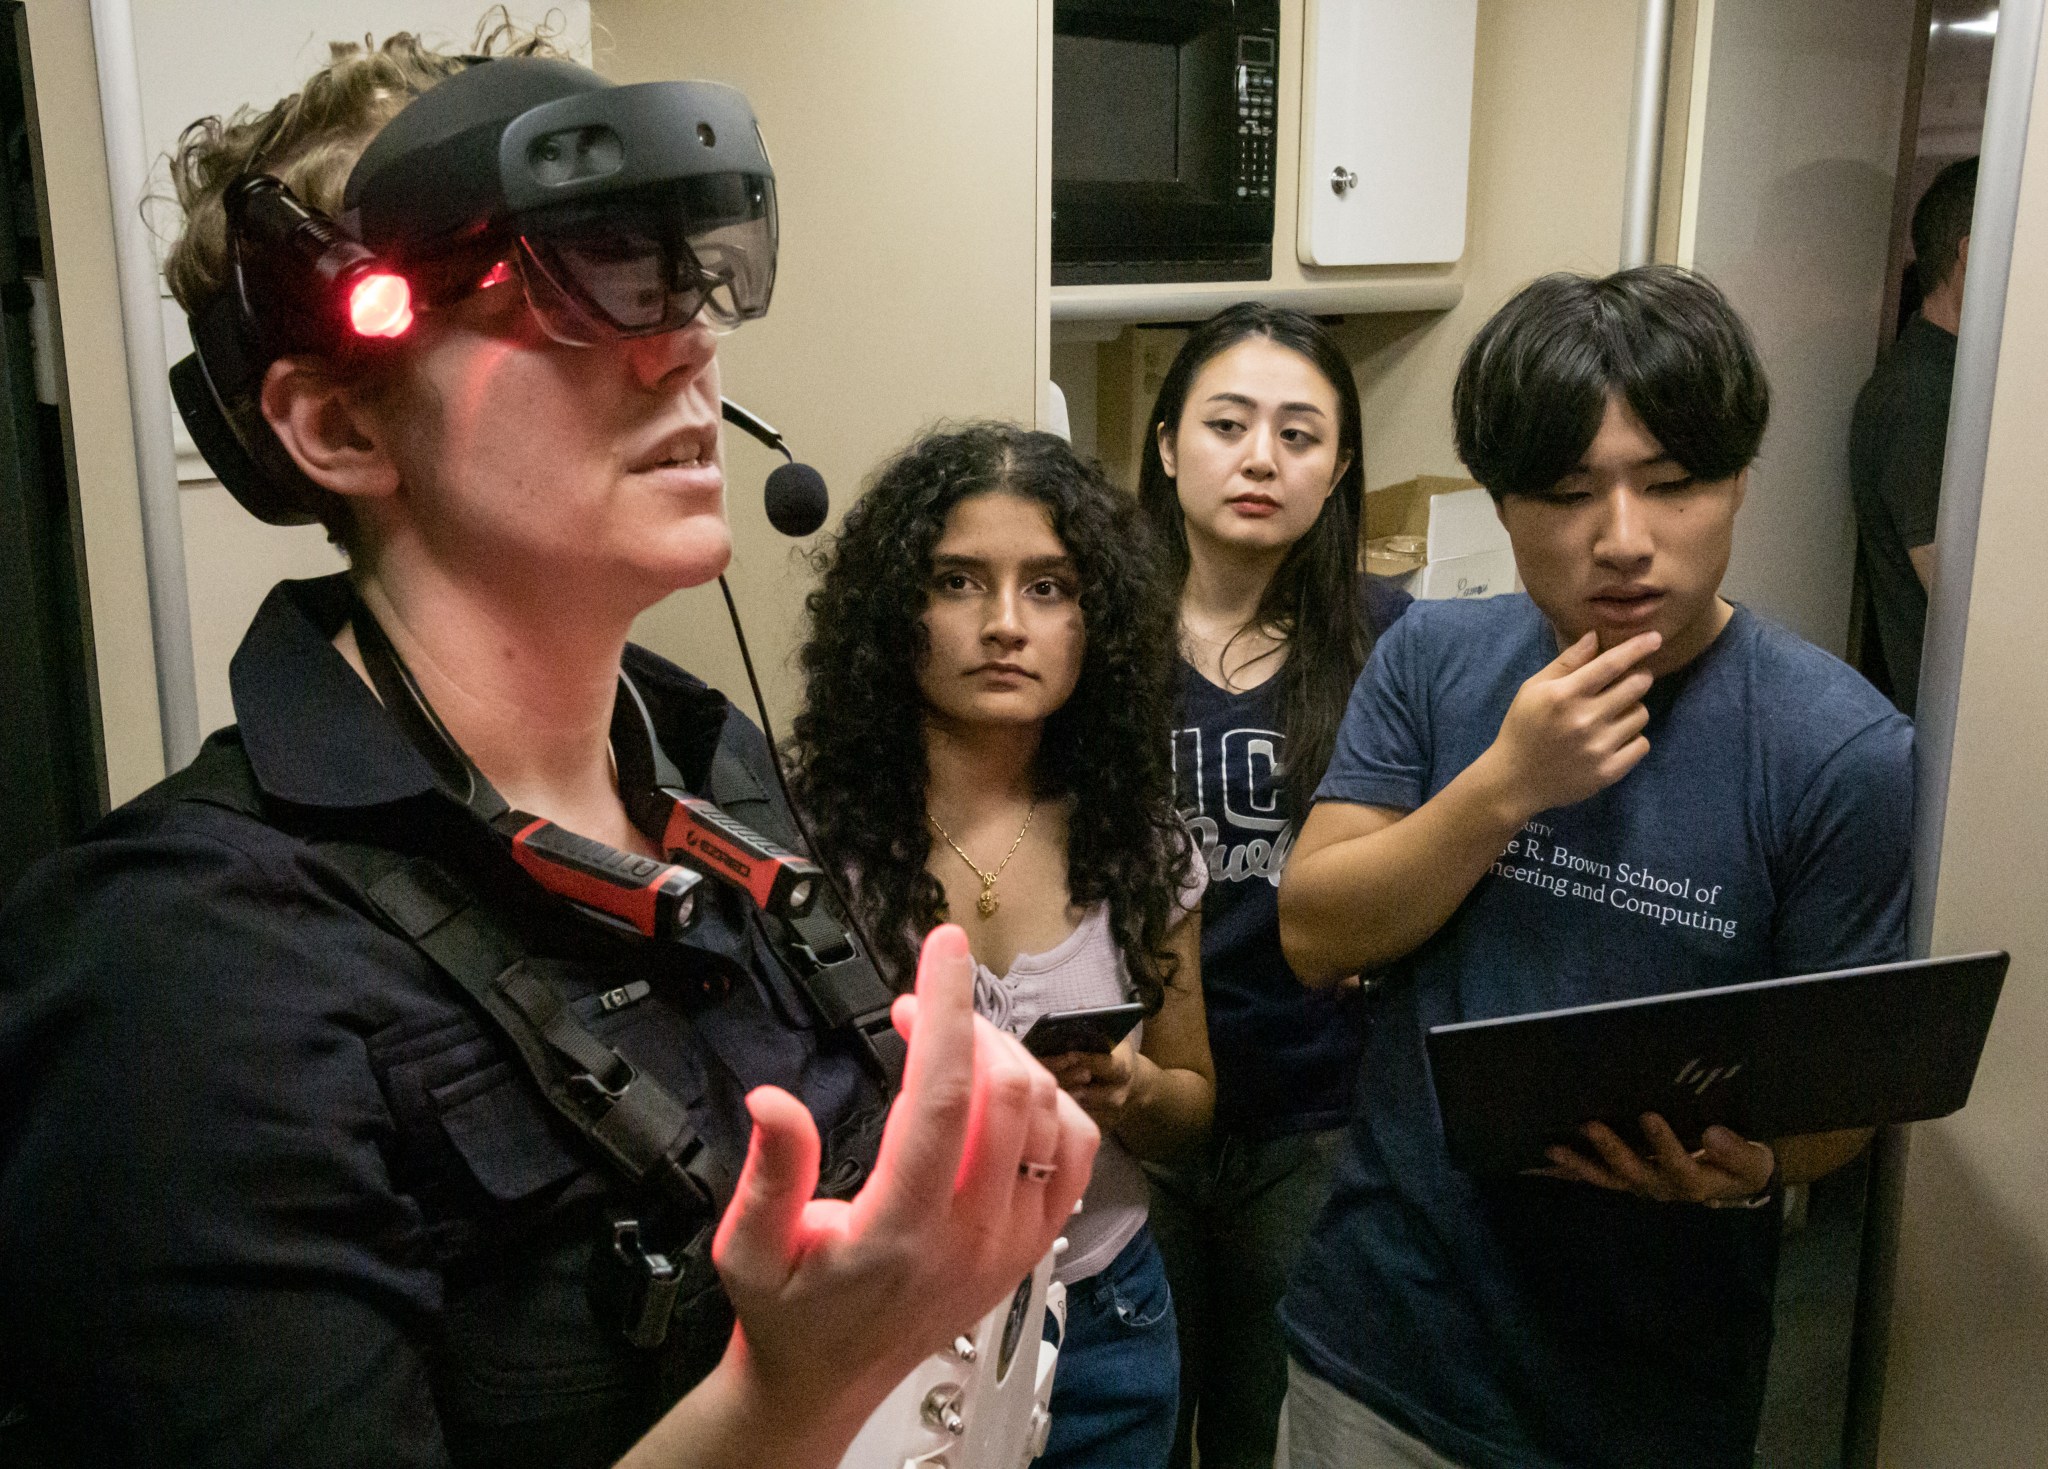
After months of work in the NASA Spacesuit User Interface Technologies for Students (SUITS) challenge, more than 100 students from 12 universities across the United States traveled to NASA’s Johnson
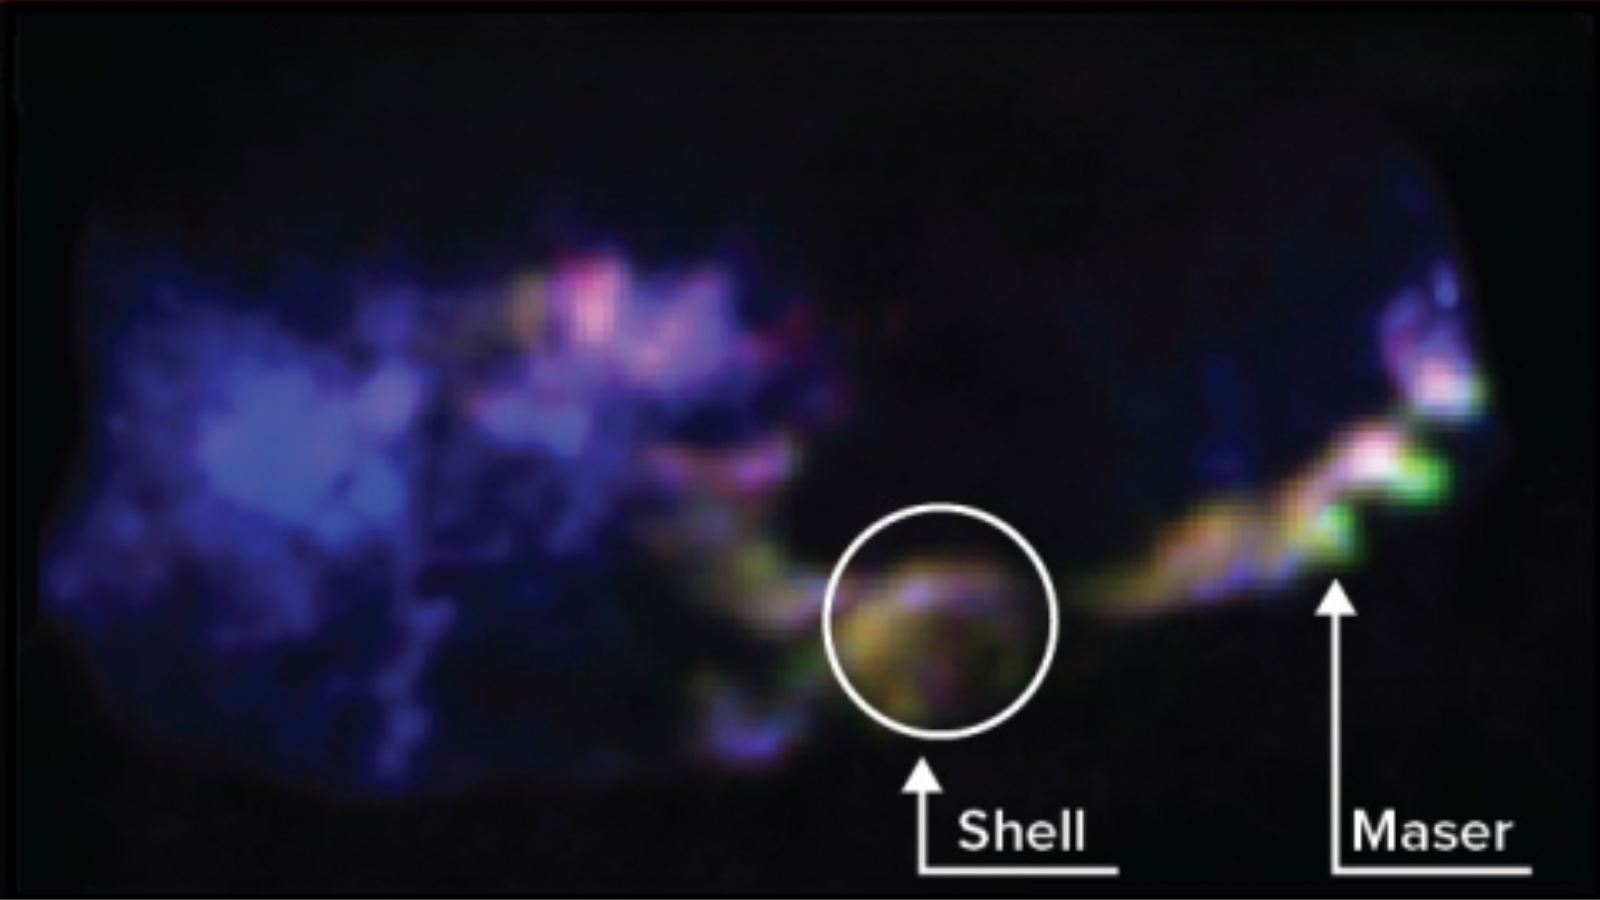
Astronomers have discovered a vast cloud of gas and dust stretching out for a staggering 200 light-years and lurking in a poorly explored region of the Milky Way. The structure,
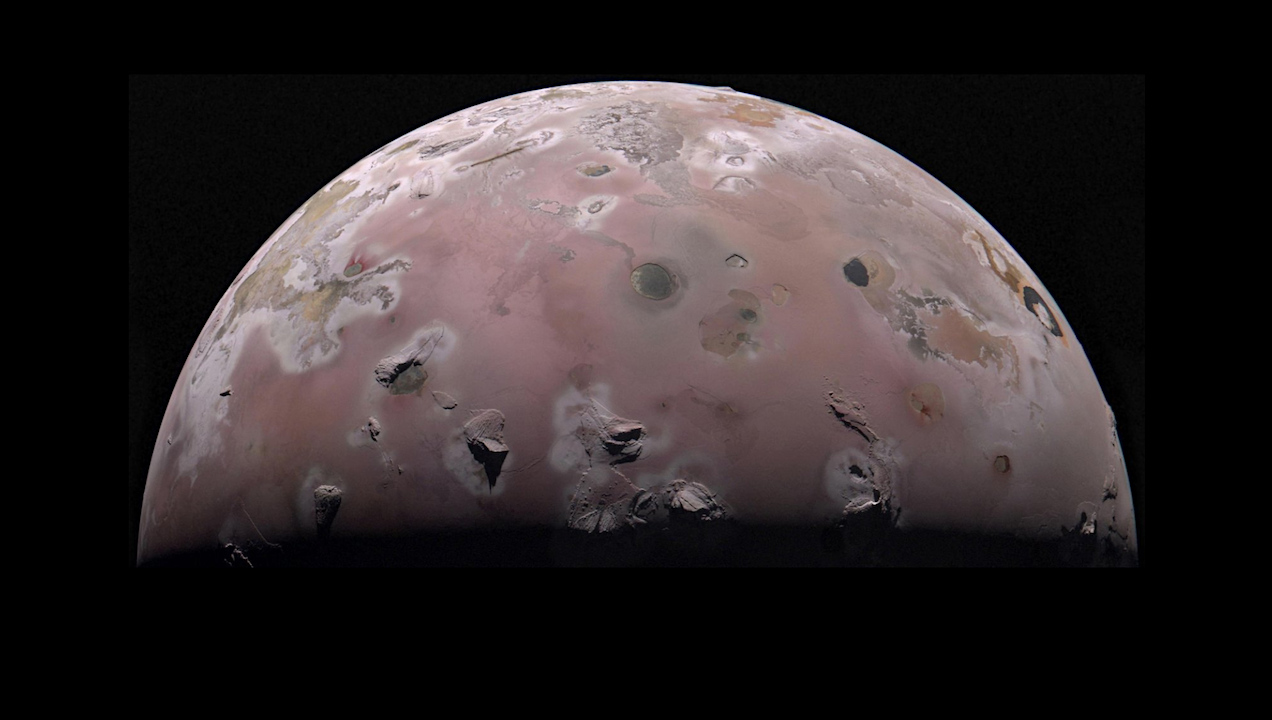
The north polar region of Jupiter’s volcanic moon Io was captured by the JunoCam imager aboard NASA’s Juno during the spacecraft’s 57th close pass of the gas giant on Dec.

Discover how the U.S. Department of Defense could leverage advanced data and artificial intelligence to transform space-based defense through its Golden Dome initiative. Next-generation AI-powered systems, designed to integrate vast streams of

The abstract in PubMed or at the publisher’s site is linked when available and will open in a new window. Hasenstein KH, Moinuddin SGA, Berim A, Davin LB, Lewis NG.Glucosinolate
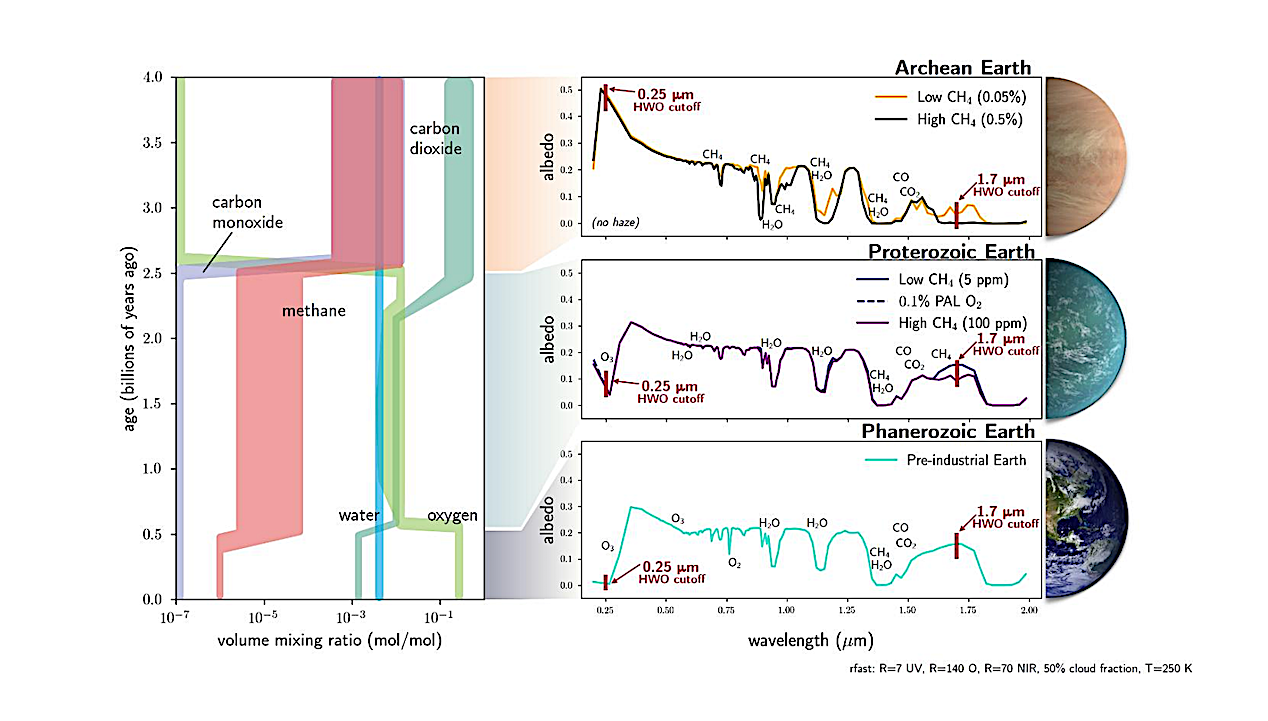
Earth biosignatures through time and their reflected light spectra. The left subplot shows estimates of Earth’s bulk atmospheric composition through time (advancing from top to bottom), and the figures on
The crescent moon will shine close to the gas giant Jupiter in the morning sky on July 23, with its shadow-veiled disk softly lit by sunlight reflected off Earth’s surface,

WASHINGTON — The U.S. Space Force plans to select multiple companies to each build several satellites as part of a proliferated network of surveillance sensors in geostationary orbit. To continue
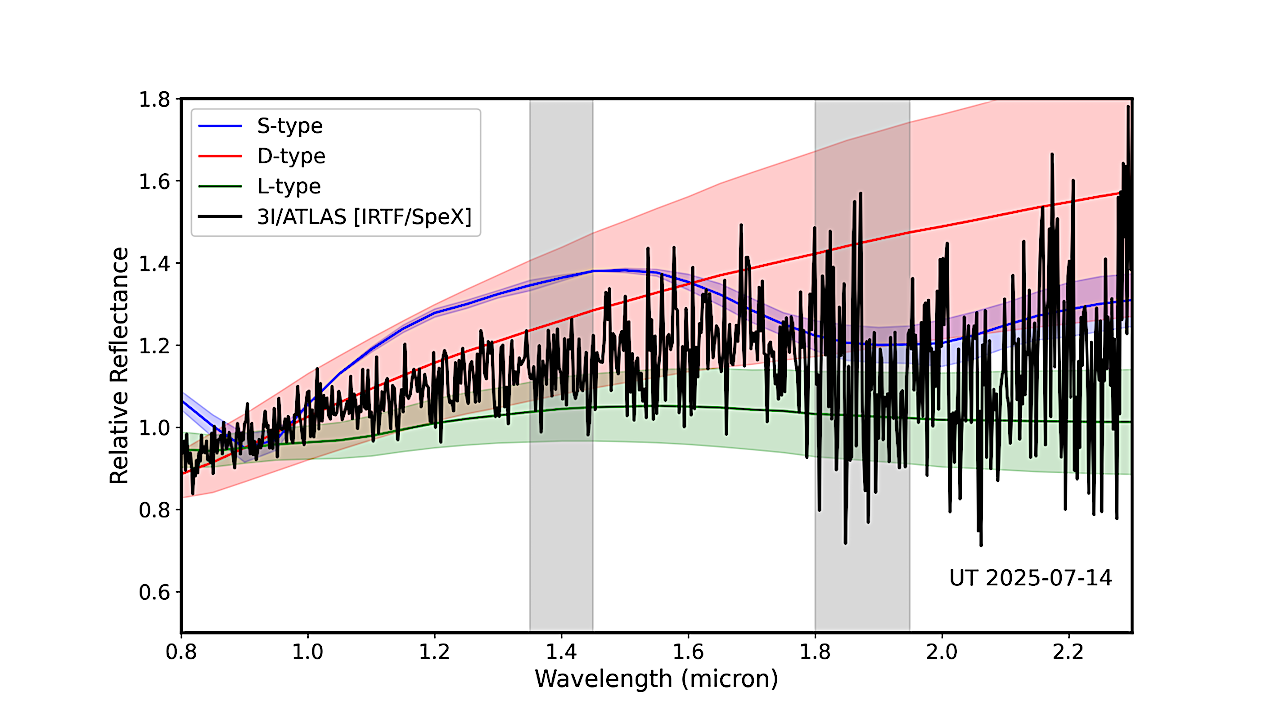
The black line shows the IRTF/SpeX spectrum of 3I/ATLAS, normalized at 1.2 µm. Colored lines and shaded regions represent the mean and ±σ ranges for S-type (blue), D-type (red), and