
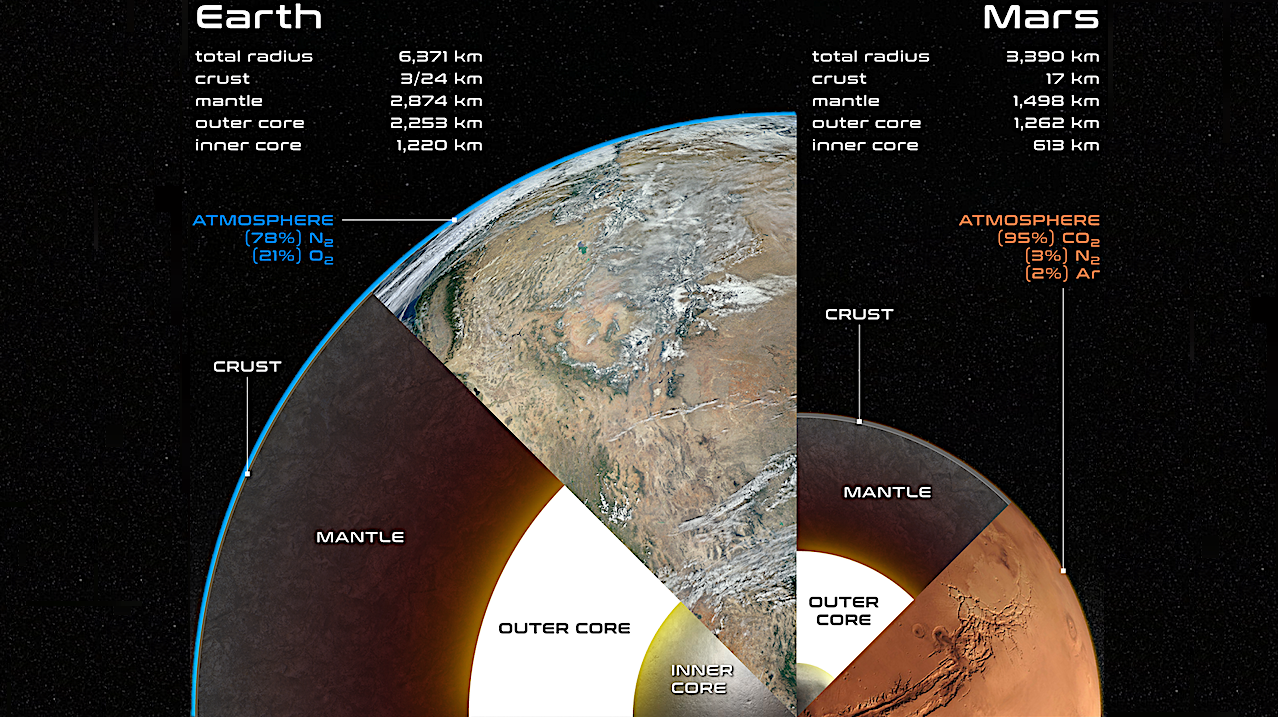
Schematic cross sections of Earth and Mars, showing the major internal components and atmospheric components, to scale. For simplicity, oceanic and continental crust for Earth are not distinguished, nor is

Schematic cross sections of Earth and Mars, showing the major internal components and atmospheric components, to scale. For simplicity, oceanic and continental crust for Earth are not distinguished, nor is
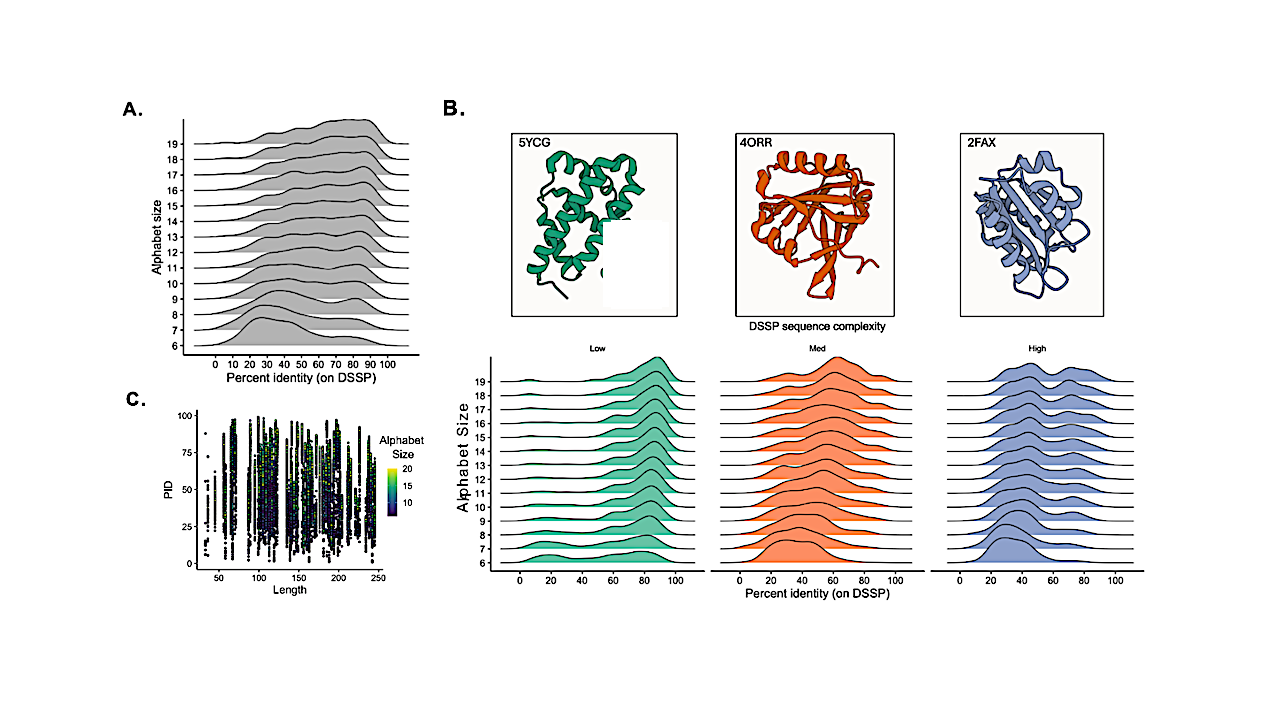
Model accuracy in terms of predicted DSSP secondary structure. A. DSSP sequence percent identity of predicted sequences to target, input, secondary structure. B. Example target structures of low (green) medium
Limits of Terrestrial Life and the Probability of Growth on Mars Committee on Planetary Protection (CoPP) (Virtual Meeting June 1-2, 2026)June 1 – 2, 2026 This meeting is to provide
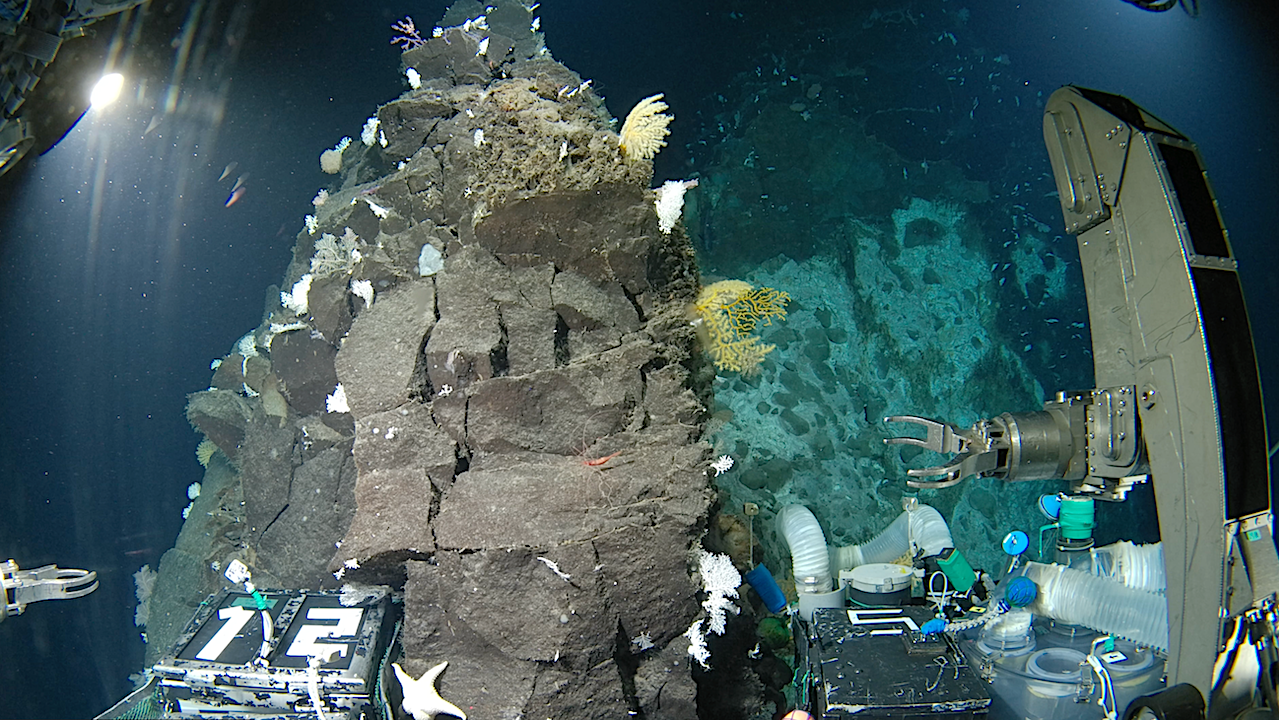
Shinkai 6500 crewed submersible on the Schichiyo seamounts – The Nippon Foundation Scientists have discovered 1,121 marine species in a single year, marking a significant step forward in efforts to
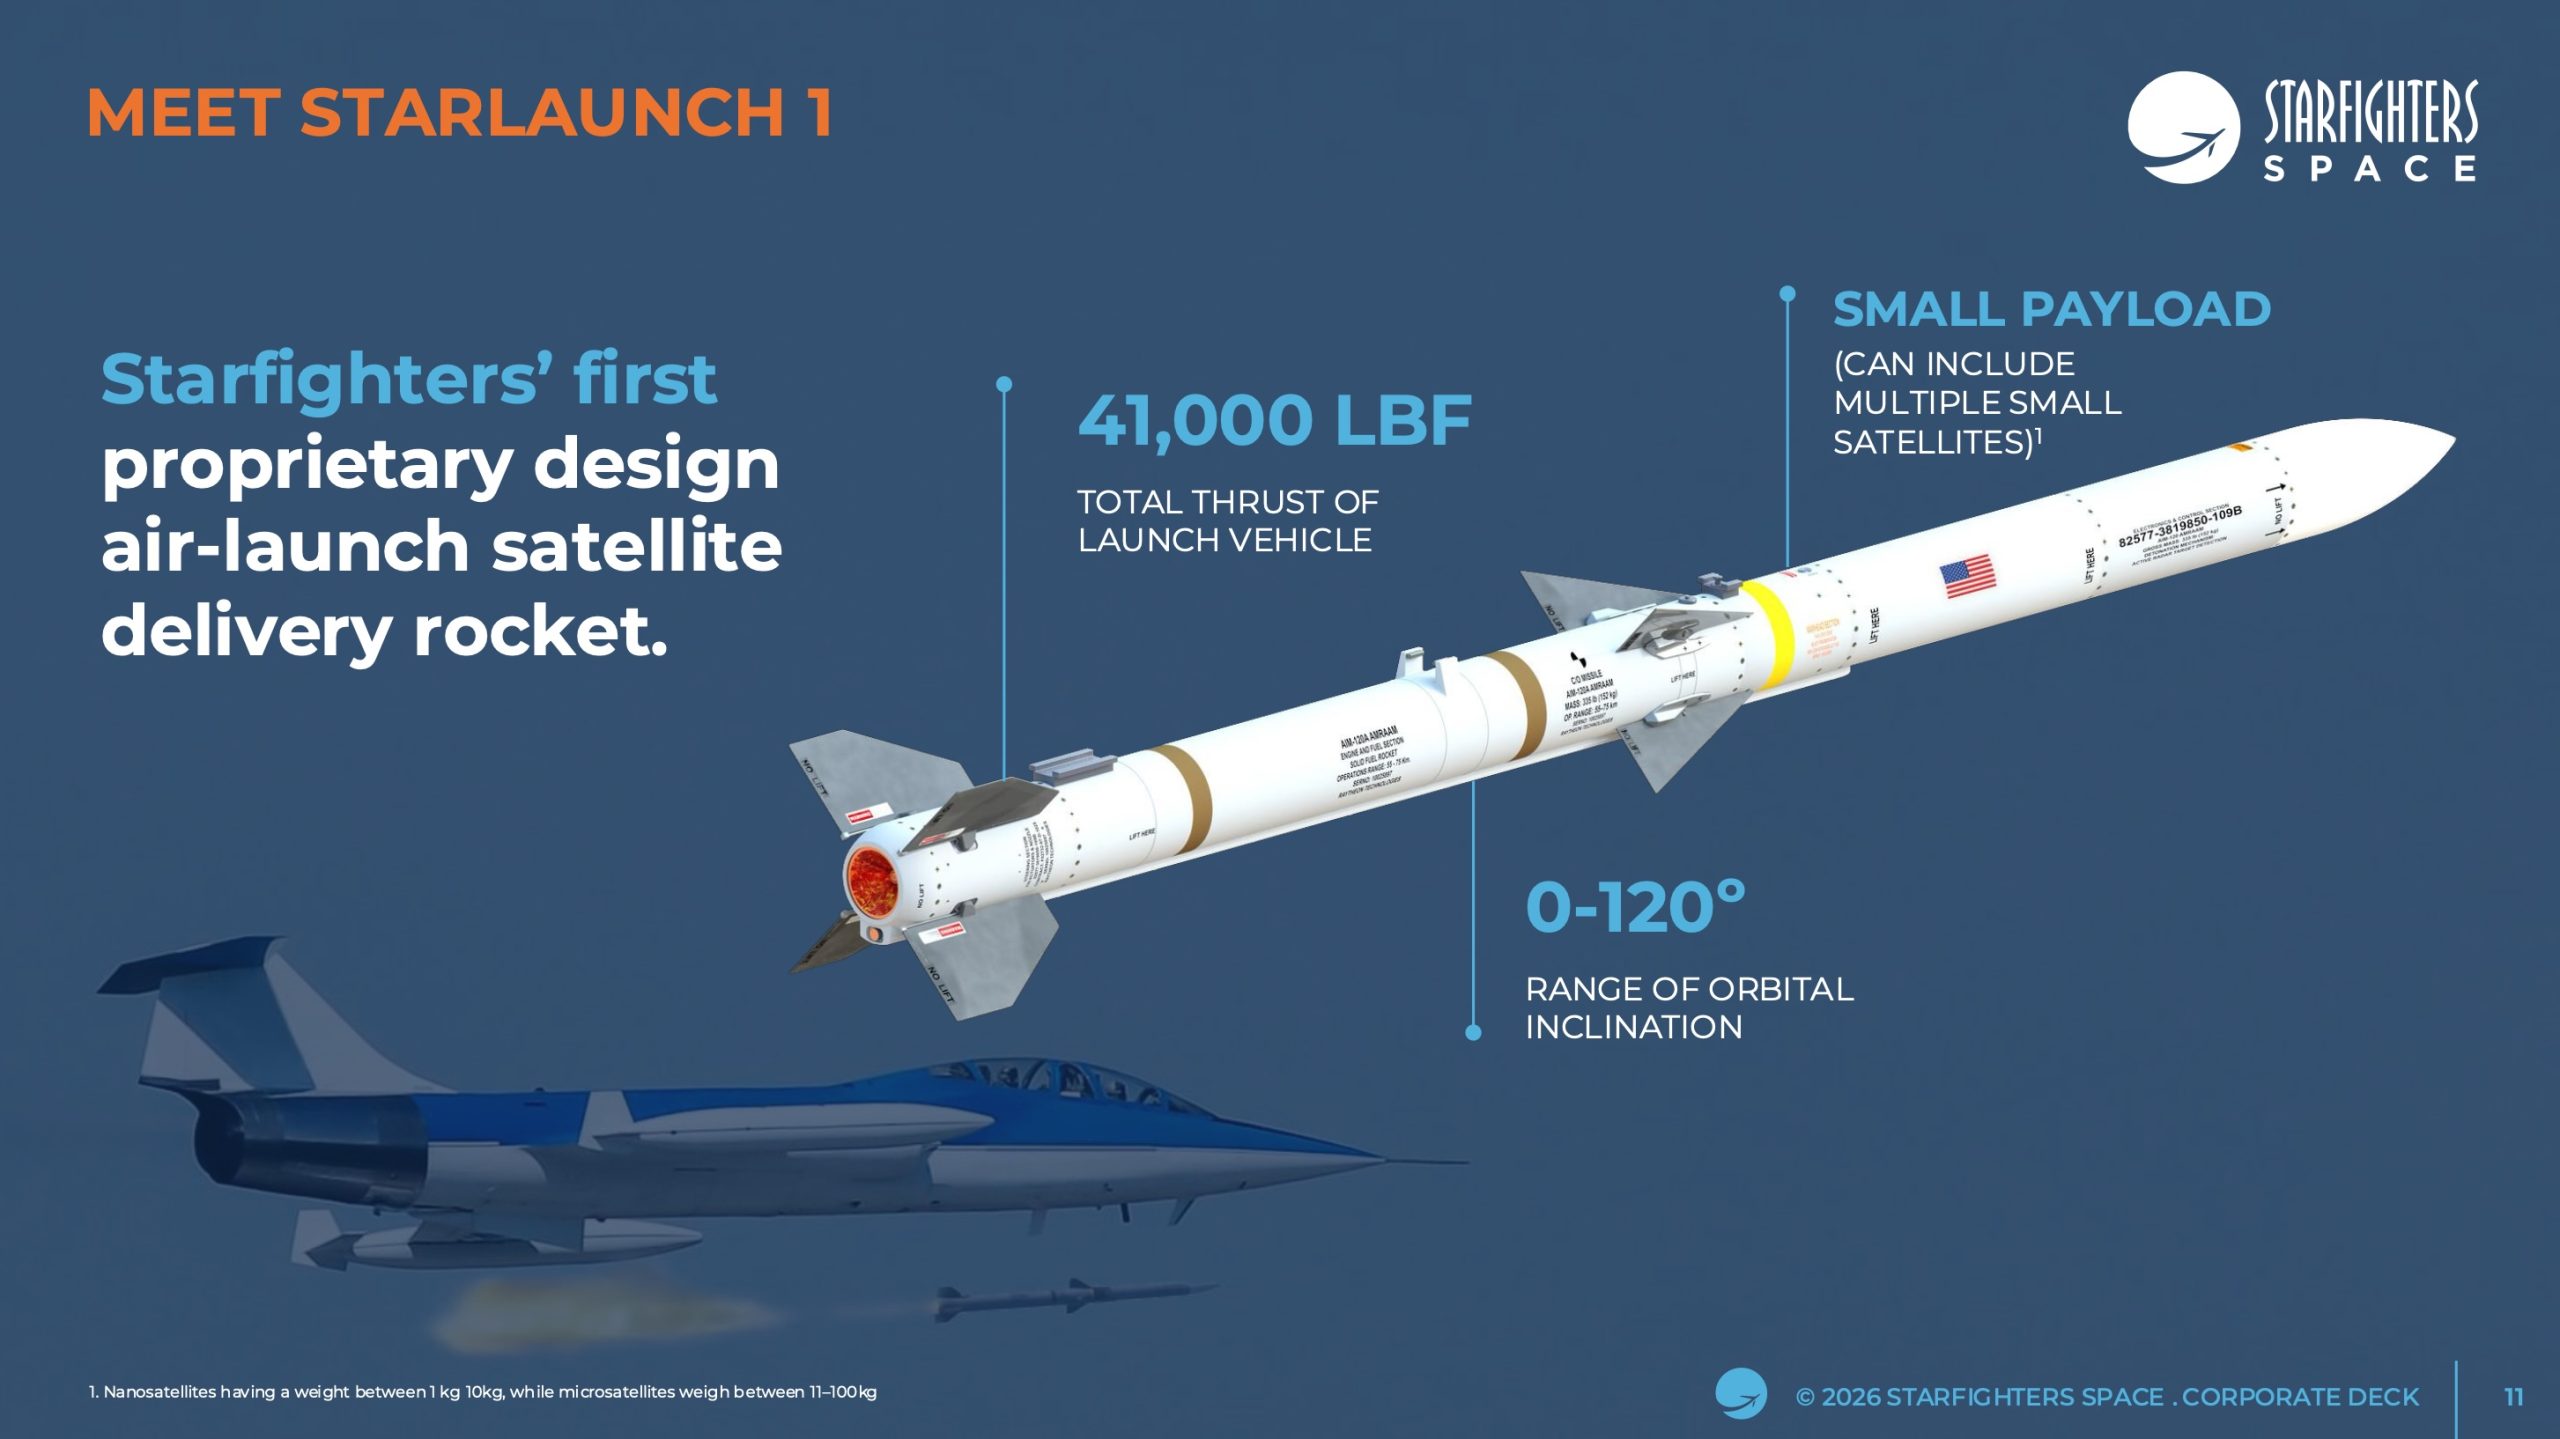
TAMPA, Fla. — Starfighters Space, which is developing F-104 supersonic jets for satellite air-launch, is turning its Texas facility into a staging ground for microgravity flight testing in response to
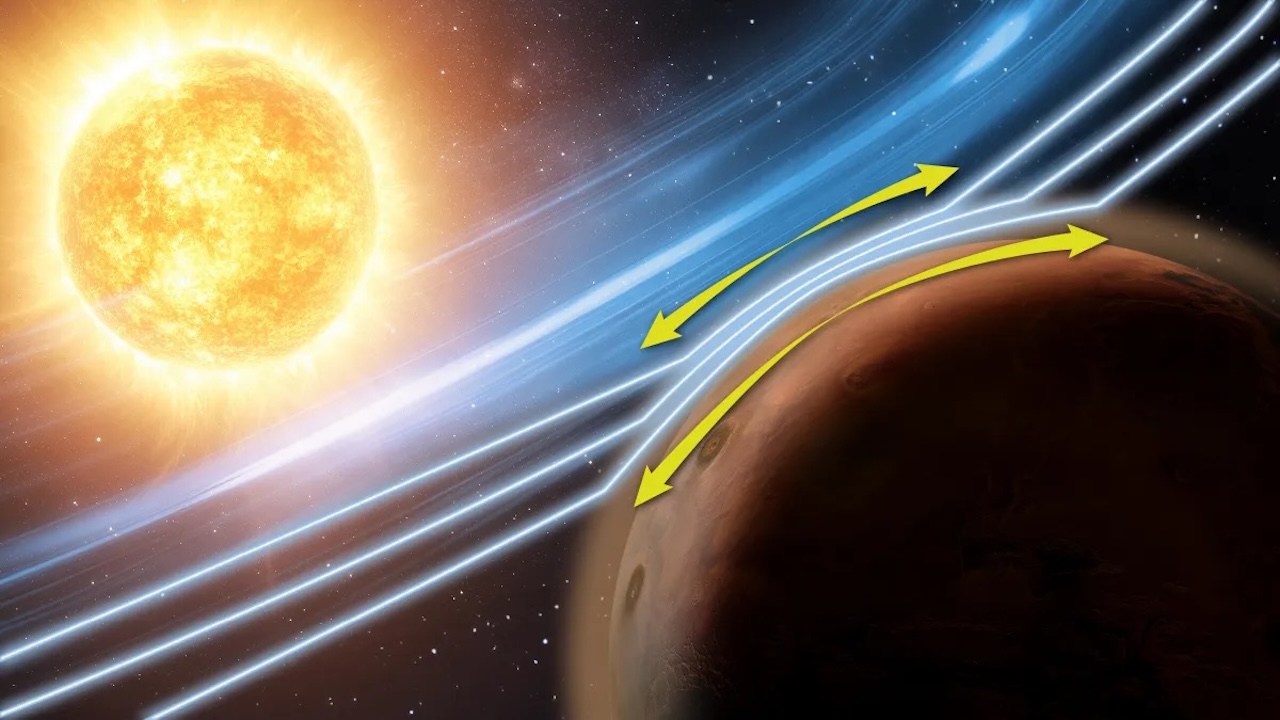
An artistic representation of the Zwan-Wolf effect at Mars, as observed by NASA’s MAVEN (Mars Atmosphere and Volatile Evolution) mission. While this effect typically helps to deflect the solar wind

WASHINGTON — A new report from supply-chain intelligence firm Altana quantifies the extent to which the U.S. commercial space industry remains dependent on components sourced from Chinese suppliers. At the
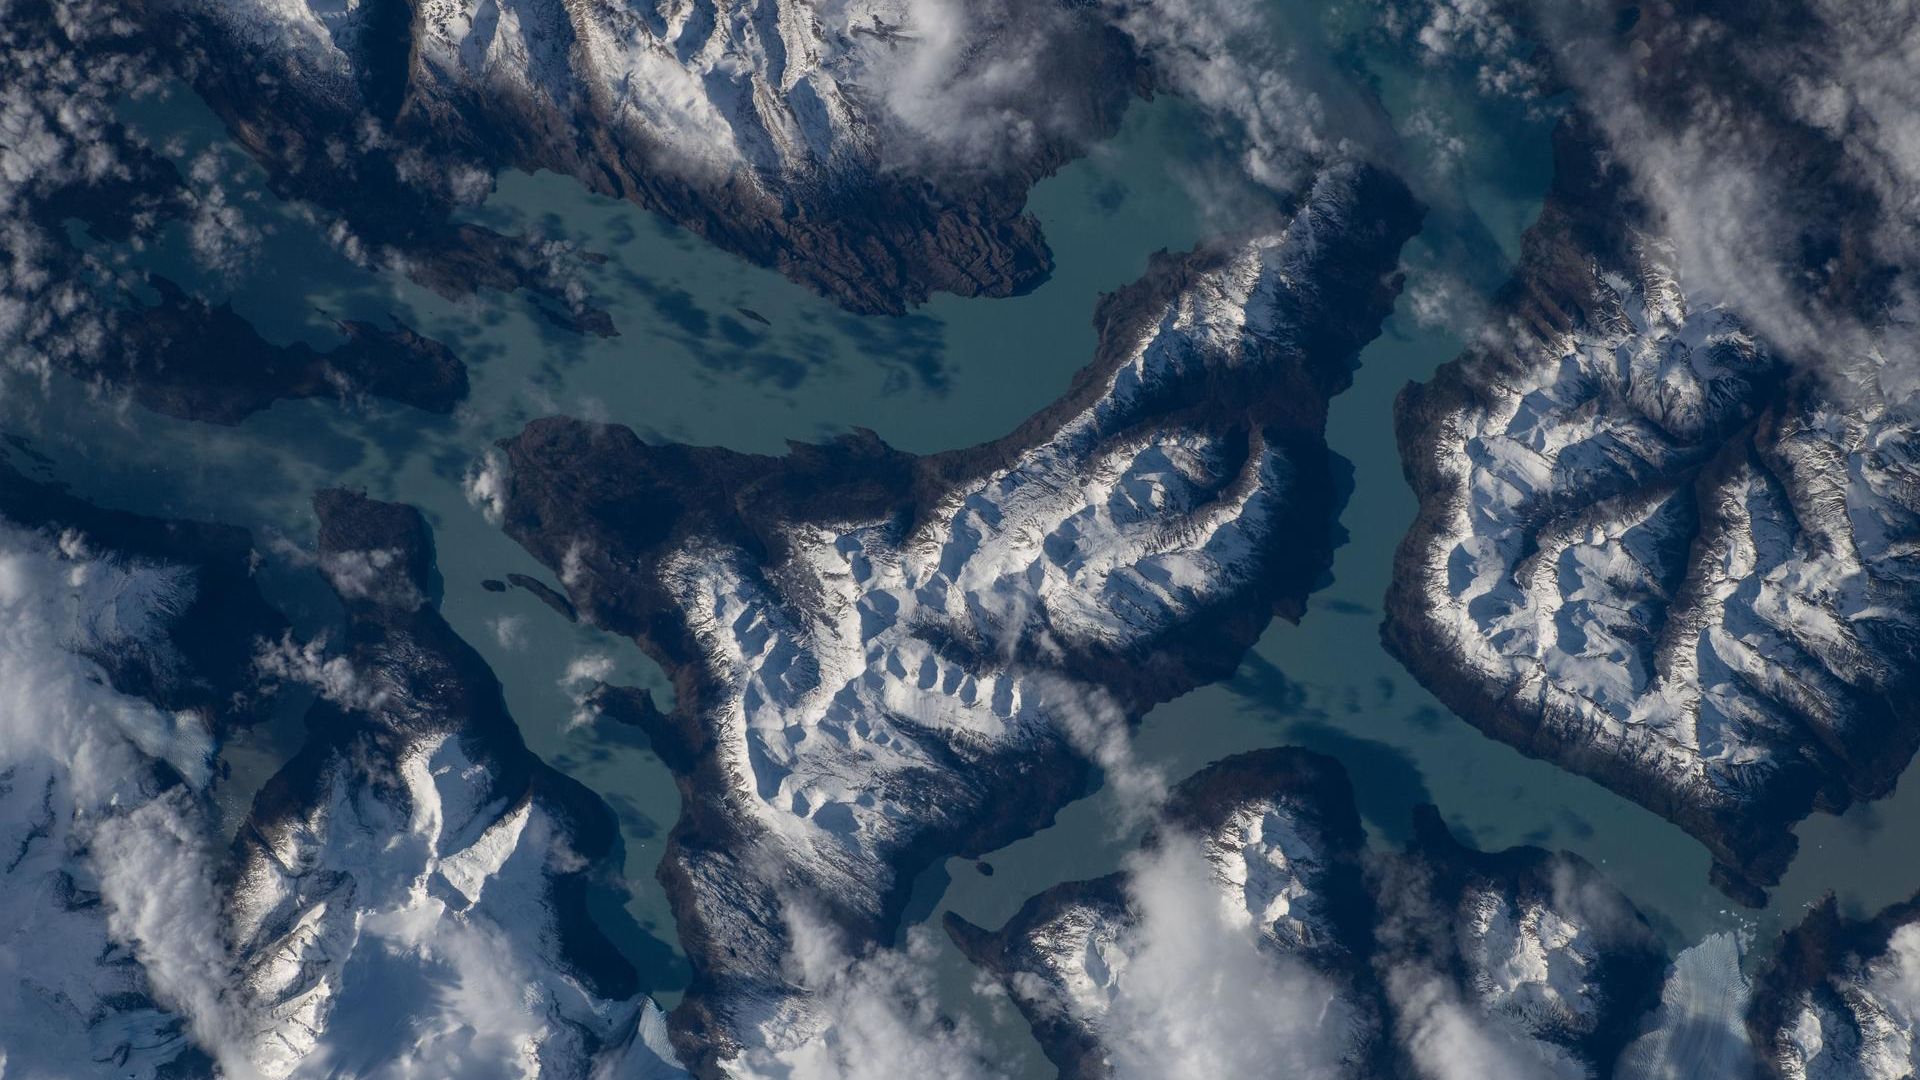
This image of Lake Argentino and the surrounding snow-capped mountains from space was captured by NASA astronaut Jessica Meir. (Image credit: NASA/Jessica Meir) Argentina’s towering, snow-capped Andes Mountains and turquoise
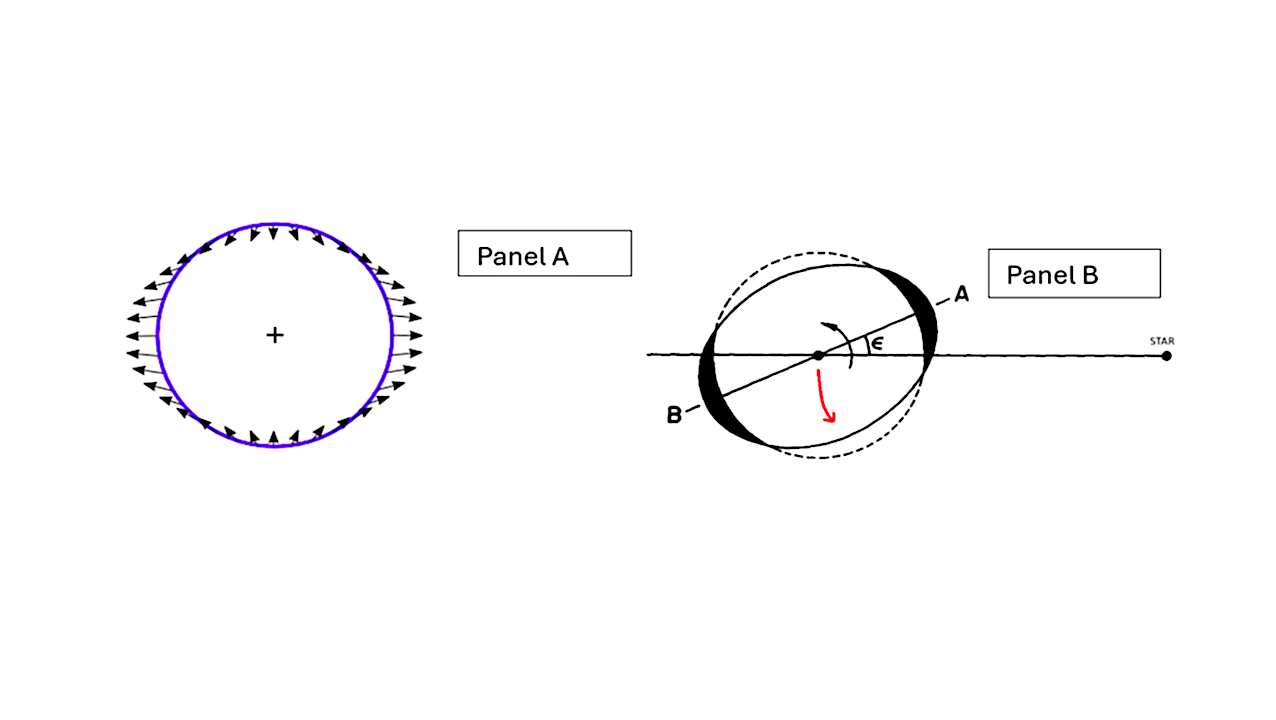
PANEL (A): Diagram of the net tidal accelerations acting on the planetary surface (caused by the host star’s gravity field). The planet is represented with a top view (i.e., as
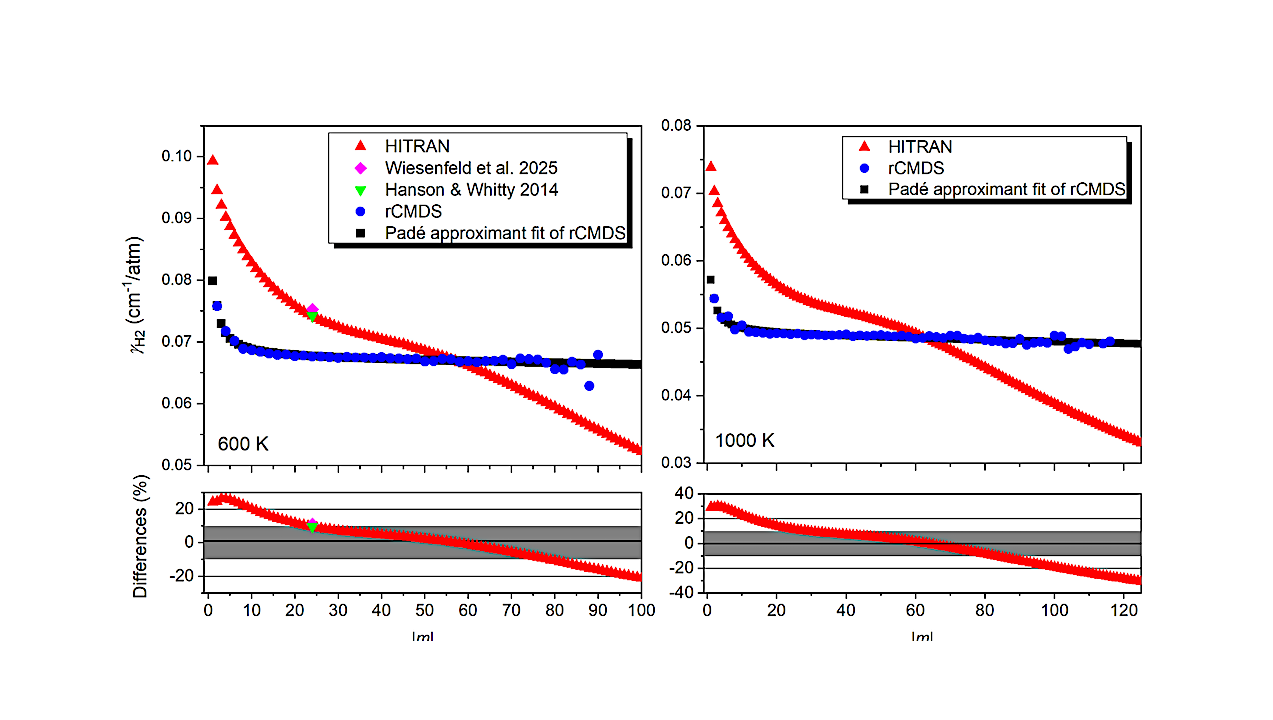
H2 broadening coefficient predicted by rCMDS at 600 K and 1000 K, and a comparison with values of HITRAN (Tan et al. 2022). The gray space represents the 10% precision


