
Now Reading: The Earth Observer: Offering Perspectives from Space through Time
-
01
The Earth Observer: Offering Perspectives from Space through Time


39 min read
The Earth Observer: Offering Perspectives from Space through Time
An Intertwined History: The Earth Observer and EOS
The Earth Observer, a newsletter issued for more than 36 years, will release its last online content at the close of 2025. This newsletter evolved in parallel with NASA’s Earth Observing System (EOS). It is almost impossible to speak of this newsletter without mentioning EOS. As The Earth Observer prepares its final publication, NASA also plans to shutter its three EOS flagship satellites (discussed below) possibly as early as the end of 2026.
While EOS was “much more than its satellites,” one cannot deny that the satellite missions and their iconic images provide an entry point to the overarching work conducted by the EOS science teams for almost three decades. These efforts spanned crucial complementary ground- and aircraft-based observations along with focused field campaigns to coordinate observations across multiple levels of Earth system time and spatial scales. The teams worked (and continue to work) closely with the NASA Earth Science Division Earth Observing System Data and Information System (EOSDIS) and related Science Investigator Processing System (SIPS) facilities, as well as developed and enhanced the algorithms that support the satellite products. Readers who wish to learn more about these topics should consult The Earth Observer’s archives page, which contains much of the history of this work.
During this point of inflection, The Earth Observer’s publication team felt it important to pause and reflect on the significance of the work detailed in the newsletter throughout this brief slip of time. The result is the article that follows.
A Flagship of an Idea: Almost Four Decades of Science
As described in the article, A Condensed History of the Earth Observing System (EOS) [June 1989, 1:3. 2–3], what would become known as EOS had its foundation in the recommendations of an ad hoc NASA study group that convened in 1981 to “determine what could and should be done to study integrated Earth science measurement needs.” Initially, the study group envisioned several large platforms in space, each with numerous instruments that would be serviced by the Space Shuttle, similar to servicing of the Hubble Telescope on several occasions. Known as System Z [Sept.–Oct. 2008, 20:5, 4–7], this early vision “laid the groundwork for a Mission to Planet Earth” but was reimagined after the tragic loss of the Space Shuttle Challenger in Jan. 1986. At the time, an article detailed the impracticality of launching shuttle missions into polar orbit to service EOS satellites, see Polar Shuttle Launches: The Path Almost Taken, Sept.–Oct. 2011, 23:5, 6–7]. Eventually, the large space platform concept morphed into several mid-size flagship satellite missions, known today as Terra, Aqua, and Aura. Smaller satellite missions would supplement and enhance the data gathered by the “big three” satellites – see Figure 1.
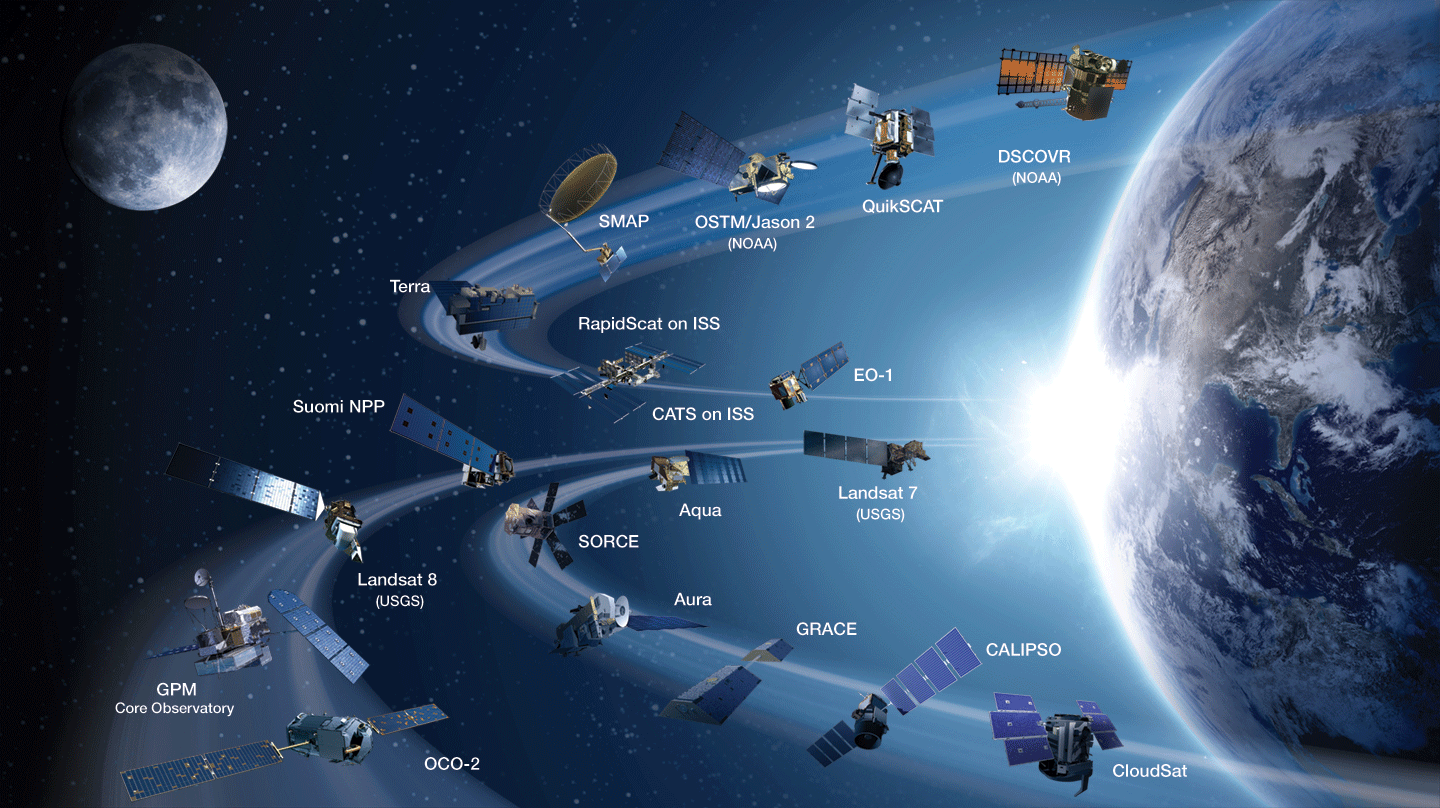
Technological advances further enhanced and refined this vision, allowing satellites to fly in close formation to capture near-simultaneous measurements in much the same way they would if they were on a single platform. The Afternoon Constellation, or A-Train, is a shining example of this international effort and is described in more detail below.
NASA released the first EOS Announcement of Opportunity in 1988, and a panel selected the winning proposals. An EOS Project Science Office was established to manage the projects. During this time of rapid development, NASA leadership was keenly aware of the need to keep the international EOS community abreast of the latest information. Enter The Earth Observer newsletter. First published in March 1989, the newsletter was the natural conduit to bridge this communication gap. To set the stage of how things have changed, an early article, titled Direct Transmissions of EOS Data to Worldwide Users [July–Aug. 1990, 2:6, 2–4], introduced the readership to the World Wide Web, which promoted “a ‘place’ where scientists communicate with each other and with the data they have collected with the help of their professional colleagues from the engineering and operations disciplines.”
In the more than 1000 printed pages published in the past three decades, The Earth Observer has chronicled the story of EOS and NASA’s broader Earth Science program. The publication has captured – often in meticulous detail – the intensive work behind the scenes that has gone into the development of the technologies, algorithms, and data centers that gather data from Earth observing satellites, suborbital observations, and other experiments to inform end users who use the data to address societal issues.
In the years before the first EOS missions launched, the newsletter reported in earnest on Investigator Working Group (IWG) meetings, Payload Panel Reviews (reviewing the instruments planned for the EOS platforms), and Mission and Instrument Science Team Meetings. As EOS matured, the newsletter began reporting on the development and implementation of specific science missions, launches, milestones, and research generated from the data collected. The editorial staff began publishing more feature articles to appear along with the meeting and workshop reports. The newsletter shared news stories developed by NASA’s Earth Science News Team and other bimonthly content (e.g., Education Update, Science in the News). The Editor’s Corner column in the newsletter gave the EOS Senior Project Scientist a platform to offer commentary on current events in NASA Earth Science as well as on the content of the current issue of the newsletter. While not formally named for the first few issues, an editorial article has been a cornerstone of the publication since the beginning.
The Earth Observer has produced several articles reflecting on its interwoven history with EOS, such as The Earth Observer: Twenty-Five Years Telling NASA’s Earth Science Story [March–April 2014, 26:2, 4–12] and A Thirtieth Anniversary Reflection from the Executive Editor [March–April 2019, 31:2, 4–6]. These stories expand upon the topics covered in the brief review presented in this article.
Satellite Missions: the Backbone of EOS Science
EOS was originally organized around 24 critical science measurements deemed integral to understand planetary processes and assess variability, long-term trends, and climate change. These science measurements serve as a roadmap for organizing EOS data products and mission objectives. The 24 measurements coalesced into five broad categories that reflect Earth science disciplines:
- Atmosphere: aerosol properties, cloud properties (e.g., fraction and opacity), atmospheric temperature and pressure profiles, water vapor, ozone (O3), trace gases [e.g., carbon dioxide (CO2), sulfur dioxide, and formaldehyde], and total solar irradiance;
- Ocean: ocean color (chlorophyll), sea surface temperature, sea ice cover and motion, ocean surface topography and sea level, and sea surface salinity;
- Land/Cryosphere: land surface temperature, soil moisture, snow and ice cover (extent and elevation), land cover and change (e.g., forest cover), and topography;
- Radiation/Energy Balance: radiant energy balance (incoming and outgoing radiation), and precipitation (e.g., rainfall, snow); and
- Solid Earth: static gravity field and synthetic aperture radar observations.
The Grand Vision of EOS: Three Flagships Leading the Earth Observing Fleet
In the late 1980s and early 1990s, a team of scientists envisaged the concept for two missions – EOS-AM1 and EOS-PM1. The synergy of this system was the ability to make observations in the morning (10:30 AM), a time when cloud cover over the tropical equatorial and other land regions would be at a minimum, and afternoon (1:30 PM), a time when continental convection would peak. The plan was to have two instruments – the Moderate Resolution Imaging Spectroradiometer (MODIS) and Clouds and Earth’s Radiant Energy System (CERES) – overlap on the two platforms along with other instruments unique to each mission (named below).
In parallel, the teams envisioned CHEM1, a satellite platform identical to EOS-PM1 but carrying a payload focused on atmospheric chemistry. Like EOS-PM1, CHEM1 would be placed in an afternoon orbit but lag slightly in its equatorial crossing time (1:45 PM) to optimize its position for atmospheric chemistry observations.
Each mission was slated to be the first in a series that would launch at five-year intervals to ensure continuity of critical Earth science measurements. Budgetary realities and technical advances eventually rendered plans for the second and third series of each satellite obsolete; however, all three flagship missions endured far beyond their planned six-year lifetime, and have outlasted the originally proposed 15-year timeframe for each series.
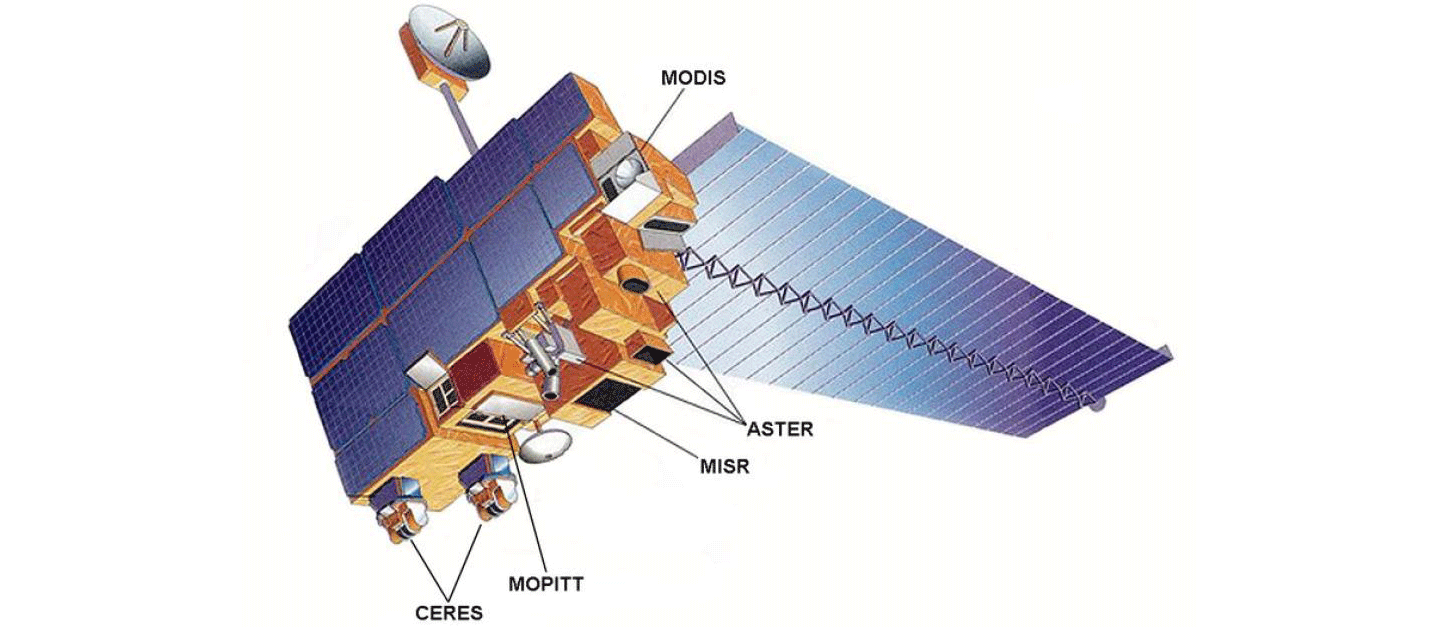
Terra
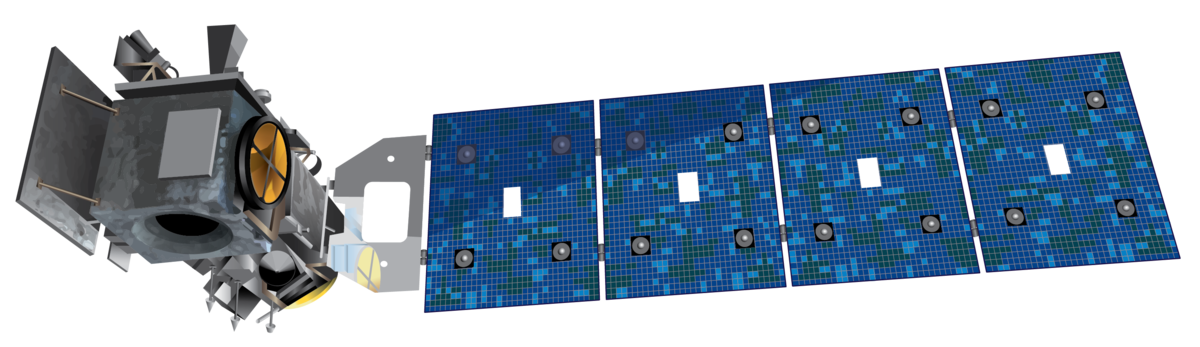
Terra, originally named EOS-AM1, launched in December 1999 – see Figure 2. Terra carries five instruments – MODIS, CERES, Multiangle Imaging Spectroradiometer (MISR), Advanced Spaceborne Thermal Emission and Reflection Radiometer (ASTER), and Measurements of Pollution in the Troposphere (MOPITT) – and was designed to capture information about Earth’s atmosphere, carbon cycle and ecosystems, climate variability, water and energy cycle, weather, and the planet’s surface and interior. After 26 years in service, Terra remains in orbit and continues to gather data today, although it began drifting to earlier equatorial crossing times in 2020 due to fuel limitations, along with an orbital lowering maneuver in 2022. The Earth Observer captured early Terra data in the article, Terra Spacecraft Open For Business [March–April 2000, 12:2, 24]. A more complete history of Terra is available in the online article, Terra: The End of An Era [**fill in link once published**], published on December xx, 2025.
Aqua
Aqua, originally named EOS-PM1, launched in May 2002 – see Figure 3. An article in The Earth Observer at the time of launch described the mission, Aqua is Launched! [March–April 2002, 14:2, 2]. The second EOS flagship carried six different instruments into orbit – Atmospheric Infrared Sounder (AIRS), Advanced Microwave Sounding Unit–A (AMSU-A1 and -A2), CERES (two copies), MODIS (both of which also fly on Terra), the Advanced Microwave Scanning Radiometer for EOS (AMSR–E), and Humidity Sounder for Brazil (HSB). Aqua’s mission focused on collecting data on global precipitation, evaporation, and the cycling of water. Aqua paired its data with Terra, offering the scientific community additional insights into the daily cycles for important scientific parameters to understand the global water cycle.
The Earth Observer article, Aqua: 10 Years After Launch [Nov.–Dec. 2012, 24:6, 4–17] provides an overview of the mission’s accomplishments during its first decade in orbit. Due to fuel limitations, Aqua completed the last of its drag makeup maneuvers in December 2021. The satellite is now in a free-drift mode, slowly descending below the A-Train orbit and crossing the equator later and at lower altitudes. A more recent newsletter article, Aqua Turns 20 [May–June 2022, 34:3, 5–12] reflects on Aqua’s accomplishments and legacy after two decades in orbit.

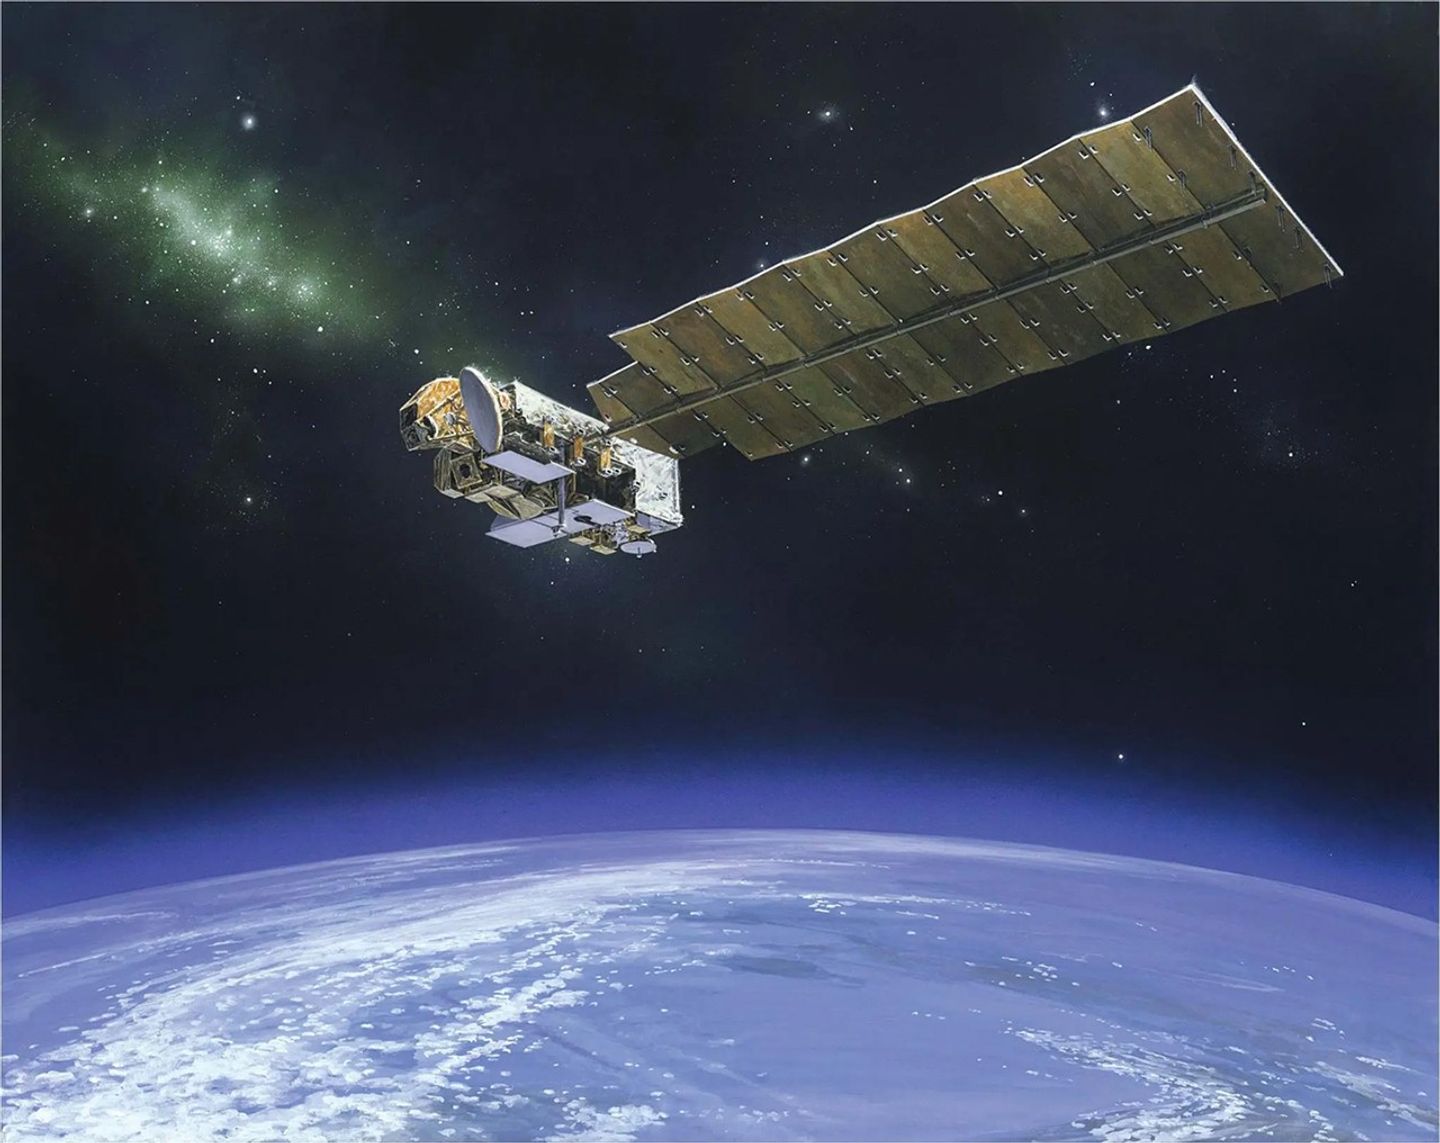
Aura
Aura, the third and final flagship mission, launched in July 2004 – see Figure 4. The Earth Observer detailed the first post-launch science team meeting, Aura Science Team Meeting [March–April 2004, 17:2, 8–11]. Originally called CHEM1, Aura followed a Sun-synchronous, near-polar orbit, crossing the equator after Aqua. Similar to Aqua, Aura completed its final inclination adjustment maneuver in April 2023 to save its remaining fuel to allow for controlled reentry. As a consequence, the satellite has drifted out of the A-Train orbit, slowly continuing to move to a later equatorial crossing time and lower orbit altitude.
Aura’s payload included four instruments: the Microwave Limb Sounder (MLS), High Resolution Dynamics Limb Sounder (HIRDLS), Tropospheric Emission Spectrometer (TES), and Ozone Monitoring Instrument (OMI). These instruments gather information on trace gases and aerosols in the atmosphere. The key mission objectives aimed to monitor recovery of the stratospheric O3 hole, evaluate air quality, and monitor the role of the atmosphere in climate change. The article, Aura Celebrates Ten Years in Orbit [Nov.–Dec. 2014, 26:6, 4–16] detailed Aura’s first decade of accomplishments. The online article, Aura at 20 Years, published September 16, 2024, reported on Aura’s status and achievements as it began its third decade of coninuous operations.
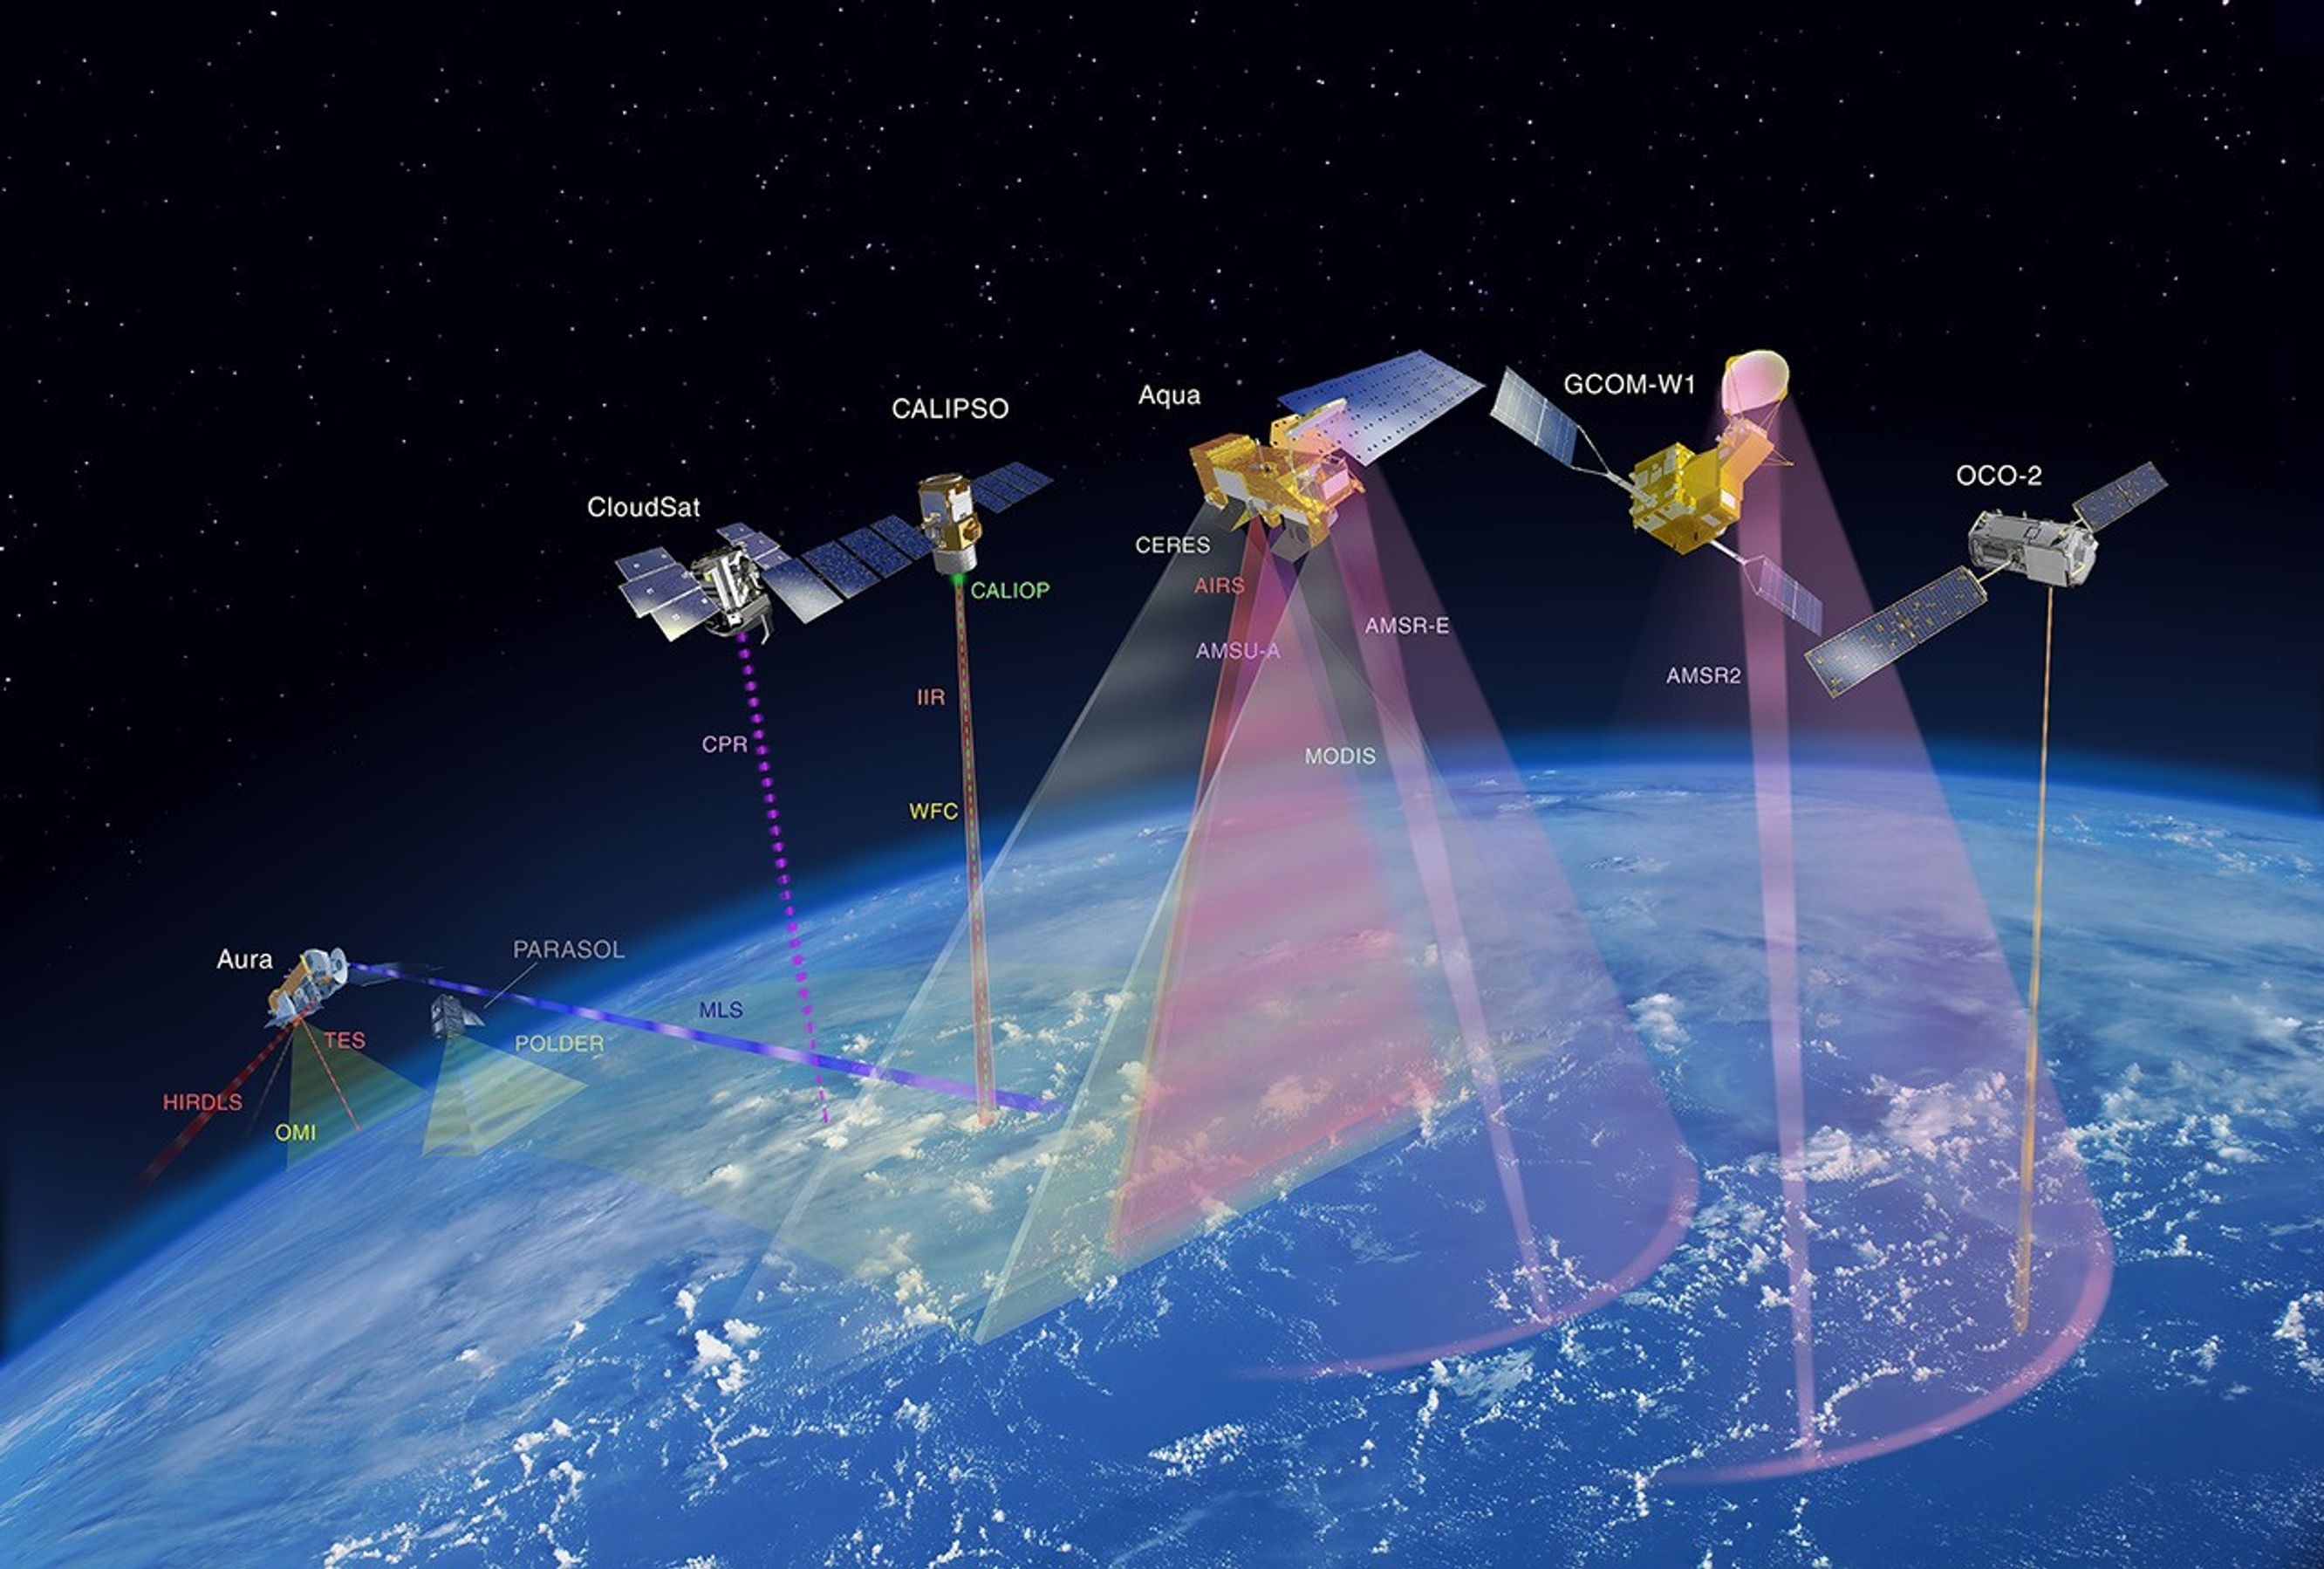
Building and Dismantling the “A-Train”
Between 2002 and 2014, a series of satellites joined the A-Train constellation – see Figure 5. This international effort includes the two EOS flagship satellites with afternoon equatorial crossing times (Aqua and Aura) as well as the Orbiting Carbon Observatory–2 (OCO-2), CloudSat, and the Cloud-Aerosol Lidar and Infrared Pathfinder Satellite Observations (CALIPSO). In addition, Polarization and Anisotropy of Reflectances for Atmospheric Sciences coupled with observations from a Lidar (PARASOL) and Global Change Observation Missions with a focus on the water cycle (GCOM-W) are two international missions that became part of the A-Train constellation.
In the past decade, many of the satellites in the A-Train have either retired or have been allowed to drift out of the constellation. As of this writing, only two satellites – OCO-2 and GCOM-W1 – remain in their positions in the A-Train gathering data.
Three A-Train symposiums have been organized to bring the Earth science community together to discuss the achievements and future synergy of these missions. The outcome from these meetings were reported in The Earth Observer. The reader is referred to the archives page of The Earth Observer website to find links to summaries of these meetings.
Science from the EOS Fleet
The next several sections provide a highlight of science from key missions outside of Terra, Aqua, and Aura. The content has been organized in terms of measurements – with an overarching focus on water (oceans and fresh water), atmosphere, and land. This summary is far from exhaustive. A record of much of the amazing science conducted during these missions is detailed in the archives of The Earth Observer.
Interpreting an Ocean of Data
When viewed from space, Earth has been described as a “blue marble.” The planet’s abundance of liquid water is found in the oceans, and while not potable, the oceans play a critical role in regulating Earth’s climate. Satellites provide an unparalleled way to study the global ocean. With each new mission, the process of data collection has been refined and improved. The scientific community can now measure ocean color as a proxy for surface productivity as well as measure subtle changes in surface ocean salinity. These data have improved weather and climate models to increase the accuracy of storm projection and help the scientific community better understand the movement of energy around the planet.
Aqua was the flagship mission dedicated to studying water on Earth, but other missions have contributed and expanded on this data record. For example, Japan’s GCOM-W mission, also known as SHIZUKU (Japanese for droplet), continues to gather information on precipitation, water vapor, wind velocity above the ocean, sea water temperature, water levels on land, and snow depths. These data support weather models to improve forecasts to monitor tropical cyclones. The subsections that follow provide examples of how data from these satellites support different science objectives, as well as examples of the science deciphered by both flagship and ancillary platforms within the A-Train. All of these missions and science have been covered in The Earth Observer over the past several decades.
Discerning the Ocean’s True Colors
Ocean color data are crucial for studying the primary productivity and biogeochemistry of the oceans. The Coastal Zone Color Scanner (CZCS), launched on the Nimbus 7 satellite in 1978 and ceasing operations in 1986 – gave the earliest perspective of the oceans from space. SeaWiFS, which served as a follow-on to CZCS, was launched on the privately owned Seastar spacecraft on August 1, 1997 to produce ocean color data and offered a synoptic look at the global biosphere. This mission was a data-buy, where NASA purchased the data from Orbital Imaging Corporation. An article in The Earth Observer, titled Sea-viewing Wide Field-of-view Sensor [March–April 1998, 10:2, 20–22] detailed how the satellite gathered chlorophyll-a data that was calibrated to field measurements from a Marine Optical Buoy. The research community have used this information to understand primary productivity in the surface ocean and global biogeochemistry. This data offered an early assessment of the role of the ocean in the global carbon cycle. It also produced one of the first global perspectives of the impact of El Niño and La Nina events around the world. Coastal and fishery managers have used this data to improve the health of these important ecosystems. Launched for a five-year mission, SeaWiFs gathered data until December 2010.
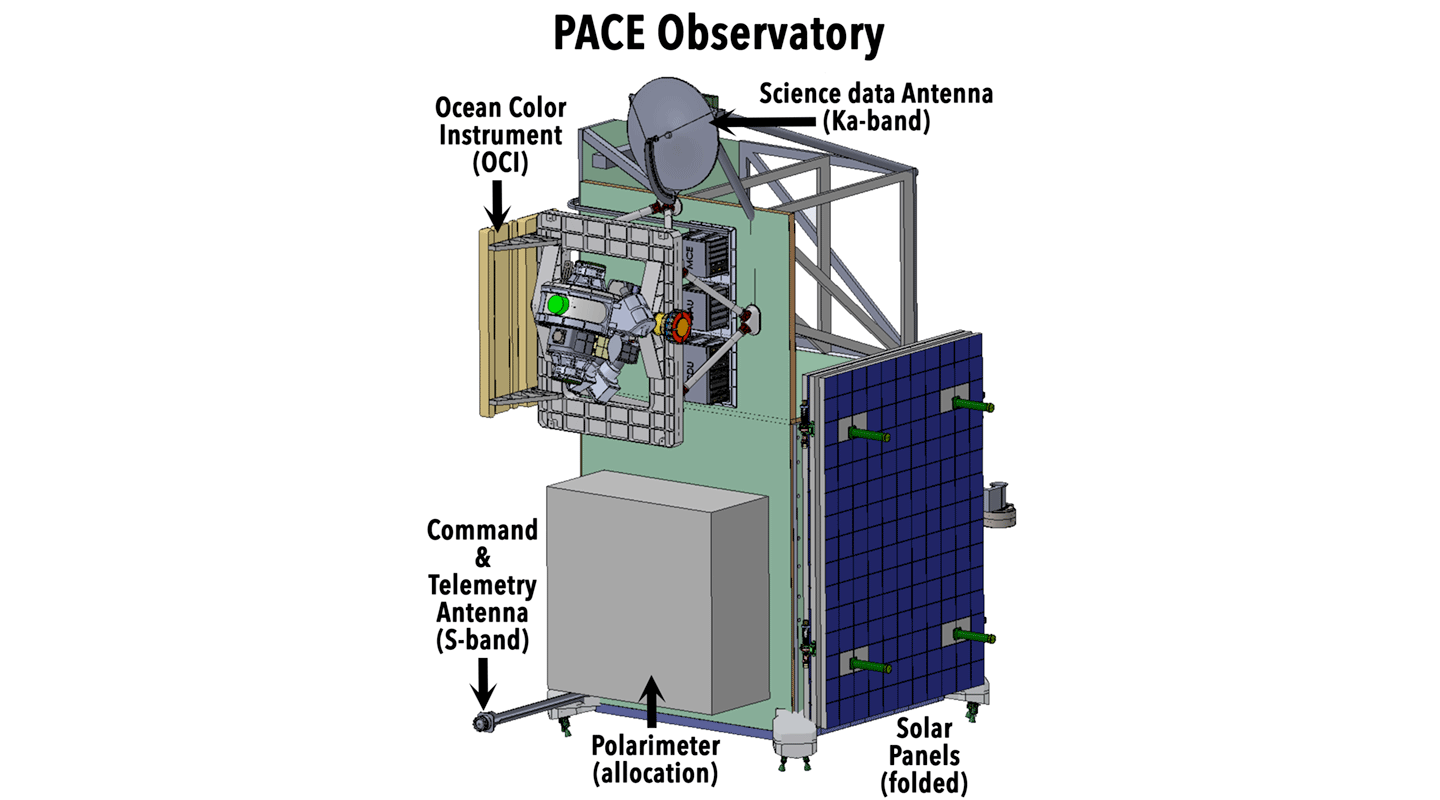
More recently, NASA launched the Plankton, Aerosol, Cloud ocean Ecosystem (PACE) satellite in February 2024 to gather data on ocean and terrestrial ecosystem productivity – see Figure 6. While other missions studied ocean color in the interim between SeaWiFS and PACE (e.g., MODIS on Terra and Aqua), PACE offers an exponential leap forward with its three-instrument payload that includes: the Ocean Color Instrument (OCI), Hyper-Angular Rainbow Polarimeter–2 (HARP2), and Spectropolarimeter for Planetary Exploration (SPEXone). The PACE mission aims to clarify how the ocean and atmosphere exchange CO2, a key factor in understanding the evolution of Earth’s climate system. The satellite also examines the role of aerosols in providing micronutrients that fuel phytoplankton growth in the surface ocean. The data gathered extends the aerosol and ocean biological, ecological, and biogeochemical records that were initiated by other satellites. The Dec. XX, 2025 article, Keeping Up with PACE: Summary of the 2025 PAC3 Meeting, [link me when published] reports on three recent meetings related to the mission.
Mapping the Ocean Surface to Reveal the Rising Seas
The Ocean Surface Topography (TOPEX)/Poseidon mission, launched on August 10, 1992, was the first in a series of missions that have measured ocean surface topography, or the variations in sea surface height. This record now extends more than 30 years. TOPEX/Poseidon spent more than 13 years in orbit. The data gathered helped to improve the scientific community’s understanding of ocean circulation and its impact on global climate – including sea level rise. TOPEX/Poseidon produced the first global views of seasonal current changes, which allowed scientists to forecast and better understand El Niño events. The early efforts to distribute data was captured in The Earth Observer article, Jet Propulsion Laboratory DAAC Begins TOPEX Data Distribution [Mar–Apr 1993, 6:2, 24].
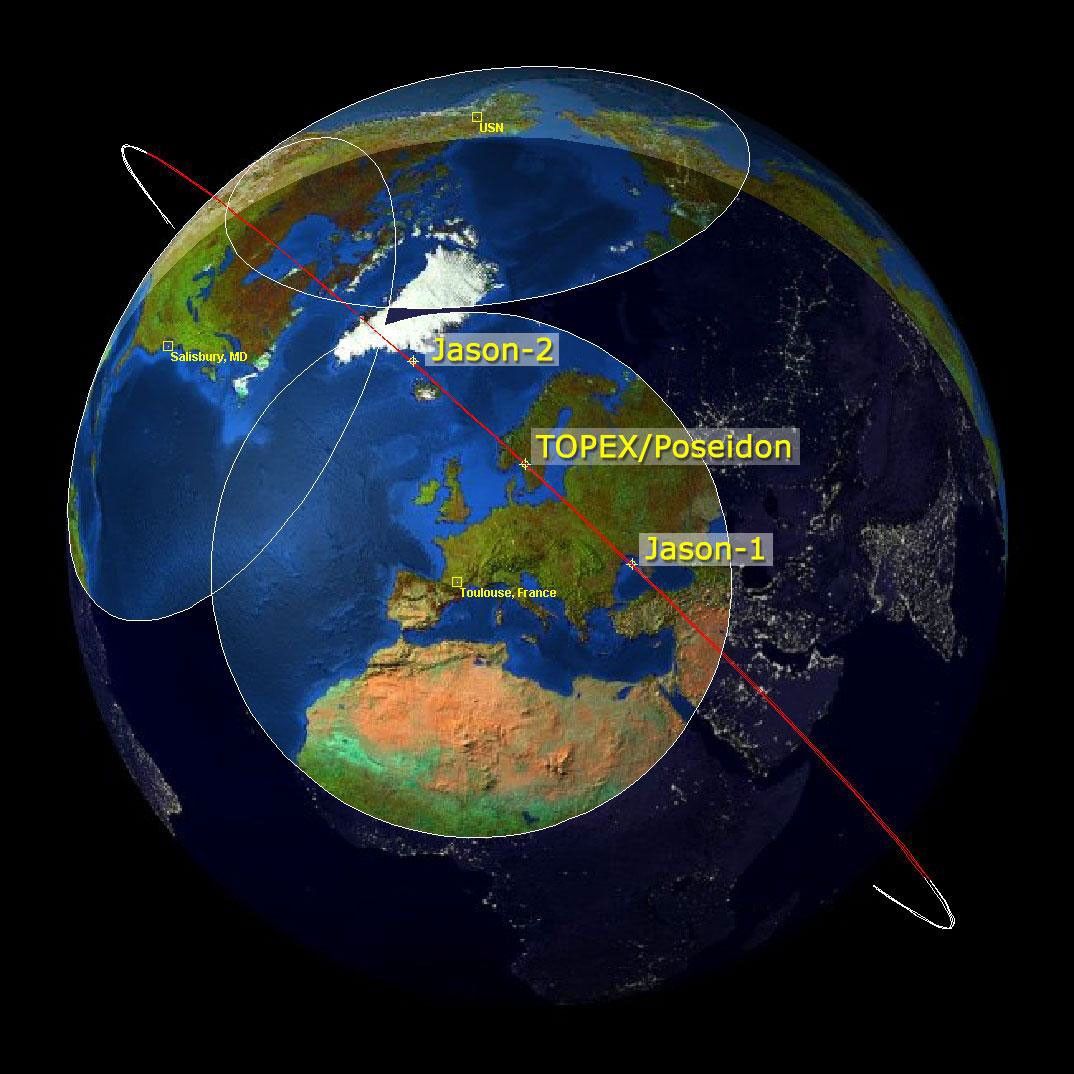
Jason followed TOPEX/Poseidon to continue the measure of sea level as well as wind speed and wave height for more than 95% of Earth’s ice-free ocean – see Figure 7. Jason consists of a series of satellites, with Jason-1, launched in 2001, remaining in orbit for 11 years. It was followed by Jason-2, also called the Ocean Surface Topography Mission (OSTM), which was launched in 2008. Jason-2 gathered data for 11 years. Jason-3 launched in January 2016 and remains in orbit, continuing the sea level dataset. The Earth Observer has reported on meetings of the Ocean Surface Topography Science Team over the years. The online article, Summary of the 2023 Ocean Surface Topography Team Meeting, was published May 31, 2024 and includes the most recent updates available.
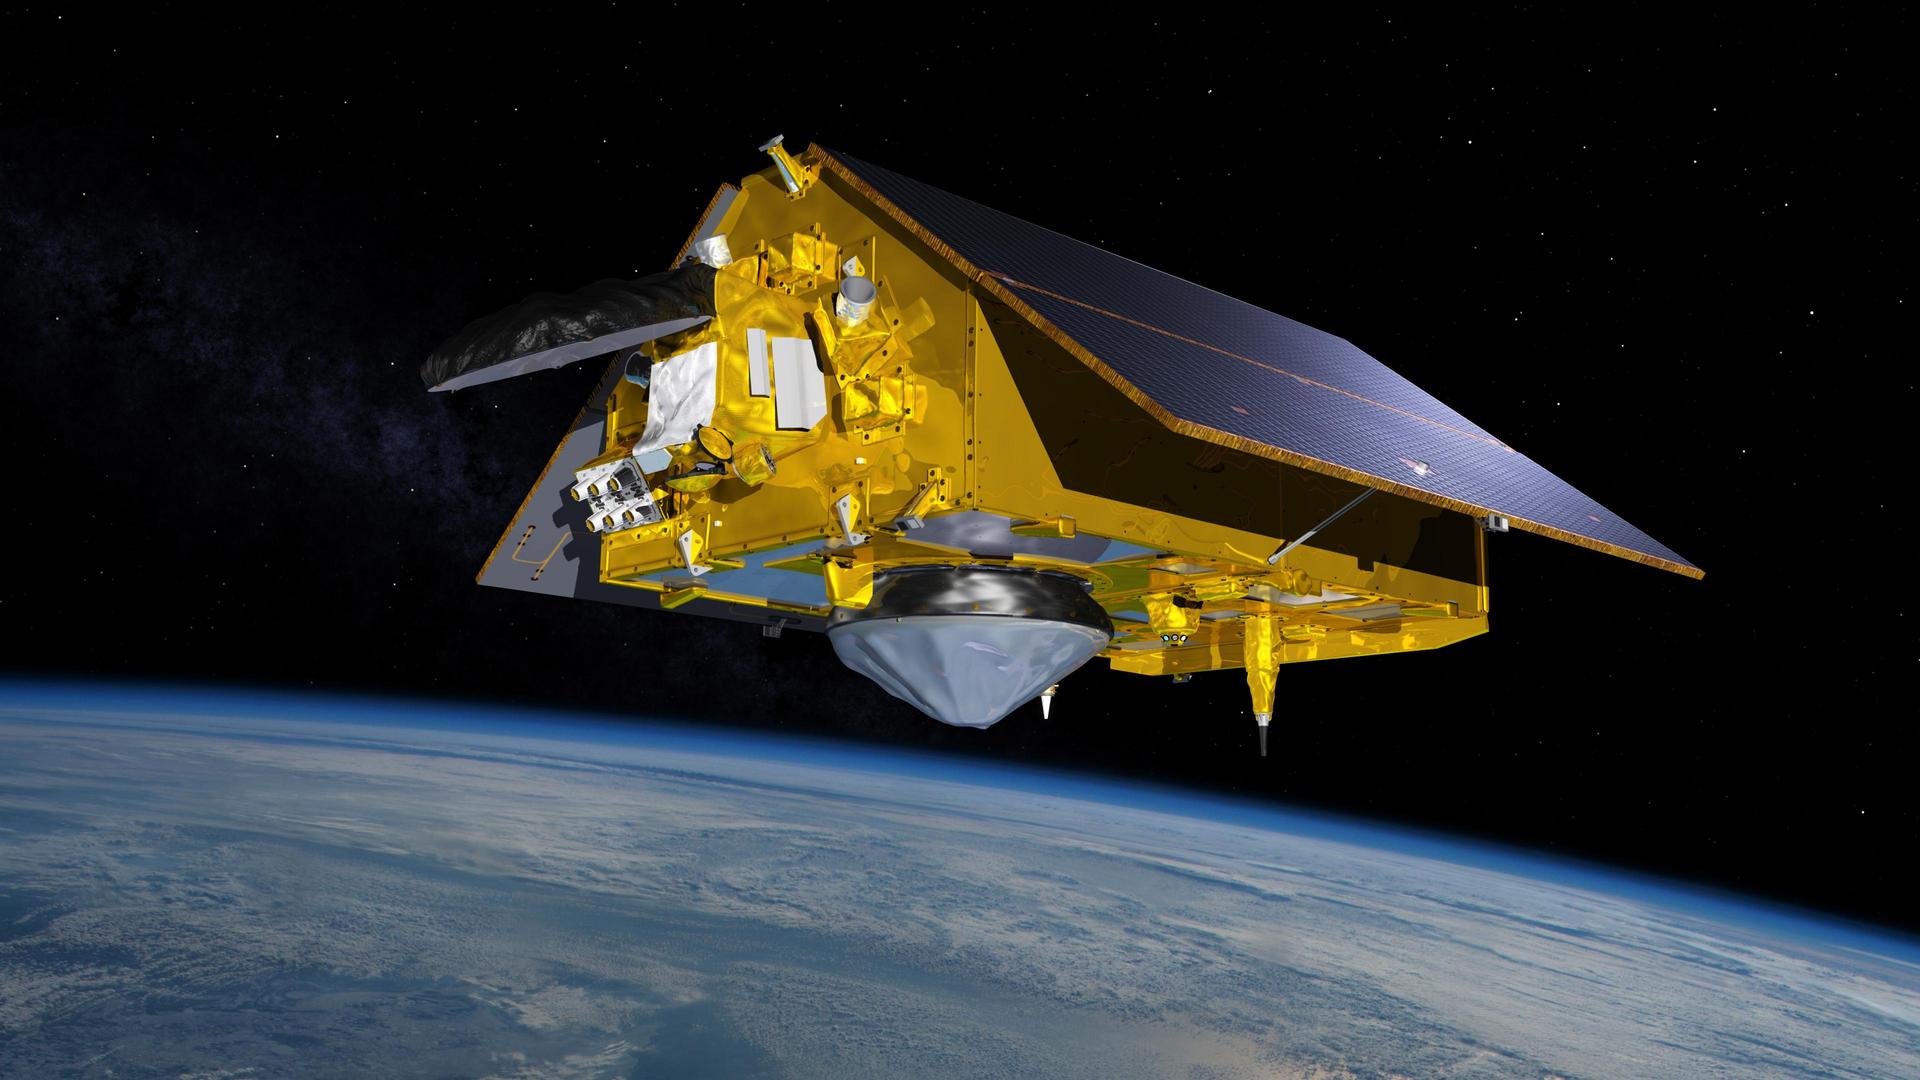
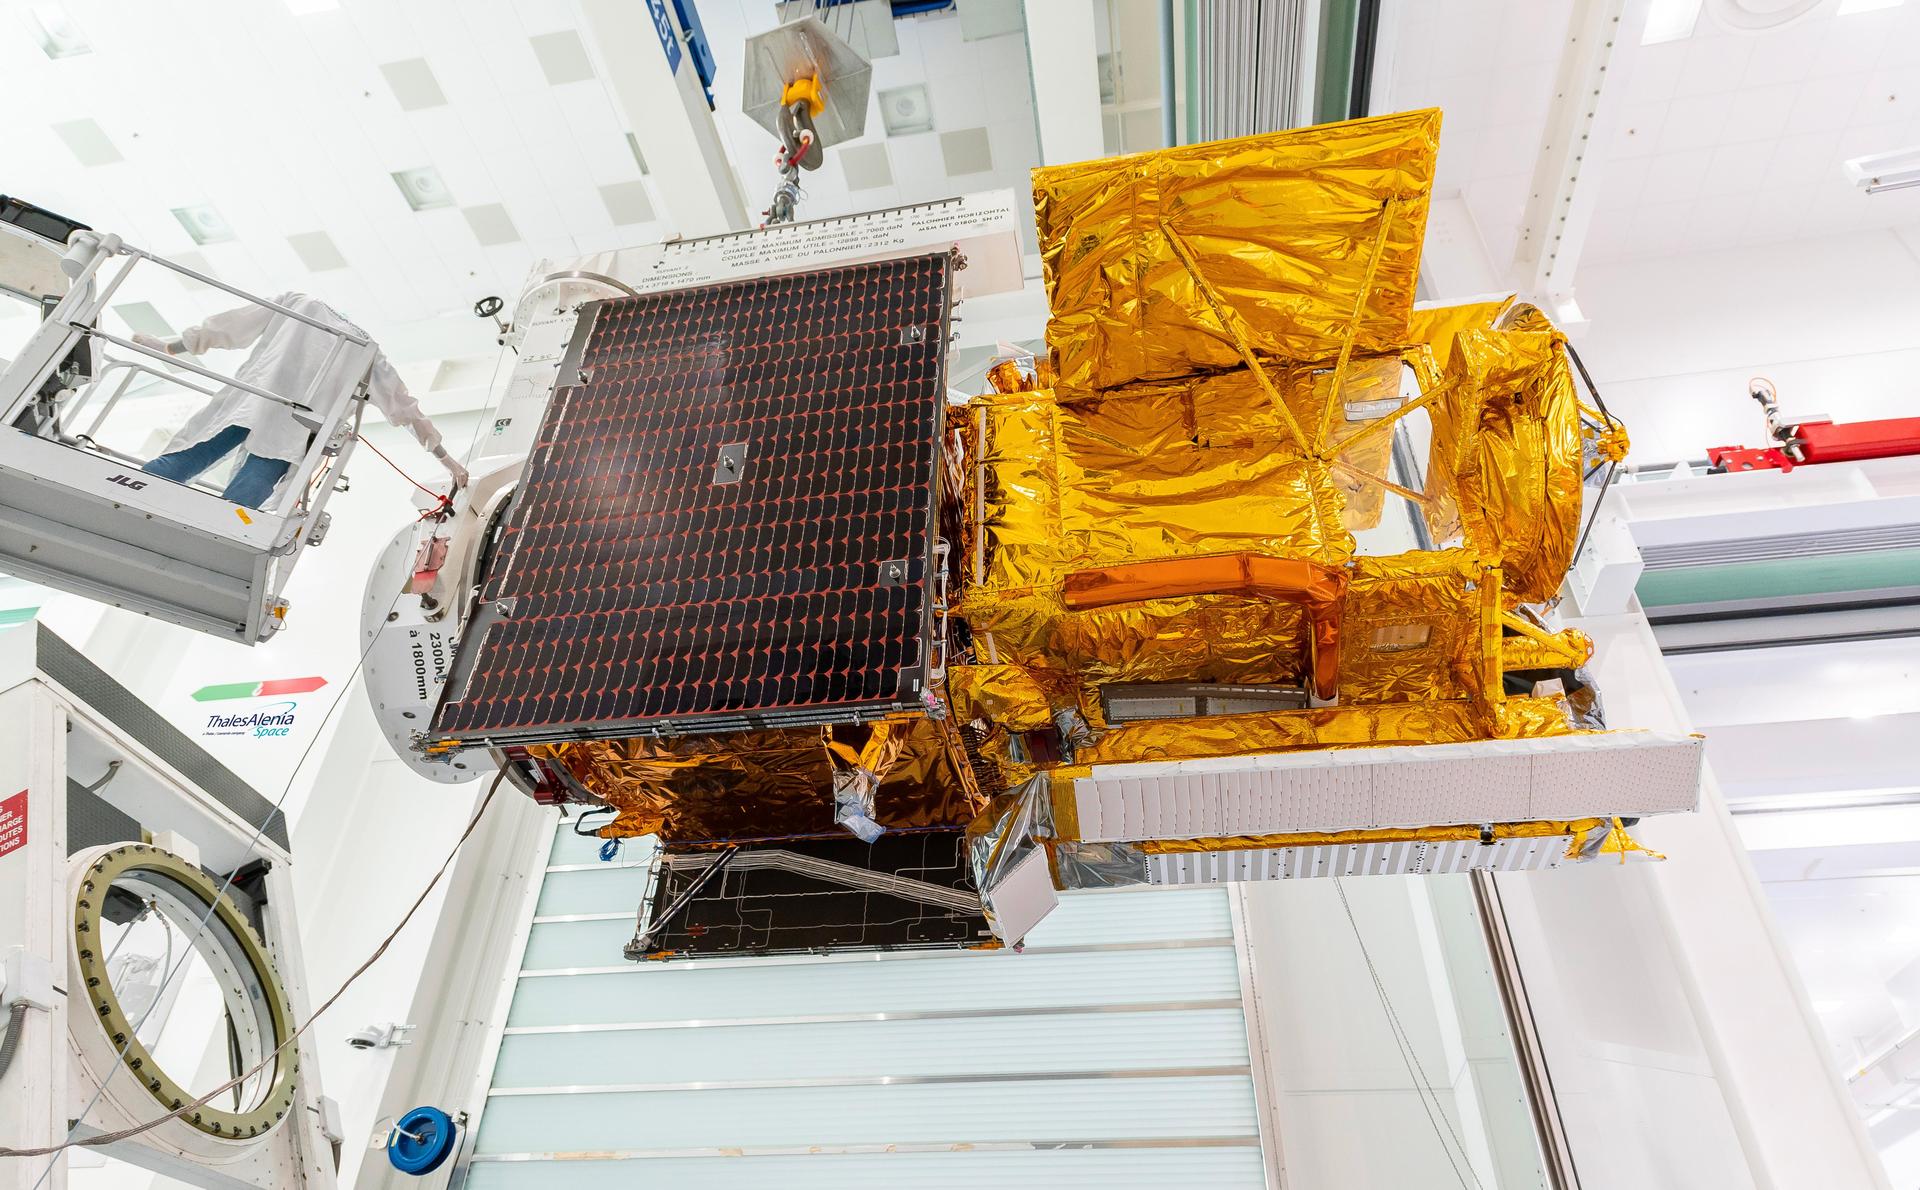
The international partnership between the United States, the European Space Agency (ESA), and the French Space Agency [Centre National d’Études Spatiales (CNES)] collaborate to create the ESA’s Copernicus Sentinel–6 missions. The Sentinel-6B, launched November 16, 2025, will follow the path of the Sentinel-6 Michael Freilich (originally called Sentinel–6A) satellite, which has been in orbit for five years – see Figure 8. These two Sentinel 6 missions continue the global measurements of sea level, wind speed, wave height, and atmospheric temperature. The data will be used in marine weather forecasts as well as to improve commercial and naval navigation, search and rescue missions, and tracking garbage and pollutants in the ocean. To learn more about Sentinel-6B, see the online article, Sentinel-6B Extends Global Ocean Height Record, published December 22, 2025.
While the Surface Water and Ocean Topography (SWOT) mission is fully described in the next section – with emphasis placed on its novel surface water observation capabilities – it should be noted that SWOT is also an ocean topography mission that obtains data similar to TOPEX/Poseidon, Jason, and Sentinel-6 missions. These data will contribute to the long-term time series of the sea surface height record.
Sampling the Salty Seas
Launched June 2011, Aquarius was an international collaboration between NASA and Argentina’s Comisión Nacional de Actividades Espaciales (CONAE). The cooperative effort was detailed in the article, Aquarius: A Brief (Recent) History of an International Effort [July–Aug. 2010, 22:4, 4–5]. The satellite carried a microwave radiometer that was sensitive enough to measure salinity to an accuracy of 0.2 practical salinity units (psu) on a monthly basis. It also carried a scatterometer to measure surface ocean roughness. Pairing data from the two instruments allowed the team to overcome the challenges of measuring salinity from space. This feat is detailed in the article, For Aquarius, Sampling Seas No ‘Grain of Salt’ Task [July–Aug. 2011, 23:4, 42–43]. The more accurate, global measurements of ocean salinity that Aquarius obtained have helped the research community better understand ocean circulation. The mission ended in 2015, after the satellite experienced a power failure.
Focusing on Freshwater
While most water on the planet is housed in the ocean, fresh water is a primary concern for life on the planet. Fresh water accounts for ~3% of the total amount water on the planet. Of that small amount, a significant portion is locked in ice on land and as sea ice. The remaining water flows on the surface of Earth and underground. Maintaining a supply of fresh water is critically important to our survival. The location, status, and purity of this precious resource continues to be an on-going focus for many of the missions.
Monitoring Rain and Snow
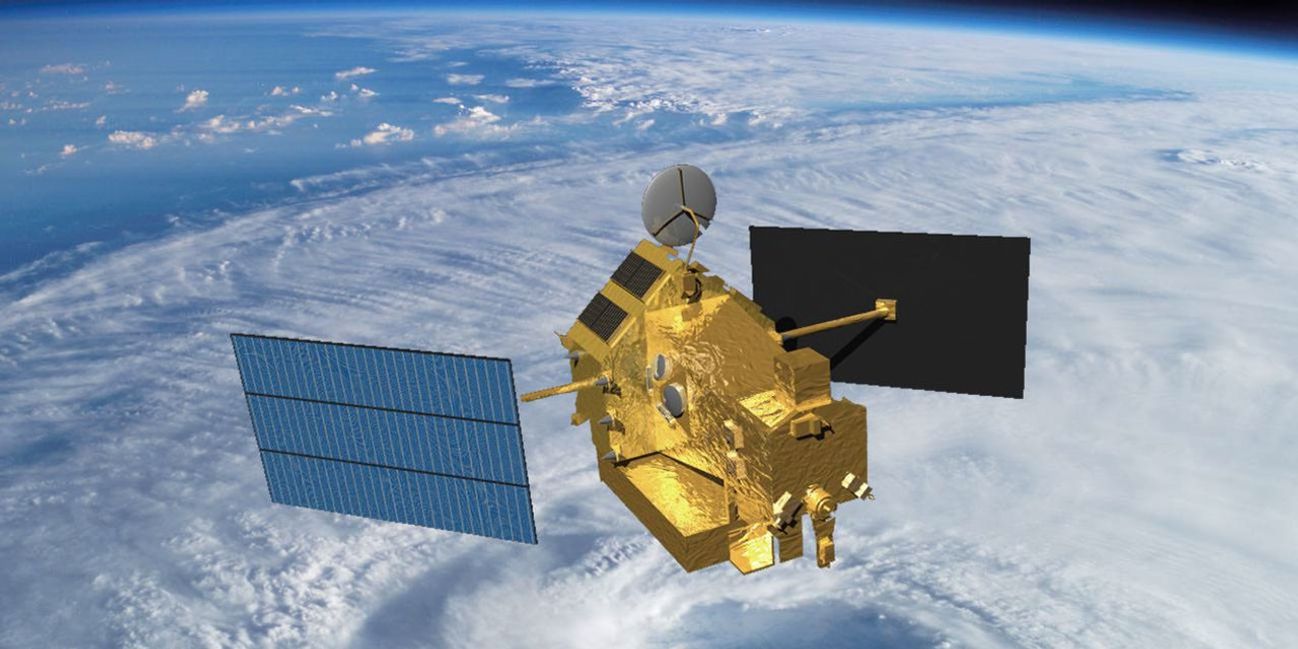
The joint NASA/NASDA (now JAXA) Tropical Rainfall Measuring Mission (TRMM) carried a Microwave Imager, Visible Infrared Scanner, and Precipitation Radar to gather tropical and subtropical rainfall observations (and two related instruments) – see Figure 9. These data filled a critical knowledge gap – to understand the interactions between the sea, air, and land. Over the years, these data were incorporated into numerous computer models to clarify the role of tropical rainfall on global circulation and formed the basis for experimental quasi-global merged satellite precipitation products. The Earth Observer detailed the early data collection in the article titled TRMMing the Uncertainties: Preliminary Data from the Tropical Rainfall Measuring Mission [May–June 1998, 10:3, 48–50]. The mission was extended twice but eventually the satellite’s maneuvering fuel was exhausted, resulting in a slow decline in the orbital altitude beginning in 2014, with reentry in 2015. Data from TRMM have improved understanding of storm structure of cloud systems, produced reliable global latent heating estimates to improve water transfer estimates within the atmosphere, and are still used in calibrating modern precipitation products for the TRMM era.
To continue the efforts that began with TRMM – and extend coverage to most of the globe – NASA and the Japan Aerospace Exploration Agency (JAXA) launched the Global Precipitation Measurement (GPM) mission in 2014. This satellite aims to advance our understanding of water and energy cycles, improve forecasting of extreme weather events, and extend current capabilities to use accurate and timely information of precipitation to directly benefit society. The Earth Observer detailed the accomplishments of this mission in the online article, GPM Celebrates Ten Years of Observing Precipitation for Science and Society, published October 3, 2024.
Surveying Earth’s Surface Water
Introduced briefly in the previous section, the SWOT mission is a joint venture between the United States and France. Launched in December 2022, SWOT is conducting the first global survey of Earth’s surface water – see Photo. The mission was introduced to the EOS community in The Earth Observer article, Summary of the 2022 Ocean Surface Topography Science Team Meeting [May–June 2023, 35:3, 19–23]. SWOT carries the Ka-band Radar Interferometer (KaRIN) – the first spaceborne, wide-swath, altimetry instrument capable of high-resolution measurements of sea surface height in the ocean and freshwater bodies. SWOT covers most of the world’s ocean and freshwater bodies with repeated high-resolution elevation measurements. This data have been applied to monitor rivers across the Amazon basin, simulate land/hydrology processes, and predict streamflow. A more comprehensive overview of SWOT applications is detailed in online article, Summary of the 10th SWOT Applications Workshop, published September 20, 2024.
Gracefully Tracking Water Movement
The twin GRACE satellites were launched on March 17, 2002. The mission, a partnership between NASA and the German GeoForschungsZentrum (GFZ) Helmholtz Centre for Geosciences was developed to measure Earth’s shifting masses – most of which comes from water – and map the planet’s gravitational field using a K-band microwave ranging system and accelerometers. Some early results of the satellites appeared in The Editor’s Corner column [Nov–Dec 2002, 14:6, 1–2]. GRACE enabled groundbreaking insights into Earth’s evolving water cycle as the satellites tracked monthly mass variations in ice sheets and glaciers, near-surface and underground water storage, the amount of water in large lakes and rivers, as well as changes in sea level and ocean currents.
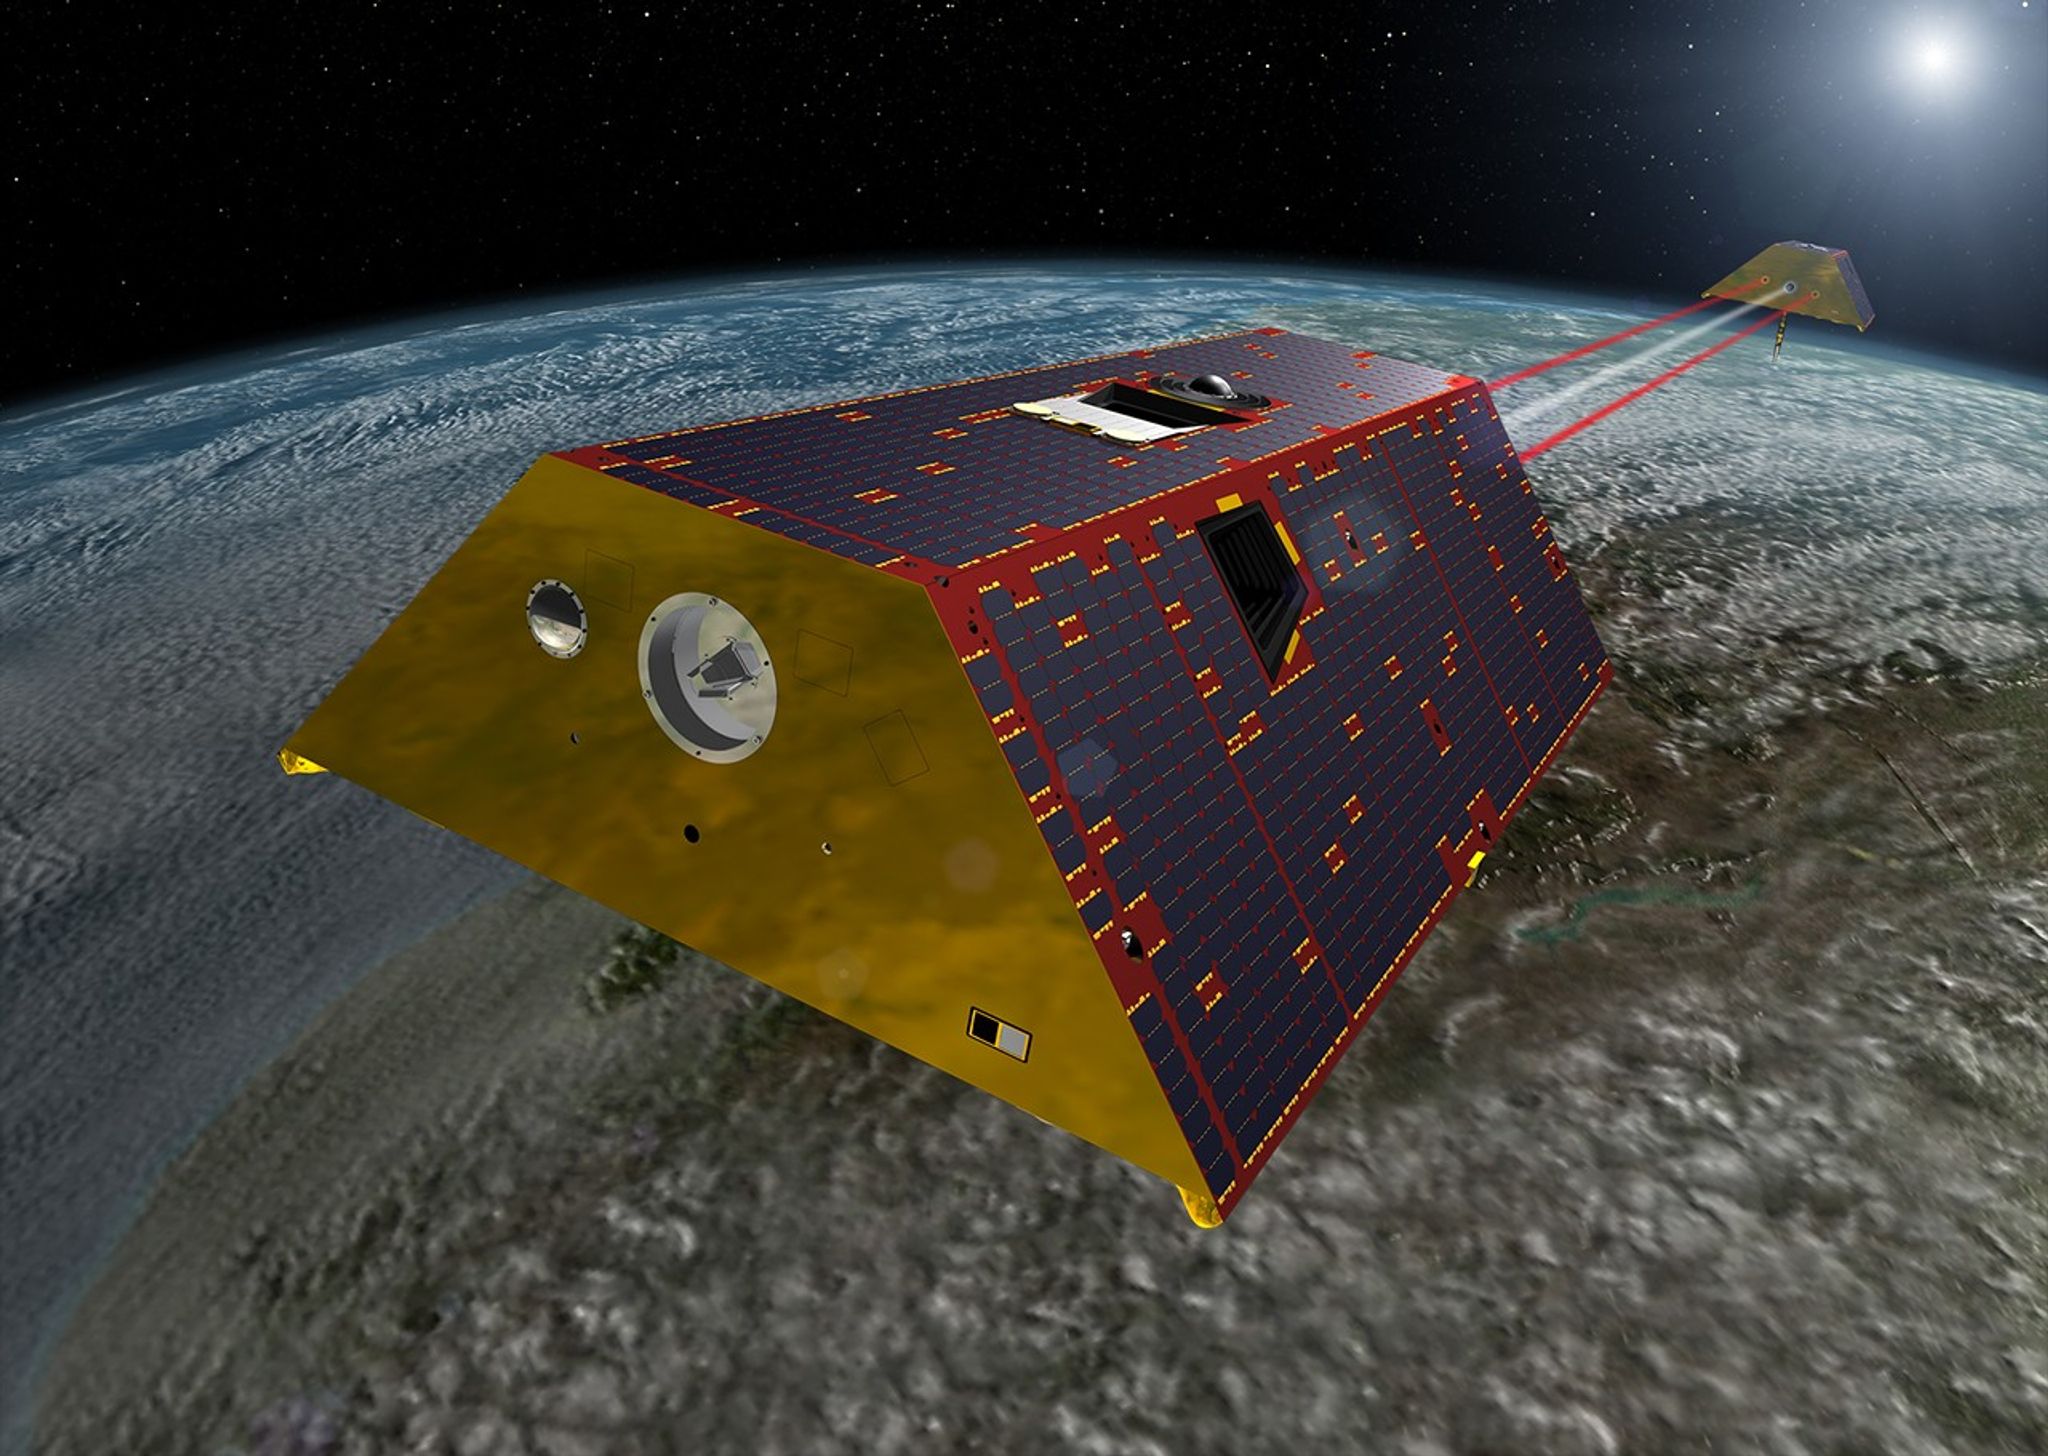
GRACE’s mission was extended with the GRACE-Follow On (GRACE-FO) mission launching in 2018 – see Figure 10. GRACE-FO continues comprehensive tracking water movement across the planet, including groundwater measurements that have important applications for everyday life. The most recent developments of the GRACE-FO science meeting was detailed in an online article, Summary of the 2023 GRACE Follow-On Science Team Meeting, published March 30, 2024 – and also published in the final print issue [Jan–Feb 2024, 35:7, 19–26]. The data gathered during the GRACE-FO mission detail large-scale changes in Earth’s groundwater reservoirs, Greenland and Antarctica’s sensitivity to warming ocean waters, and even subtle shifts deep in Earth’s interior that reveal how large earthquakes can develop.
In 2028, NASA will move into a third-generation of gavity observations with the launch of GRACE-Continuity, or GRACE-C, which will further expand the foundational observations of global mass change and expand the societal and economic applications that have been created from these data.
The twin Gravity Recovery and Climate Experiment (GRACE) satellites were launched on March 17, 2002. The mission, a partnership between NASA and the German Research Centre for Geosciences [GeoForschungsZentrum (GFZ)] was developed to measure Earth’s shifting water masses and map the planet’s gravitational field using a K-band microwave ranging system and accelerometers. Some early results of the satellites appeared in The Editor’s Corner column [Nov.–Dec. 2002, 14:6, 1–2]. GRACE would go on to play a critical role in enhancing data gathered by the Ice, Cloud, and land Elevation Satellite (ICESat) that launched shortly after GRACE in 2003 – and is described in more detail in an upcoming section.
The GRACE mission was extended with the GRACE-Follow On (GRACE-FO) mission – see Figure 10. GRACE-FO continues tracking water movement across the planet, including groundwater, lakes, and rivers. The Earth Observer has reported on the activities of the GRACE/GRACE-FO Science Teams over the years. The most recent developments were detailed in the online article, Summary of the 2023 GRACE Follow-On Science Team Meeting, published March 30, 2024 – and also published in the final print issue [Jan.–Feb. 2024, 35:7, 19–26]. The data gathered during the GRACE-FO mission details subtle shifts in the mass of the lithosphere. This information allows the research community to detect shifts in mass of the crust to measure this deformation at the surface and deeper within the planet’s interior.
Assessing the Atmosphere from Above
Earth has a unique atmospheric makeup that maintains a stable temperature allowing life to thrive. As far as we know, our atmosphere is unique in the universe. Satellites provide an unparalleled perspective to study variability in the column of air extending from Earth’s surface. While Aura has a suite of instruments making a wide range of atmospheric chemistry measurements, other missions also measure the abundance and impact of atmospheric constituents that, while often invisible to the unaided eye, can have profound impacts on Earth’s air quality and climate. These data have also improved climate models and help the scientific community better understand how energy is emitted into space.
Tracking Tiny Particles with Big Impacts
France’s PARASOL mission was an original member of the international A-Train constellation from its launch in 2004 until it was deactivated in 2013. PARASOL sought to capture the radiative and microphysical properties of clouds and tiny atmospheric aerosol particles using a unique multiangle imaging POLDER polarimeter. Researchers gathered information on how aerosols affect the formation of precipitations and clouds, the movement of water around the planet, and the reflection and absorption of radiative energy that impact overall planetary climate. The satellite was deactivated in 2013 after nine years in service. Unfortunately, NASA’s Glory mission, which carried a multiangle polarimeter intended for operation in the A-Train, failed to separate from the Taurus rocket due to a fairing separation failure during its launch in 2011. POLDER was the only atmospheric polarimeter to fly in space until two (SPEXone and HARP2) launched as part of NASA’s PACE mission.
Cloud particles form when water vapor nucleates onto aerosols; changes in one can impact the other. After many years and conversations, it was decided to pair two NASA Earth System Science Pathfinder (ESSP) missions – CloudSat and CALIPSO – and fly them in coordination with each other and other afternoon satellites. By combining the two datasets, it was possible to explore cloud and aerosol processes. This information helped the community drill into the larger climate questions. The two satellites were launched on the same Delta-II rocket from Vandenberg Air Force Base in California on April 28, 2006. CloudSat used a 94 GHz cloud profiling radar that is 1000 times more sensitive than a typical weather radar, capable of distinguishing between cloud particles and precipitation. CALIPSO contained a Cloud-Aerosol Lidar with Orthogonal Polarization (CALIOP), Wide-Field Camera, and Imaging Infrared Radiometer to detect and distinguish between aerosol particles and cloud particles.
The Earth Observer captured the early data collection of the two satellites in the article, CloudSat and CALIPSO: A Long Journey to Launch…But What a Year It’s Been!! [May–June 2007, 19:3, 7–12]. The article, A Meaningful Pursuit of Sadows: Science Highlights from Ten Years of CloudSat and CALIPSO Observations [July–Aug. 2016, 28:2, 4–12] provided a review of the accomplishments of the missions after 10 years in orbit. CALIPSO and CloudSat were both deactivated in 2023 after 17 years of service.
An Oracle of High-Altitude Wisdom
The Stratospheric Aerosol and Gas Experiment (SAGE) has experienced several iterations, extending back nearly half a century. The initial SAGE mission launched on February 18, 1979, aboard the Applications Explorer Mission-B (AEM-B) to measure aerosols and important gases in the stratosphere. The satellite failed after three years in orbit. In 1984, SAGE II began collecting data on stratospheric O3, producing a stable record of this important greenhouse gas from 1984–2005. SAGE III was launched on Метеор-3М (SAGE III/M3M). The third-generation satellite produced an accurate measurement of the vertical structure of aerosols, O3, water vapor, and other important trace gasses in the upper troposphere and stratosphere. The satellite was terminated on March 6, 2006, following a power supply system failure, resulting in loss of communication with the satellite.
The Stratospheric Aerosol and Gas Experiment (SAGE) has experienced several iterations, extending back nearly half a century. The initial SAGE mission launched on February 18, 1979, aboard the Applications Explorer Mission-B (AEM-B) to measure vertical distribution of aerosols and important gases in the upper troposphere and stratosphere (UTS). The satellite failed after three years in orbit. In 1984, SAGE II began collecting data on stratospheric O3, producing a stable record of this important greenhouse gas from 1984–2005. SAGE III was launched on Метеор-3М (SAGE III/M3M). The third-generation satellite produced an accurate measurement of the vertical structure of aerosols, O3, water vapor, and other important trace gasses in the upper troposphere and stratosphere. The satellite was terminated on March 6, 2006, following a power supply system failure, resulting in loss of communication with the satellite.
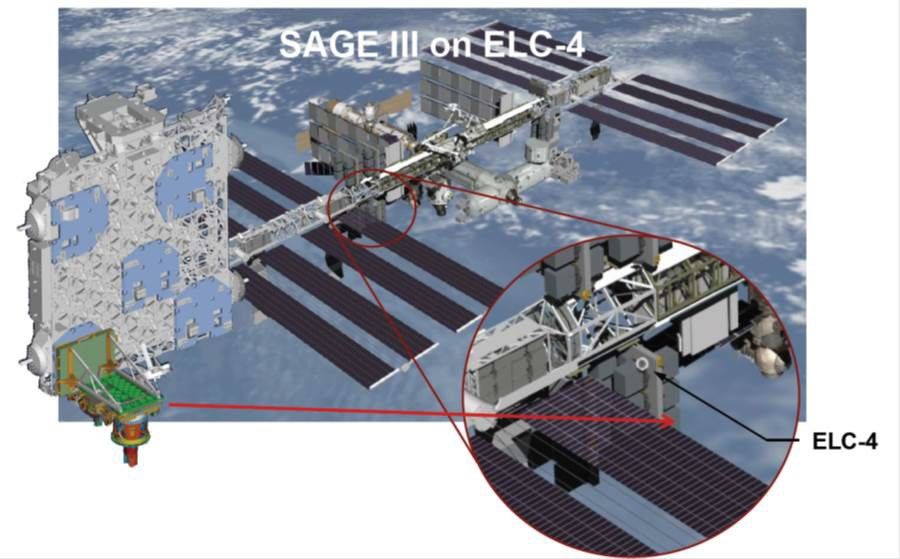
Another version of SAGE III was launched to the International Space Station (ISS) on February 19, 2017, where it was installed on the EXpedite the PRocessing of Experiments to Space Station (ExPRESS) Logistics Carrier [ELC-4] – an unpressurized attached payload platform for ISS. SAGE III/ISS, which is shown mounted on ELC-4 in Figure 11, has completed its prime mission after three years of operation. NASA granted approval to extend the SAGE III/ISS mission through at least 2026 – meaning the instrument will continue to provide the public and science community with world-class vertical profiles of O3, aerosol, water vapor, and other trace gases such as nitrogen dioxide (NO2) and nitrate (NO3) data products for at least another year. An article titled, Summary of the 2024 SAGE III/ISS Meeting, published May 26, 2025, details the latest findings from SAGE as reported at the annual meeting. This meeting highlighted the potential of using data from SAGE III/ISS to improve NASA’s model simulation of water vapor in the upper troposphere and stratosphere (UTS) after the decommissioning of Aura, the mission’s novel approach of using lunar occultation techniques to measure UTS profiles of aerosols and trace gases, and the uniqueness and robustness of the SAGE data record, which provides the longest and most accurate description of how UTS atmospheric composition has been changing since the late 1970s. Supported by American Geophysical Union (AGU), a special collection of papers is being compiled entitled, SAGE Data Products: Algorithms, Science, and Applications for Upper Troposphere and Stratosphere Studies, and is now being advertised across several AGU journals, inviting contributions from the community.
Watching Earth Exhale
The Orbiting Carbon Observatory (OCO) was launched into space in February 2009, but it failed to separate from the Taurus rocket during its ascent, leading to mission failure and loss of the satellite. Undaunted, the EOS community began again and assembled OCO-2, which was successfully launched into orbit, joining the A-Train on July 2, 2014 – see Figure 12. The satellite’s mission focused on making precise, high-resolution measurements of atmospheric CO2. OCO-2 measures reflected sunlight that interacts with the atmosphere. Using diffraction gratings to separate the reflected sunlight into spectra, OCO-2 measures the absorption levels for the different molecular bands to calculate CO2 concentration. This information is invaluable for the quantification of CO2 emissions and can characterize both sources and sinks of this critical greenhouse gas. The mission was detailed in an article, titled Orbiting Carbon Observatory-2: Observing CO2 from Space [July–Aug. 2014, 26:4, 4–12].
On May 4, 2019, NASA launched the third iteration in the OCO group to the ISS. It was subsequently installed on the Japanese Experiment Module–Exposed Facility (JEM-EF). Constructed from parts left over from OCO-2, OCO-3 continues the mission of making CO2 measurements with a focus on daily variability. In particular, the measurements explore the role of plants and trees in the major tropical rain forests of South America, Africa, and Southeast Asia. As of today, both OCO-2 and OCO–3 remain operational and gathering data.
The science team reflected on both these missions in a recent article posted in the online article, A Tapestry of Tales: 10th Anniversary Reflections from NASA’S OCO-2 Mission, published August 12, 2025.
Tracking the Sun’s Output
In December 1999, NASA launched the Active Cavity Radiometer Irradiance Monitor Satellite (ACRIMSAT) satellite to extend the more than two-decade record of total solar irradiance (TSI). Scientists use this important measurement to quantify the solar energy input to the planet and thereby its interactions with Earth’s oceans, land masses, and atmosphere. It is also a critical component to understand variations of the planet’s climate. The Active Cavity Radiometer Irradiance Monitor 3 (ACRIM3) instrument onboard combines the best features of the ACRIM I (flown on the Solar Maximum Mission), ACRIM II (flown on the Upper Atmosphere Research Satellite), and SpaceLab-1ACRIM (flown on Space Shuttle Columbia, STS 9). ACRIM3 is paired with new electronics and package design. The Earth Observer captured the initial information from this mission in the article, The ACRIMSAT/ACRIM3 Experiment — Extending the Precision, Long-Term Total Solar Irradiance Climate Database [May–June 2001, 13:3, 14–17]. ACRIMSAT spent 14 years in orbit and ACRIM3 extended the TSI record to 36 years (i.e., building on measurements from previous ACRIM missions).
NASA continued its quest to observe the incident solar energy budget with the launch of the Solar Radiation and Climate Experiment (SORCE) in January 2003. SORCE focused on measuring solar radiation incident to the top of the Earth’s atmosphere. The Total Irradiance Monitor (TIM) onboard continued the TSI record that the ACRIM series of satellites established. In addition to TIM, the satellite carried a Spectral Irradiance Monitor (SIM), an Extreme Ultraviolet (XUV) Photometer System [XPS], and a stellar observation from the Solar Stellar Irradiance Comparison Experiment (SOLSTICE). The satellite has produced groundbreaking TSI and spectral solar irradiance (SSI) measurements – two key inputs for atmosphere and climate modeling.
Early results from SORCE are detailed in the article, The SORCE (SOlar Radiation and Climate Experiment) Satellite Successfully Launched [Jan.–Feb. 2003, 15:1, 16–19]. The article, The SORCE Mission Celebrates 10 Years [Jan.–Feb. 2013, 25:1, 3–13] details the most significant results from a decade of SORCE observations. Designed for a five-year mission, SORCE gathered data until 2020 albeit with a degradation of a battery power that began in 2008 and increasingly hindered data collection for the remainder of the mission. During its time in orbit, SORCE captured two of the Sun’s 11-year solar cycles and observed the solar cycle minimum in both 2008 and 2019. SORCE’s orbit will decay and re-enter Earth’s atmosphere in 2032.
To continue the crucial long-term TSI and the SSI record that SORCE originated, NASA launched the Total and Spectral Solar Irradiance Sensor (TSIS-1) to the ISS on December 15, 2017, which was installed on JEM-EF ELC-3. The satellite’s mission set out to measure the total amount of sunlight that falls on the planet’s surface – see Visualization 1. This data will clarify the distribution of different wavelengths of light. TSIS-1 was introduced in The Earth Observer article, Summary of the 2018 Sun–Climate Symposium [May–June 2018, 30:3, 21–27]. Similar to SORCE, TSIS-1 carries a TIM and SIM. The instrument extends the multidecadal SSI record and provides highly accurate, stable, and continuous observations that are critical to understanding the present climate conditions and predicting future conditions. The most recent efforts from this mission were detailed in the online article, Summary of the 2023 Sun–Climate Symposium, published July 18, 2024. TSIS-1 has been extended by at least three more years as part of the Earth Sciences Senior Review process. A follow-on mission, TSIS-2, is under development to extend the long-term observational record through continued TSI and SSI measurements.
Visualization credit: NASA
Chronicling the Changing Land Surface
Along with Terra, other satellites also provide global estimates about the land. Each new mission provides the scientific community more information to refine these measurements. These data have improved climate models as well as improved our understanding of how the planet’s interior is altering the surface of the planet.
Measuring Ice and Vegetation Heights
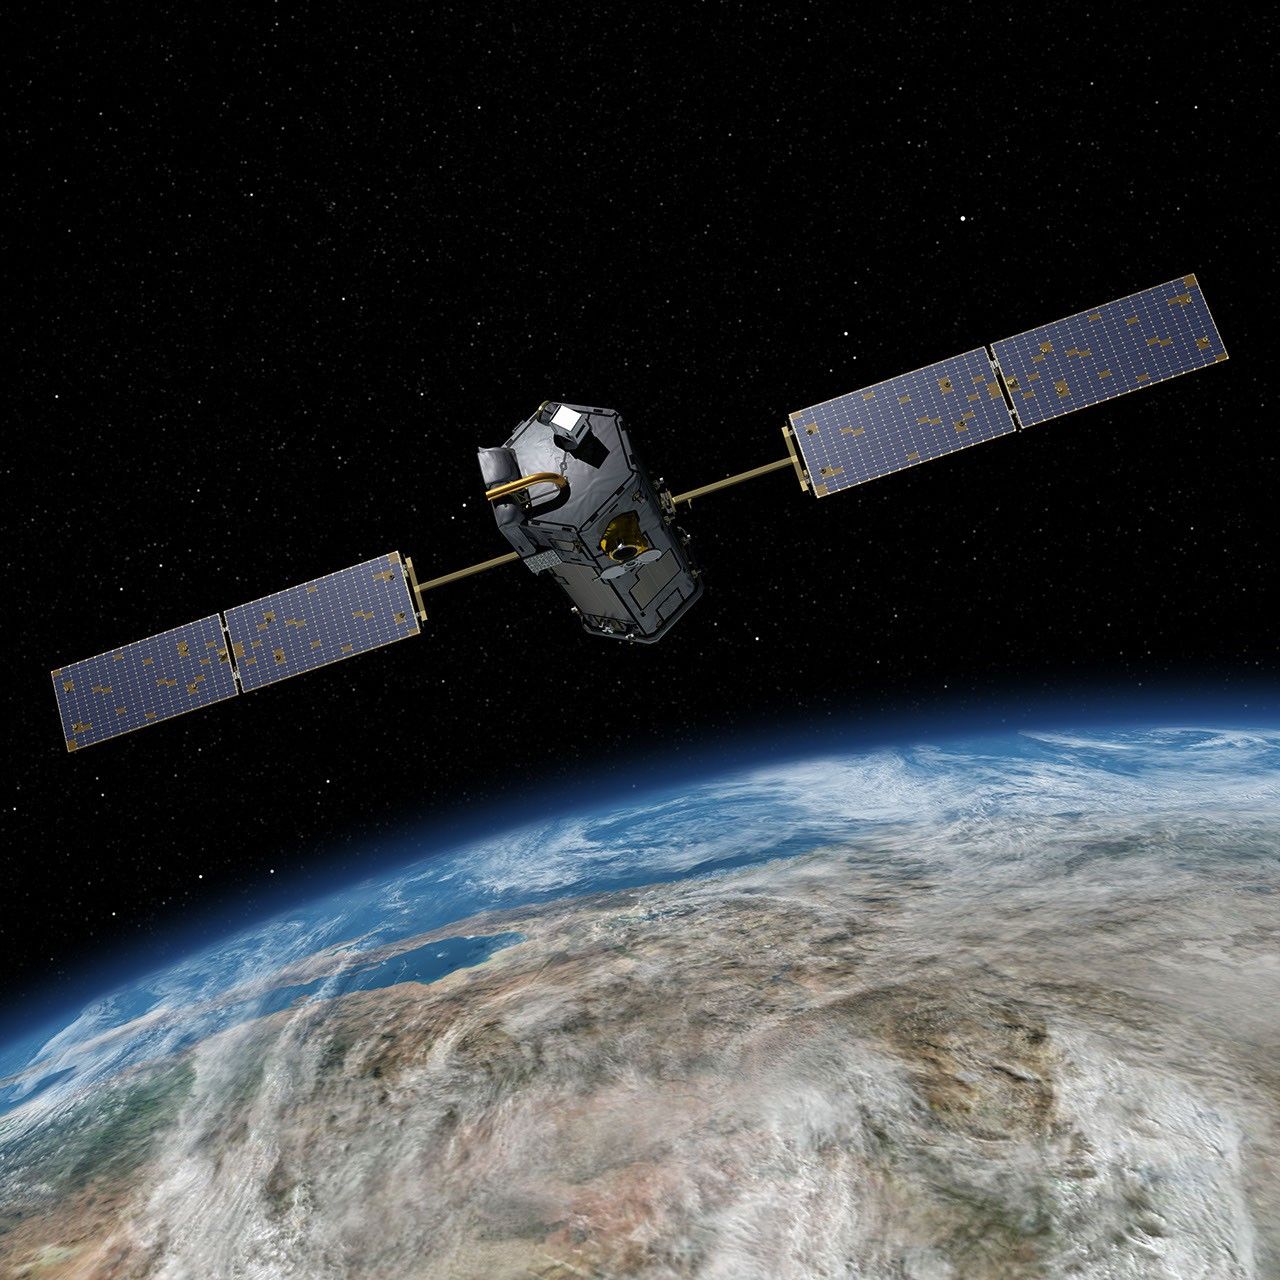
NASA launched ICESat in 2003 on a three-to-five-year mission to provide information on ice sheet mass balance and cloud properties. It carried the Geoscience Laser Altimeter System (GLAS), which combines a precision surface lidar with a sensitive dual-wavelength cloud and aerosol lidar. ICESat was decommissioned seven years after launch. The science team began efforts for the follow-on mission, ICESat-2, which launched on September 15, 2018 – see Figure 13. Data collected during a series of Operation IceBridge field campaigns to the Arctic and Antarctic helped to fill the data gap between the two satellite missions – allowing for continuity of measurements. ICESat-2 carries a payload of a photon-counting laser altimeter on its three-year mission. The laser is split into six beams capable of measuring the elevation of the cryosphere, including ice sheets, glaciers, and sea ice, down to a fraction of an inch. The laser altimeter also gathers the height of ocean and land surfaces, including forests, snow, lakes, rivers, ocean waves, and urban areas. The mission objective includes quantifying polar ice sheet contribution to sea-level change, estimating sea-ice thickness, and measuring vegetation canopy height. The mission was detailed in The Earth Observer article, ICESat-2: Measuring the Height of Ice from Space [Sept.–Oct.. 2018, 30:5, 4–10]. The research community has been using this information to investigate how the ice sheets of Antarctica and Greenland are changing as the planet warms.
NASA’s Global Ecosystem Dynamics Investigation (GEDI – pronounced “jedi”) mission was launched to the ISS on December 5, 2018 and was subsequently installed on the JEM–EF ELC-6. From that vantage point GEDI produces high-resolution laser ranging observations of the three-dimensional (3D) structure of Earth that can be used to make precise measurements of forest canopy height and canopy vertical structure – see Visualization 2. These measurements have improved understanding of important atmospheric and water cycling processes, biodiversity, and habitat. Upon completion of its prime mission, which lasted from December 2018 to March 2023, GEDI was moved from the ISS’s EFU-6 to EFU-7 (storage). Since April 2024, the GEDI instrument has been back in its original location on EFU-6 and continues to collect high-resolution observations of Earth’s 3D structure from space. The GEDI research team hopes the mission can continue collecting data until 2030.
The GEDI mission has been covered in The Earth Observer through summaries of periodic meetings of the GEDI Science Team. The online article, Summary of the 2025 GEDI Science Team Meeting, is the most recent installment of GEDI’s progress, published on August 18, 2025. This article includes discussion of “the return of the GEDI” from hibernation and the science results since then.
Monitoring Earth in Intricate Detail
The Soil Moisture Active Passive (SMAP) mission was designed to measure the amount of water in surface soil across Earth. The satellite was launched from Vandenberg Air Force Base on January 31, 2015. The satellite payload consisted of both an active microwave radar and a passive microwave radiometer to measure a swath of the planet 1000-km (~621-mi) wide. The radar transmitter failed just nine months after launch on July 7, 2015. Although the loss of the radar was unfortunate, the nine months where both instruments functioned provided an invaluable dataset that established the dependence of L-band radar signals on soil moisture, vegetative water content, and freeze–thaw state. Two of these variables (surface soil moisture and freeze–thaw state) are critical variables that influence the planet’s water, energy, and carbon cycles. The three variables influence weather and climate. Furthermore, the SMAP team quickly turned a setback into a success. They repurposed the channels that had been dedicated to the radar to record the reflected signals from the Global Navigation Satellite System (GNSS) constellation in August 2015, making SMAP the first full-polarimetric GNSS reflectometer in space for the investigation of land surface and cryosphere.
The Earth Observer article, SMAP: Mapping Soil Moisture and Freeze/Thaw State from Space [Jan.–Feb. 2015, 27:1, 14–19] offered a preview of SMAP that was published shortly after its launch. A more recent online article, A Decade of Global Water Cycle Monitoring: The Soil Moisture Active Passive Mission, published Aug. 18, 2025, reflects on the achievements of SMAP after a decade of operations.
More specific to vegetation water content, NASA launched the ECOsystem Spaceborne Thermal Radiometer Experiment on Space Station (ECOSTRESS) to ISS on June 29, 2018. It was subsequently installed on the JEM–EF ELC 10, placing it in close proximity to GEDI (installed on ELC 6) and enabling combined observations. While GEDI focuses on the canopy height and related characteristics, ECOSTRESS monitors the combined evaporation and transpiration of living plants – known as evapotranspiration (ET). ECOSTRESS determines ET indirectly through measurements of the thermal infrared brightness temperatures of plants and uses this information to derive their ET.
As with GEDI, The Earth Observer has reported on the activities of the ECOSTRESS mission. The most recent coverage was in the article, ECOSTRESS 2019 Workshop Summary: Science, Applications, and Hands-On Training [July–Aug. 2018, 31:4, 15–18.]
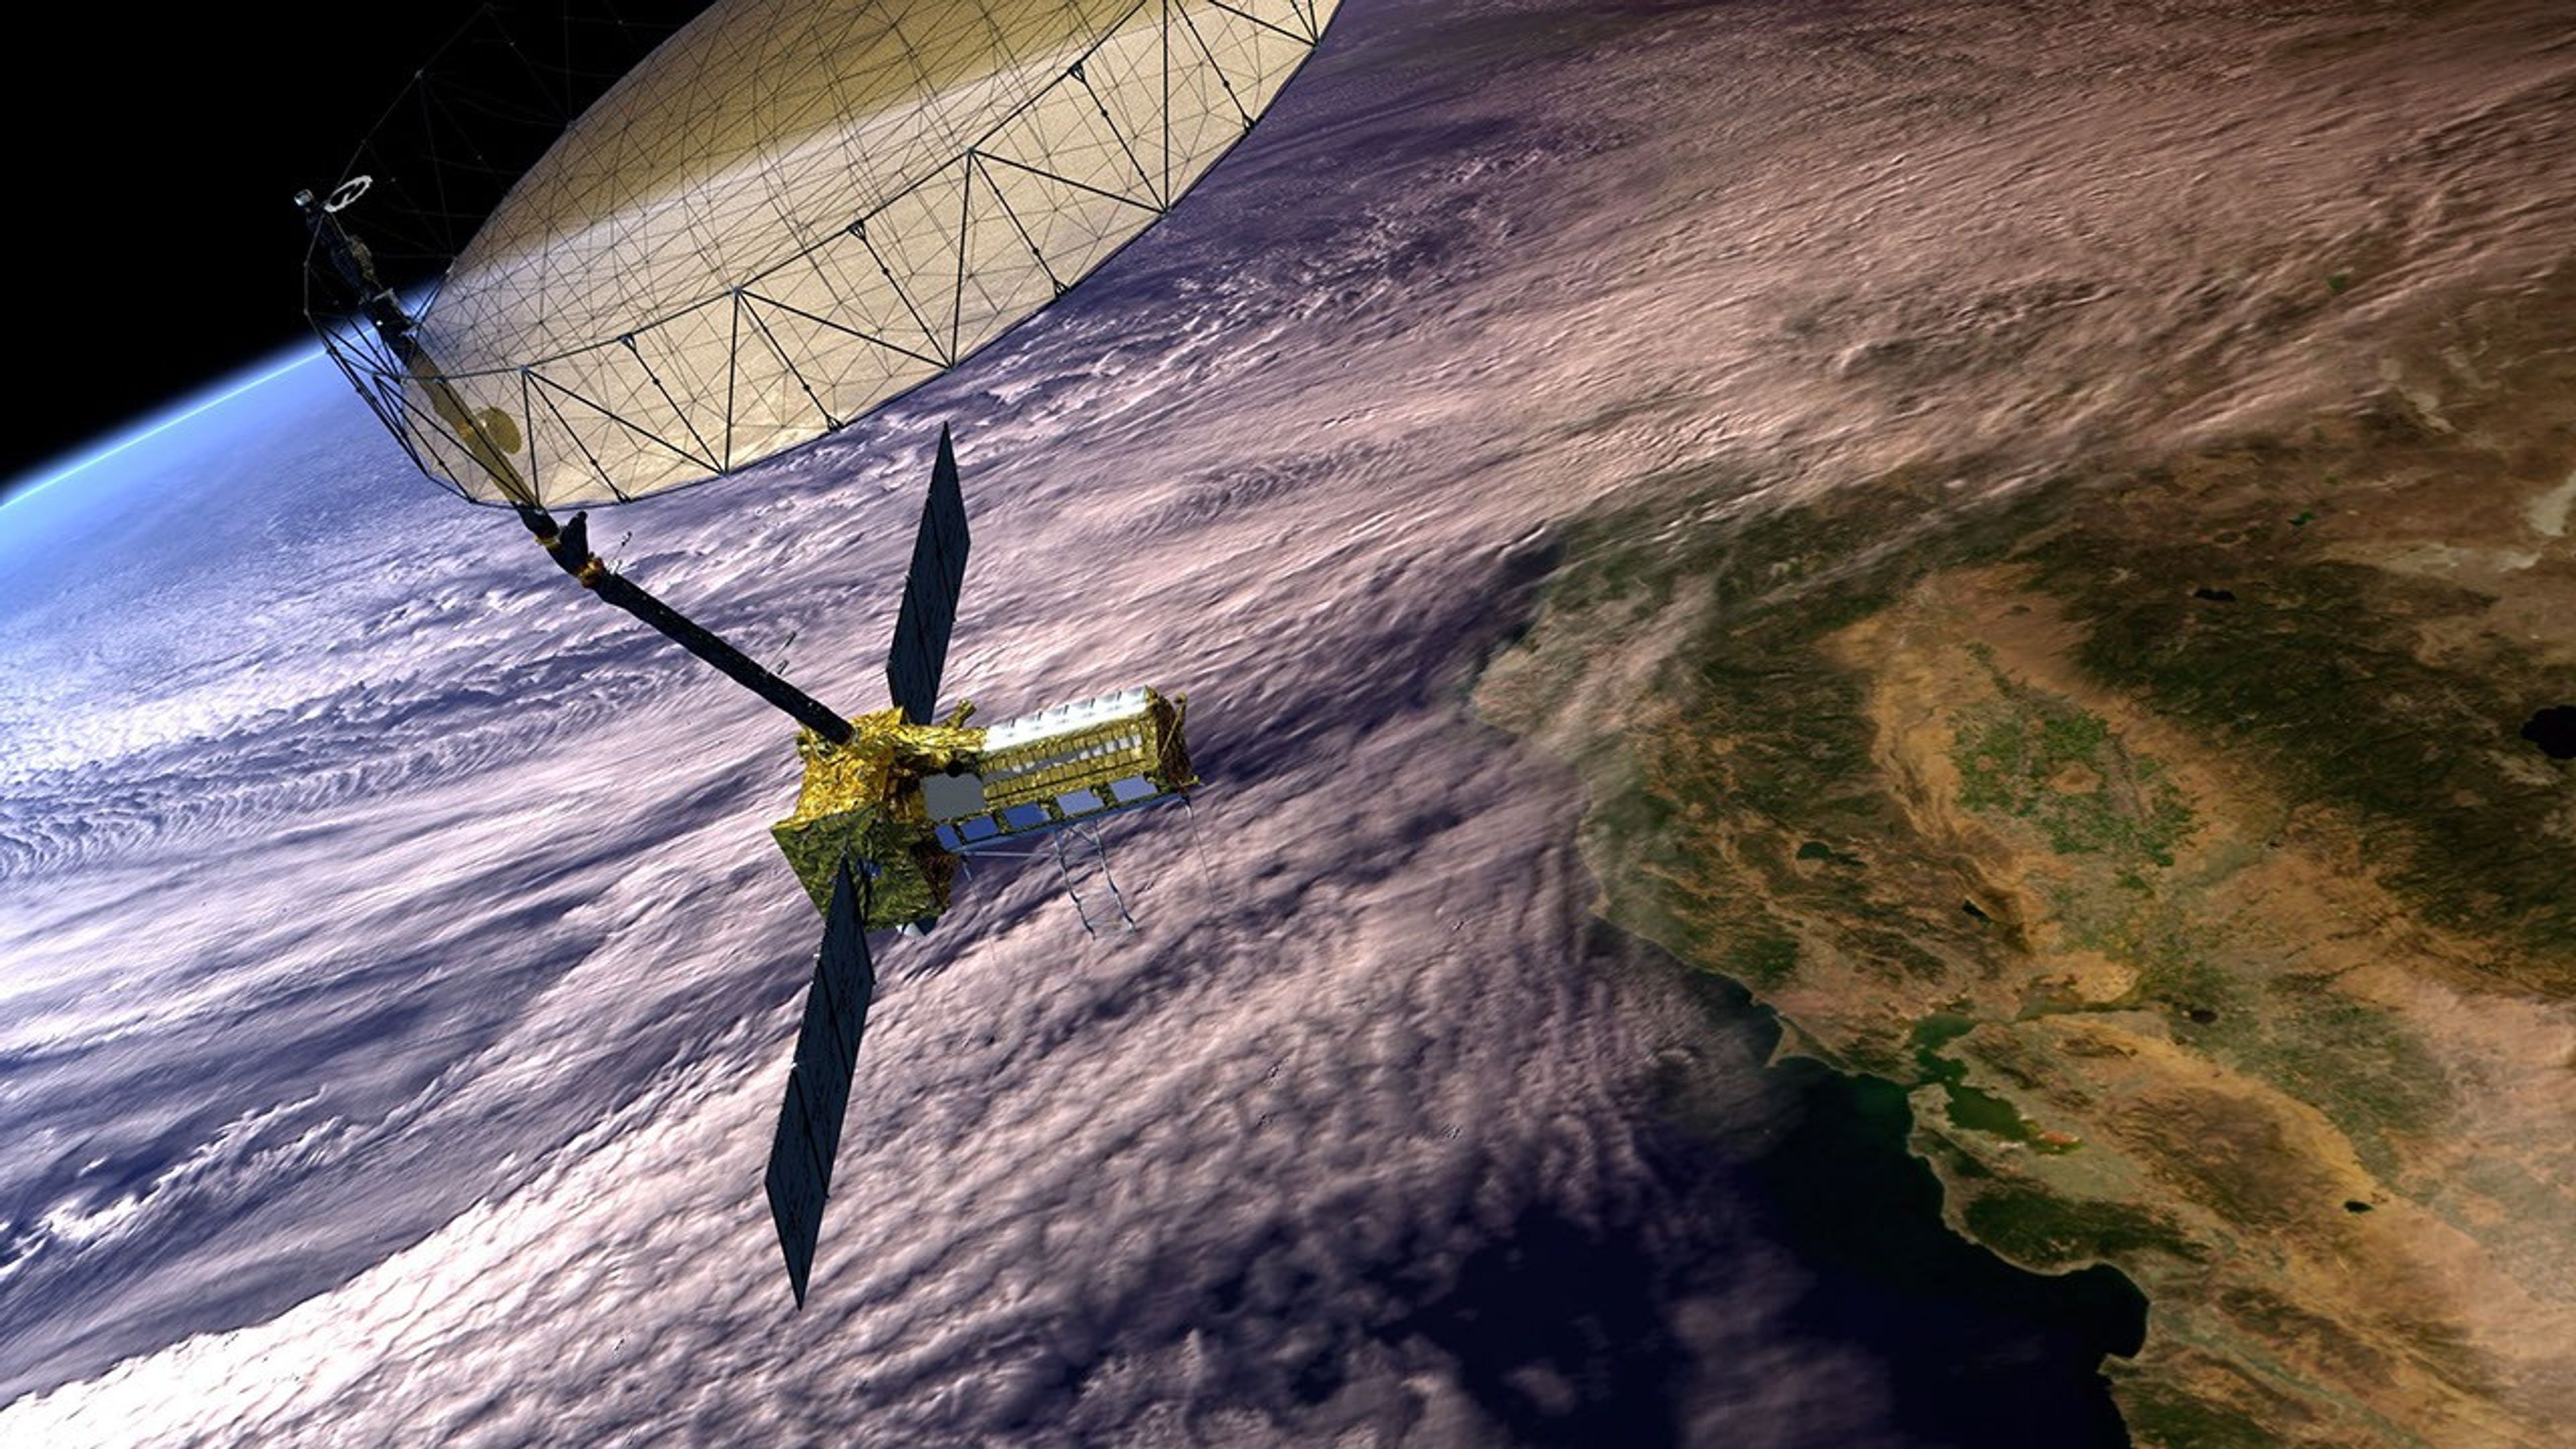
Last, but certainly not least, the most recent Earth observing satellite to launch is a joint venture between NASA and the Indian Space Research Organization (ISRO). The NASA-ISRO Synthetic Aperture Radar (NISAR) took to the skies on July 30, 2025, from the Satish Dhawan Space Centre on India’s southeastern coast aboard an ISRO Geosynchronous Satellite Launch Vehicle (GSLV) rocket 5. The mission was designed to observe and measure some of the planet’s most complex processes – see Figure 14. The launch was lauded in the Editor’s Corner published online on September 10, 2025.
NISAR uses two different radar frequencies – L-band and S-band synthetic aperture radar (SAR). The dual system can penetrate clouds and forest canopies to allow researchers to measure changes on the planet’s surface, down to a centimeter (~0.4 in). This level of detail allows the research community to investigate ecosystem disturbances, ice-sheet collapse, natural hazards, sea level rise, and groundwater issues. The satellite will also capture changes in forest and wetland ecosystems. It will expand on our understanding of deformation of the planetary crust that can help predict earthquakes, landslides, and volcanic activity. All of this data will help mitigate damage from a disaster and help communities prepare a disaster response.
Conclusion
Over the past 36 years, The Earth Observer has borne witness to some of the most monumental scientific achievements of NASA Earth Science and chronicled those stories for the community. While the format of the publication evolved considerably over the years, the satellite missions that have been the focus of this article are one of the primary “lenses” that the newsletter has had to observe and reflect on the story of NASA Earth Science. These continuous global observations have revolutionized society’s knowledge of our home planet and how humans might be altering it.
The staff of The Earth Observer have navigated many different modes of communication over the past three-and-a-half decades, but the commitment to delivering high-quality content has remained constant. It has been the highest honor of every member of our publication team – past and present – to work on this material. While the newsletter is coming to an end, it is hoped that the Archives page continues to be a rich source of historic information about NASA’s EOS and Earth science over the past three and a half decades.
On behalf of the current Editorial Team, we, the authors of this reflection, wish to thank every person who has contributed to the success of this newsletter over the years – and to extend to all in the NASA Earth Science community best wishes for the year ahead and continued success in your remote observation endeavors.
Stacy Kish
NASA’s Goddard Space Flight Center/EarthSpin
stacykishwrites@gmail.com
Alan B. Ward
NASA’s Goddard Space Flight Center/Global Science &Technology Inc.
alan.b.ward@nasa.gov
Share
Details
Related Terms


Related Posts
Stay Informed With the Latest & Most Important News
Previous Post
Next Post


Advertisement
-
 01Two Black Holes Observed Circling Each Other for the First Time
 -
 02From Polymerization-Enabled Folding and Assembly to Chemical Evolution: Key Processes for Emergence of Functional Polymers in the Origin of Life
 -
 03Astronomy 101: From the Sun and Moon to Wormholes and Warp Drive, Key Theories, Discoveries, and Facts about the Universe (The Adams 101 Series)
 -
 04True Anomaly hires former York Space executive as chief operating officer
 -
 05Φsat-2 begins science phase for AI Earth images
 -
 06Hurricane forecasters are losing 3 key satellites ahead of peak storm season − a meteorologist explains why it matters
 -
 07Binary star systems are complex astronomical objects − a new AI approach could pin down their properties quickly