
Now Reading: NASA satellite watches January’s polar vortex | Space photo of the day for Feb. 4, 2026
-
01
NASA satellite watches January’s polar vortex | Space photo of the day for Feb. 4, 2026

NASA satellite watches January’s polar vortex | Space photo of the day for Feb. 4, 2026
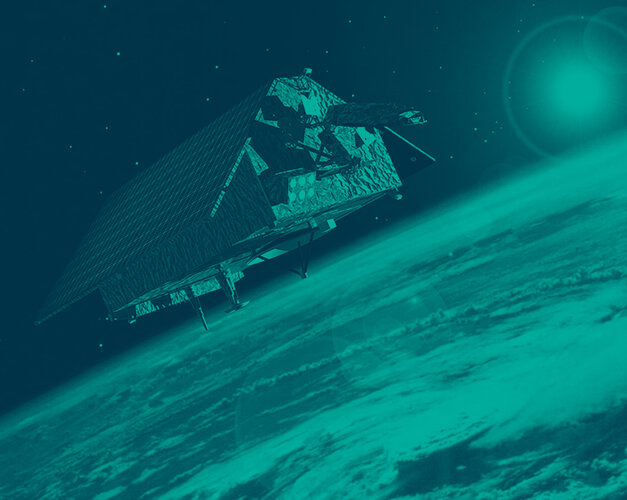
After a major winter storm swept across the country in late January, a prolonged surge of Arctic air tightened its grip on large areas of the U.S. pushing temperatures well below normal. From the Midwest to the South, the impacts of snow and ice became more extreme.
Even after the storm dispersed across the continent, the frigid chill remained. To understand the larger effects that winter storms like this one has, NASA used its Earth Observatory satellite observations, combined with temperatures calculated by the Goddard Earth Observing System (GEOS) global model, to map out the temperatures from the polar vortex.
What is it?
While the near-surface air temperatures, colder and bluer in color, had normal daily cycles of warming and cooling, the data showed a much larger, more unusual pattern. The cold air seemed to push south and east and then lingered for much of the week rather than retreating.
Meteorologists attributed the pattern to frigid Arctic air funneling into eastern North America and then being driven south as strong high-pressure systems helped force the jet stream into a pronounced dip, allowing colder air to spill into lower latitudes. The data was compiled into a video, showing the pattern over the week in January when the polar vortex occurred.
Where is it?
This image was created by satellite data looking across North America.

Why is it amazing?
Extreme winter storms can have significant impacts on recovery, especially for communities dealing with power outages and infrastructure damage. While snow and ice can be disruptive on their own, a prolonged exposure to cold can amplify the risk, increasing the odds of hypothermia and frostbite, straining shelters and hospitals and turning routine repairs into high-stakes operations.
When satellite observations are blended with modeling systems like in this instance, the result captures the shape and movement of the air mass across vast areas, filling gaps between weather stations and improving situational awareness for decision makers.
For emergency managers, utilities and transportation agencies, better maps of cold intensity, duration and spread can help prioritize better recovery and strategies.
Want to learn more?
You can learn more about Earth-scanning satellites and environmental science.


Related Posts
Stay Informed With the Latest & Most Important News
Previous Post
Next Post
Advertisement
-
 01Two Black Holes Observed Circling Each Other for the First Time
 -
 02From Polymerization-Enabled Folding and Assembly to Chemical Evolution: Key Processes for Emergence of Functional Polymers in the Origin of Life
 -
 03Astronomy 101: From the Sun and Moon to Wormholes and Warp Drive, Key Theories, Discoveries, and Facts about the Universe (The Adams 101 Series)
 -
 04True Anomaly hires former York Space executive as chief operating officer
 -
 05Φsat-2 begins science phase for AI Earth images
 -
 06Hurricane forecasters are losing 3 key satellites ahead of peak storm season − a meteorologist explains why it matters
 -
 07Binary star systems are complex astronomical objects − a new AI approach could pin down their properties quickly