
Now Reading: US-French Satellite Takes Stock of World’s River Water
-
01
US-French Satellite Takes Stock of World’s River Water

5 min read
Preparations for Next Moonwalk Simulations Underway (and Underwater)

Rivers rise and fall throughout the year, but by how much? Perhaps less than previously thought, according to new data from the SWOT mission. Hidden riverbed contours are also emerging.
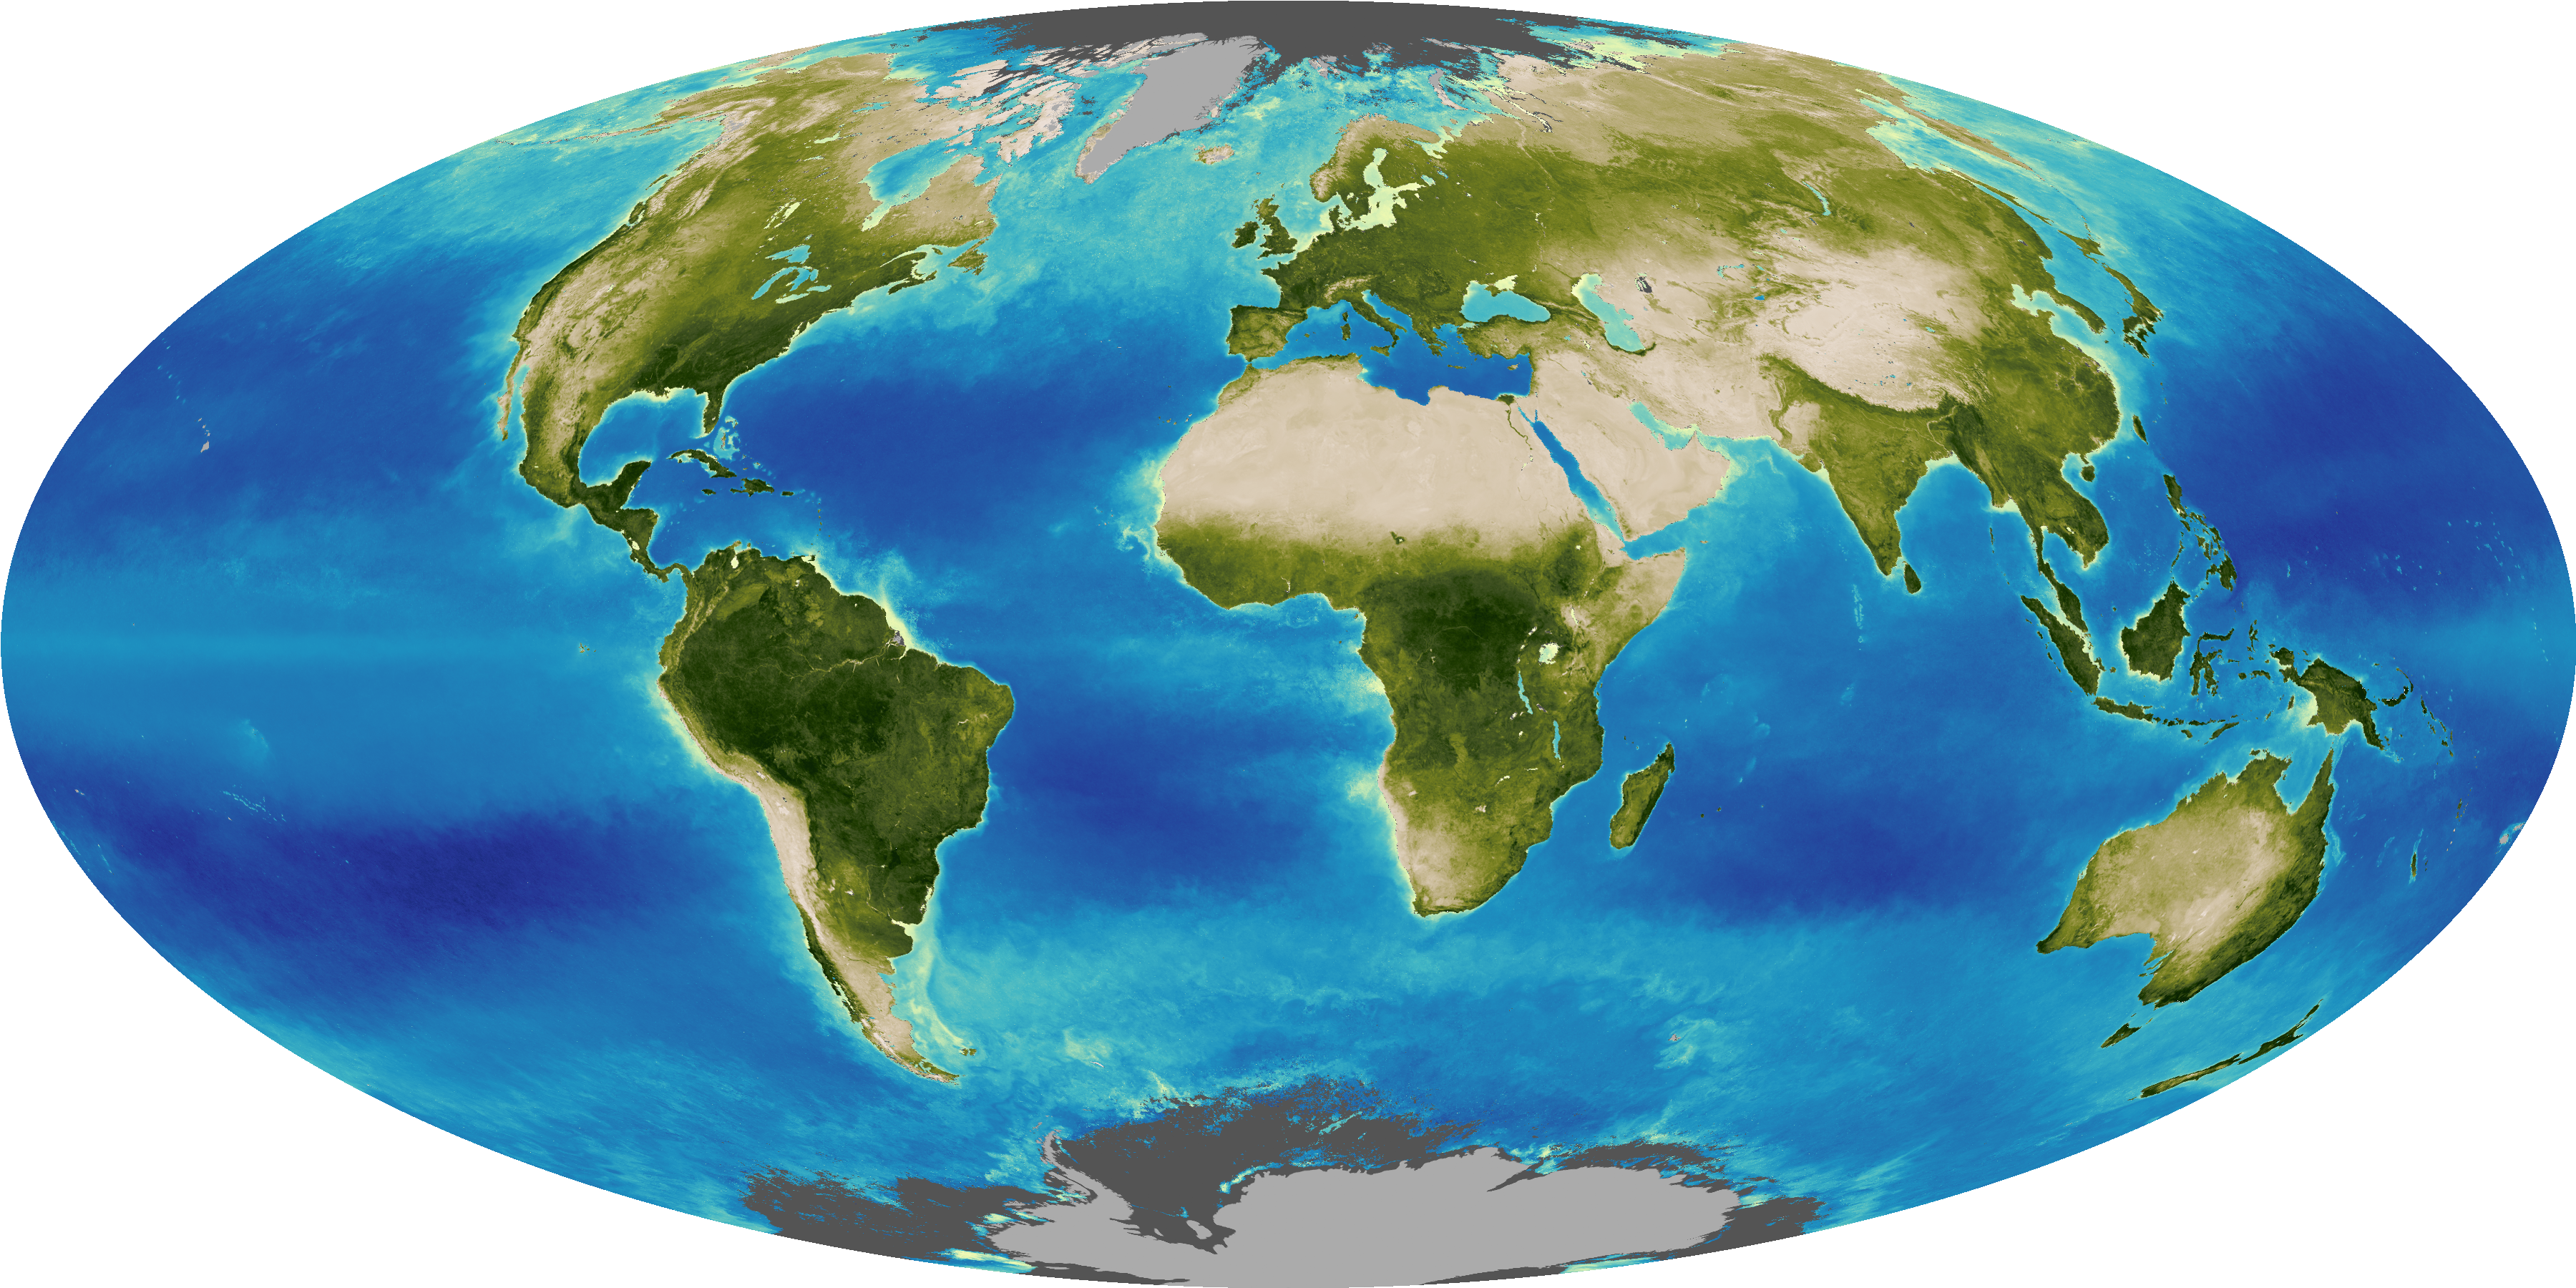
In a first, a space mission led by NASA and France has tracked Earth’s rivers swelling and shrinking from month to month over the course of a year and found significantly less of a swing than previous model-based estimates. A record drought in the Amazon likely influenced the tally made by the Surface Water and Ocean Topography (SWOT) satellite. The findings also reveal new details about the underwater topography of the world’s river channels.
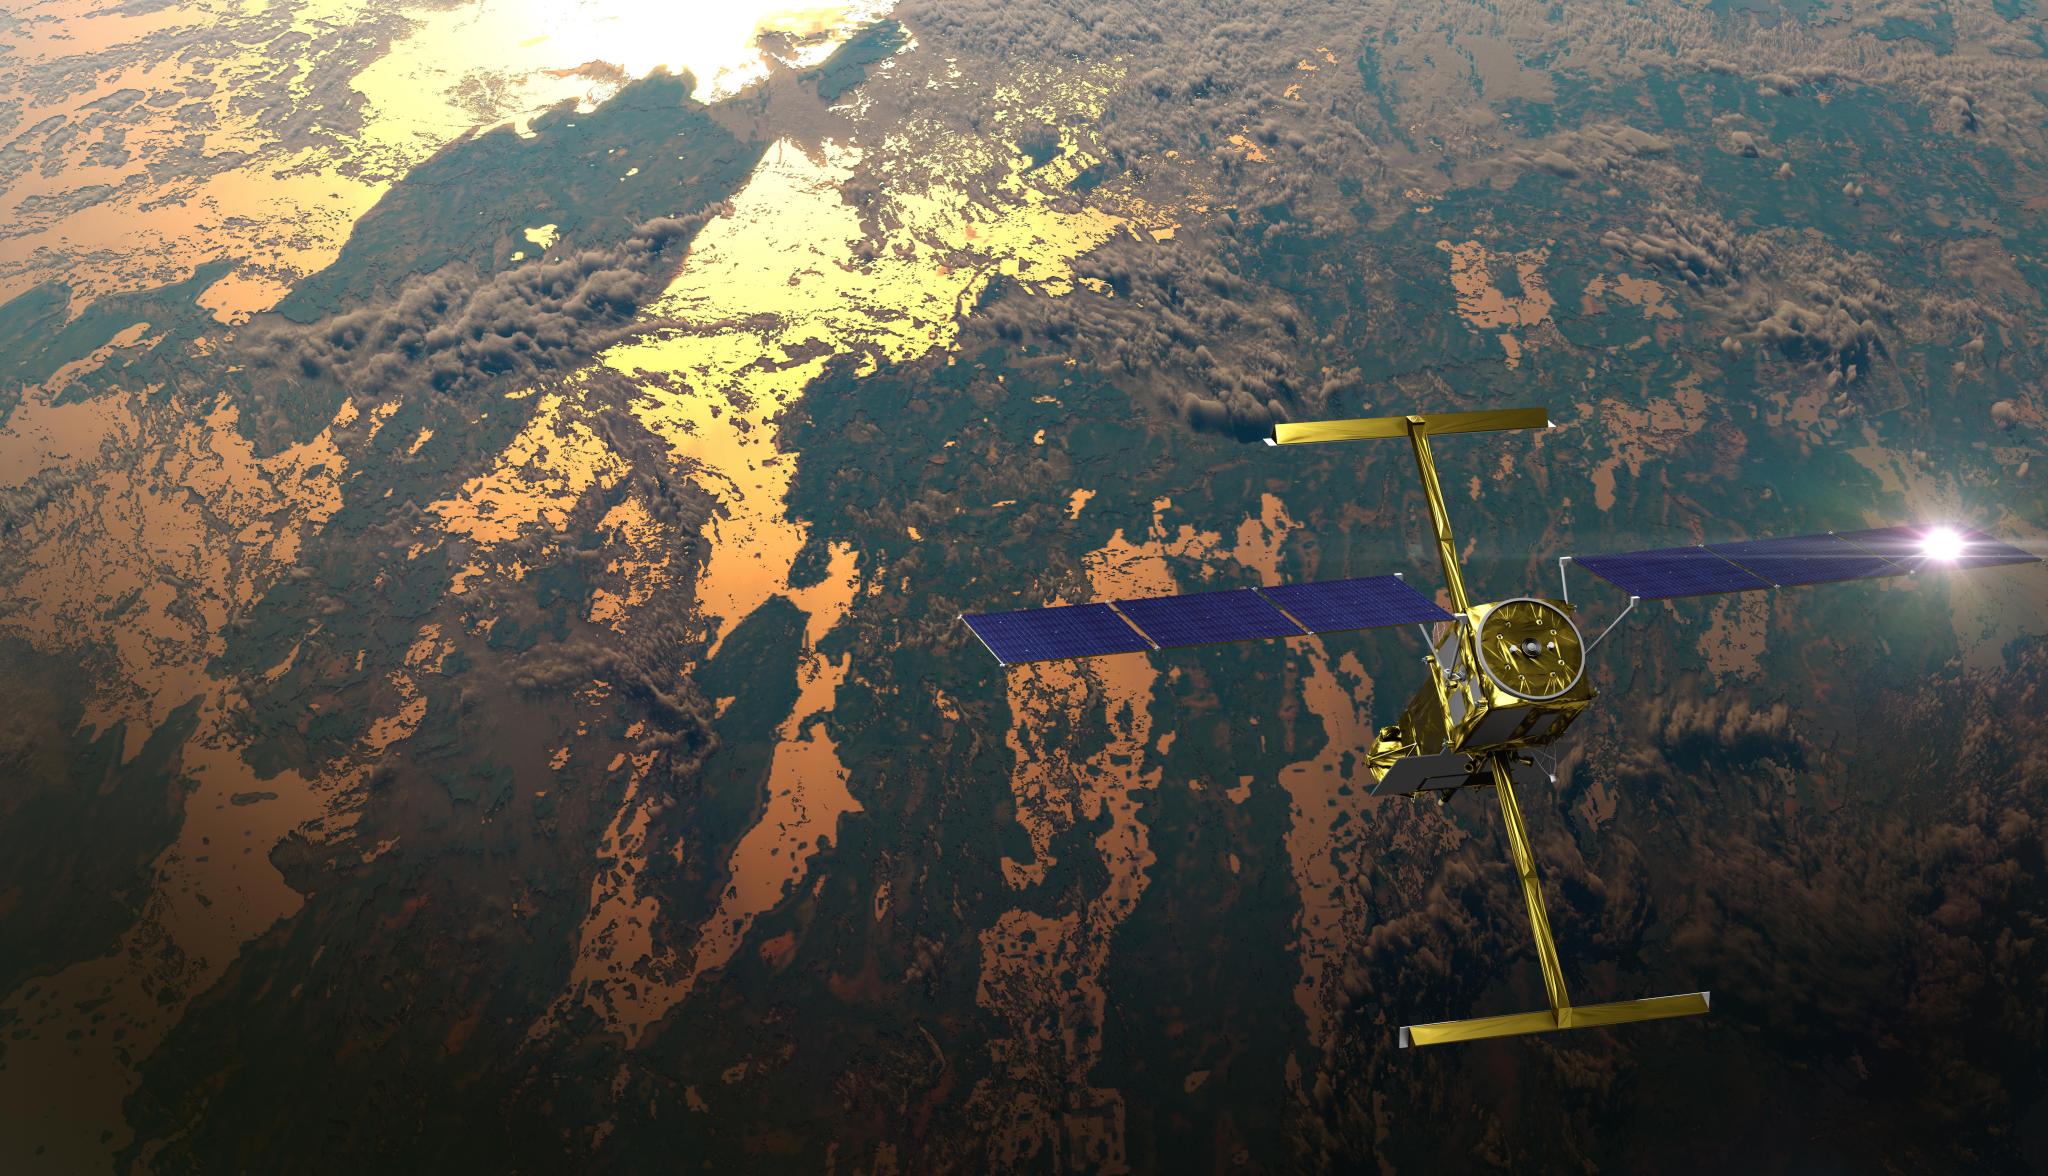
Launched in 2022, SWOT is a collaboration between NASA and the French space agency CNES (Centre National d’Études Spatiales). It is the first satellite capable of surveying not only the ocean, but also nearly all the world’s lakes and rivers with ultraprecision. While SWOT does not measure the absolute volume of rivers, it can track their width, surface height, and slope changing over time.
Traditionally, hydrologists have relied on models to calculate river storage changes, or they multiplied altimeter estimates of height by optical or radar estimates of width. In contrast, SWOT measures both dimensions, height and width, at the same time using its sensitive Ka-band Radar Interferometer (KaRIn) instrument to bounce microwaves off the water’s surface and time how long the signal takes to return. The new study, published Wednesday in Nature, analyzed nearly 1.6 million such observations.
The analysis paints a picture of some 127,000 river segments rising and falling between October 2023 and September 2024. In aggregate, river volumes varied by almost 83 trillion gallons (313 cubic kilometers). That’s about 28% less of a swing than the lowest previous estimates, a result likely skewed by extremely dry conditions during that period in the Amazon, home to Earth’s largest river by volume.
NASA’s Scientific Visualization Studio
New way to map river channels
Even gripped by drought, the Amazon River varied more than any other during the year, gaining and losing more than 45 trillion gallons (172 cubic kilometers) — enough to cover the entire state of California in more than a foot of water.
More surprisingly, the world’s longest river, the Nile, varied less than expected, with volumes changing by only 2.2 trillion gallons (8.5 cubic kilometers). Possible explanations include upstream damming and severe drought, along with challenges that come with learning to work with a new satellite instrument.
Cedric David, who leads the SWOT research team that conducted the work at NASA’s Jet Propulsion Laboratory in Southern California, said the findings are a first look and the role of large floodplain dynamics remain to be fully determined. Still, such an accounting has been elusive until now. River gauges are sparse in areas, and some channels too remote for boat and ground surveys. Longstanding questions, such as how fast do rivers flow and how much rainwater and snowmelt runs into them, have added to the uncertainty.
“We’re starting to untangle some of the really tough questions SWOT was built for,” David said. “This is just the beginning.”
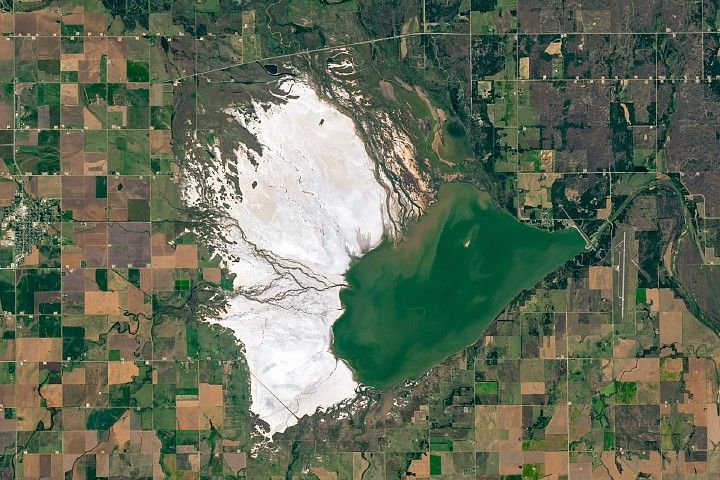
Tracking rivers as they swell and shrink is also helping scientists visualize something that can be challenging to survey in person: the underlying shape of riverbanks and beds. Such contours influence everything from shipping to flooding but have remained largely unmapped in many places, noted Arnaud Cerbelaud, a postdoctoral research fellow at JPL who co-led the study.
The new SWOT data provides a window into river channels ranging from concave to convex, steep to gentle, and stable to highly variable. In the Amazon, Mississippi, Orinoco, Yangtze, Ganges, Mekong and Yenisei rivers, for example, observed water levels vary by more than 32 feet (10 meters) from peak to trough.
“The implications go far beyond hydrology and will help us understand how water moves through the global Earth system,” Cerbelaud said.
More about SWOT
Launched in December 2022 from Vandenberg Space Force Base in California, SWOT is now in its operations phase, collecting data that will be used for research and other purposes.
The SWOT satellite was jointly developed by NASA and CNES, with contributions from the CSA (Canadian Space Agency), and the UK Space Agency. NASA’s Jet Propulsion Laboratory, managed for the agency by Caltech in Pasadena, California, leads the U.S. component of the project. For the flight system payload, NASA provided the KaRIn instrument, a GPS science receiver, a laser retroreflector, a two-beam microwave radiometer, and NASA instrument operations. NASA partners at CNES provided the Doppler Orbitography and Radioposition Integrated by Satellite system, the dual frequency Poseidon altimeter (developed by Thales Alenia Space), the KaRIn radio-frequency subsystem (together with Thales Alenia Space and with support from the UK Space Agency), the satellite platform, and ground operations. The KaRIn high-power transmitter assembly was provided by CSA. NASA provided the launch vehicle and the agency’s Launch Services Program, based at Kennedy Space Center in Florida, managed the associated launch services.
To learn more about SWOT, visit:
News Media Contacts
Andrew Wang / Andrew Good
Jet Propulsion Laboratory, Pasadena, Calif.
626-379-6874 / 818-393-2433
andrew.wang@jpl.nasa.gov / andrew.c.good@jpl.nasa.gov
Written by Sally Younger
2026-014
Share
Details
Related Terms
Explore More


Related Posts

Stay Informed With the Latest & Most Important News
Previous Post
Next Post


Advertisement
-
 01Two Black Holes Observed Circling Each Other for the First Time
 -
 02From Polymerization-Enabled Folding and Assembly to Chemical Evolution: Key Processes for Emergence of Functional Polymers in the Origin of Life
 -
 03Astronomy 101: From the Sun and Moon to Wormholes and Warp Drive, Key Theories, Discoveries, and Facts about the Universe (The Adams 101 Series)
 -
 04True Anomaly hires former York Space executive as chief operating officer
 -
 05Φsat-2 begins science phase for AI Earth images
 -
 06Hurricane forecasters are losing 3 key satellites ahead of peak storm season − a meteorologist explains why it matters
 -
 07Binary star systems are complex astronomical objects − a new AI approach could pin down their properties quickly