
Now Reading: First Detection of Molecular Activity in the Largest Known Oort Cloud Comet: ALMA Imaging of C/2014 UN271 (Bernardinelli-Bernstein) At 16.6 au From The Sun
-
01
First Detection of Molecular Activity in the Largest Known Oort Cloud Comet: ALMA Imaging of C/2014 UN271 (Bernardinelli-Bernstein) At 16.6 au From The Sun

First Detection of Molecular Activity in the Largest Known Oort Cloud Comet: ALMA Imaging of C/2014 UN271 (Bernardinelli-Bernstein) At 16.6 au From The Sun
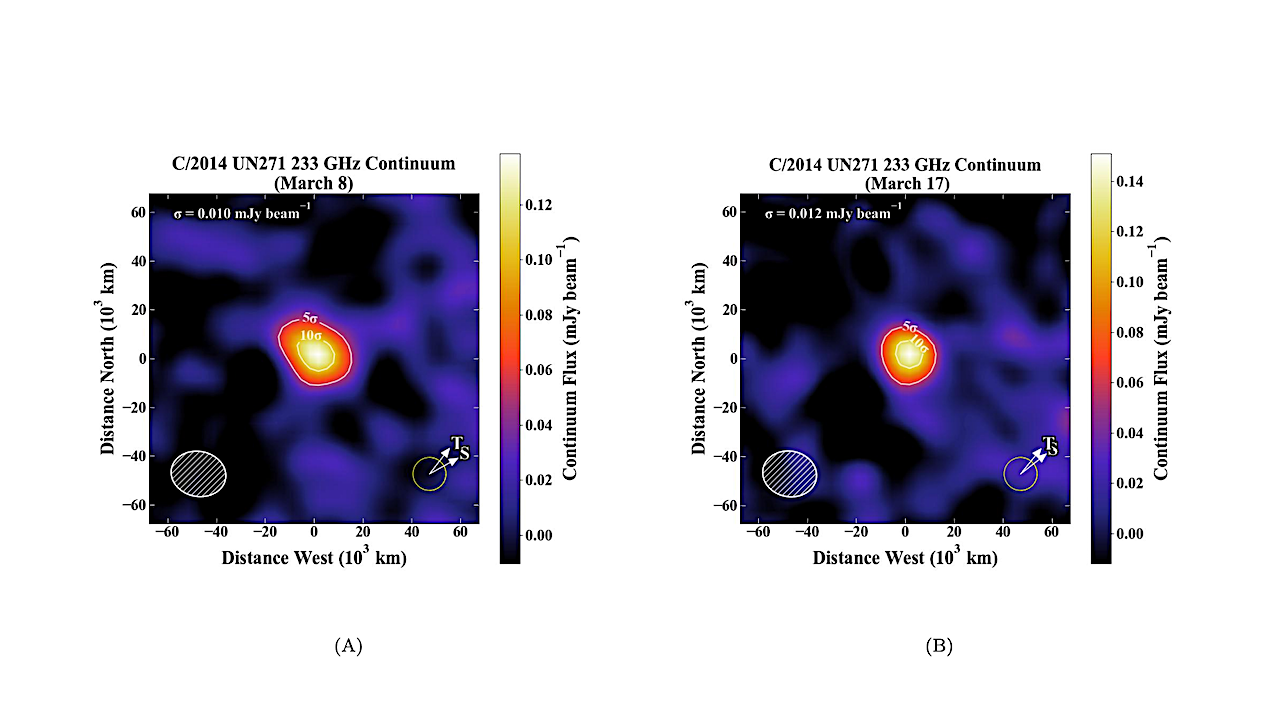

(A)–(B). Continuum flux maps for CO on 2024 March 8 and 17, with traces and labels as in Figure 1). Contour intervals in each map are in 5σ increments of the rms noise, with the lowest contour being 5σ. — astro-ph.EP
We report observations of comet C/2014 UN271 (Bernardinelli-Bernstein) carried out on UT 2024 March 8 and 17 at a heliocentric distance (rH) of 16.6 au using the Atacama Large Millimeter/Submillimeter Array (ALMA).
The CO (J=2-1) line at 230 GHz was detected along with continuum emission from its dust coma and large (∼140 km) nucleus, revealing the nature of the activity drivers and outgassing kinematics of the largest Oort cloud comet discovered to date.
This work presents spectrally integrated flux maps, autocorrelation spectra, production rates, and parent scale lengths for CO and a stringent upper limit for the H2CO production rate. CO outgassing displays multiple active jets which evolve from one epoch to the next. The continuum emission is compact and spatially unresolved, and is consistent with thermal emission from the large nucleus and a tentative detection of a dust coma.
Complementary optical observations provided activity context for the ALMA epochs, indicating that UN271 underwent an outburst in late February before returning to a quiescent brightness in mid–late March.
These results represent the first secure detection of molecular activity reported in the literature for C/2014 UN271 and highlight the dynamic nature of this distantly active small world.
IMAGE

(A)–(C). Spectrally integrated flux maps for CO on 2024 March 17, with traces and labels as in Figure 1. Contour intervals in each map are in 1σ increments of the rms noise, with the lowest contour being 3σ. Panel (A) is at the native angular resolution, whereas Panel (B) shows the same map with a 2′′ Gaussian uv-taper. (D). Comparison of autocorrelation and interferometric CO spectra on March 8 and 17. The solid blue, dashed red, and solid red vertical lines show correspond to speeds of -0.38 km s−1 , 0.066 km s−1 , and 0.021 km s−1 , respectively, highlighting the consistency of the blue CO component and variation in the red components. — astro-ph.EP
Nathan X. Roth, Stefanie N. Milam, Martin A. Cordiner, Dominique Bockelee-Morvan, Nicolas Biver, Michael S. P. Kelley, Anthony J. Remijan, Steven B. Charnley, Carrie E. Holt, Kiernan D. Foster, Joseph Chatelain, Edward Gomez, Sarah Greenstreet, Tim Lister, Helen Usher
Comments: Accepted for publication in The Astrophysical Journal Letters
Subjects: Earth and Planetary Astrophysics (astro-ph.EP)
Cite as: arXiv:2505.04767 [astro-ph.EP] (or arXiv:2505.04767v1 [astro-ph.EP] for this version)
https://doi.org/10.48550/arXiv.2505.04767
Focus to learn more
Submission history
From: Nathan Roth
[v1] Wed, 7 May 2025 19:45:19 UTC (1,636 KB)
https://arxiv.org/abs/2505.04767
Astrobiology, Astrochemistry,


Related Posts

Stay Informed With the Latest & Most Important News
Previous Post
Next Post


Advertisement
-
 01Two Black Holes Observed Circling Each Other for the First Time
 -
 02From Polymerization-Enabled Folding and Assembly to Chemical Evolution: Key Processes for Emergence of Functional Polymers in the Origin of Life
 -
 03Astronomy 101: From the Sun and Moon to Wormholes and Warp Drive, Key Theories, Discoveries, and Facts about the Universe (The Adams 101 Series)
 -
 04True Anomaly hires former York Space executive as chief operating officer
 -
 05Φsat-2 begins science phase for AI Earth images
 -
 06Hurricane forecasters are losing 3 key satellites ahead of peak storm season − a meteorologist explains why it matters
 -
 07Binary star systems are complex astronomical objects − a new AI approach could pin down their properties quickly