NASA ROSES-2026 — Astrobiology.com The Exoplanets Research Program (XRP), element F.3 of ROSES-25, solicits basic research proposals to conduct scientific investigations that significantly improve our understanding of exoplanets and exoplanet

NASA ROSES-2026 — Astrobiology.com The Exoplanets Research Program (XRP), element F.3 of ROSES-25, solicits basic research proposals to conduct scientific investigations that significantly improve our understanding of exoplanets and exoplanet
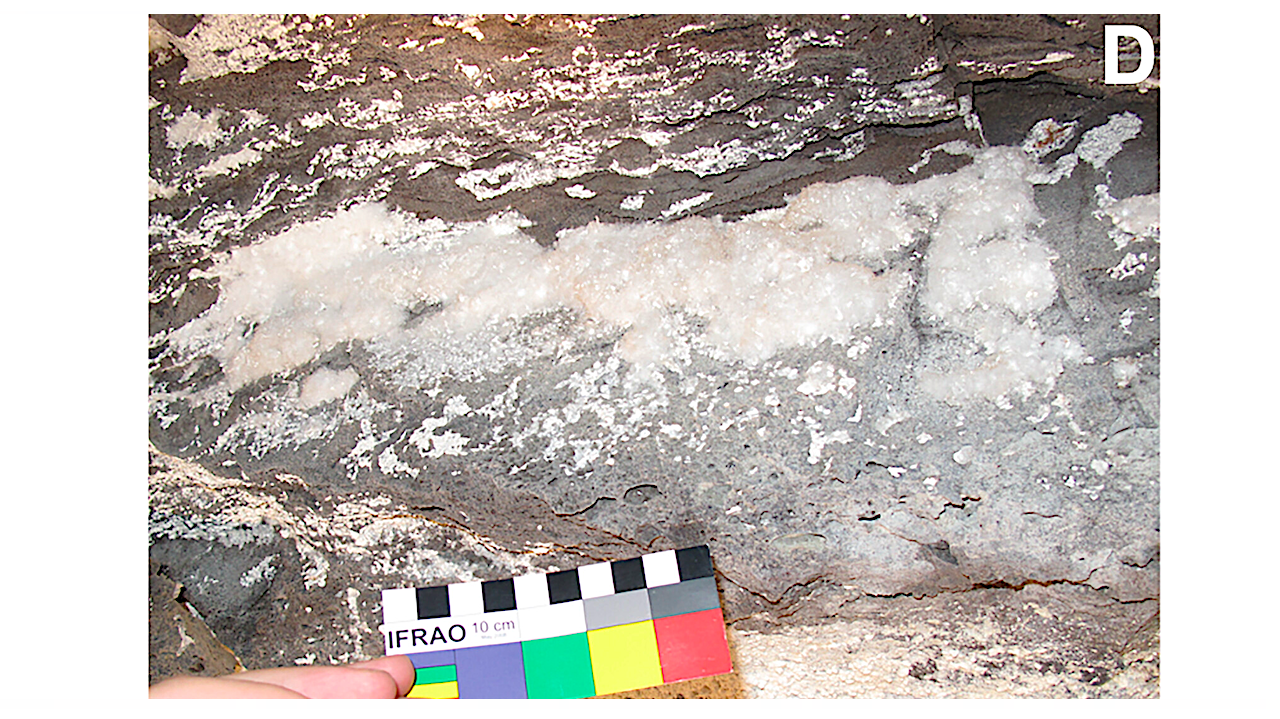
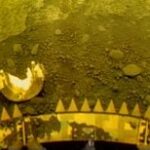
(D) White cotton-like secondary mineral deposits on the wall–ceiling interface (sampling site CLT3, dark zone; scale bar = 10 cm). — Astrobiology via Sage Lava tubes are recognized as strategic
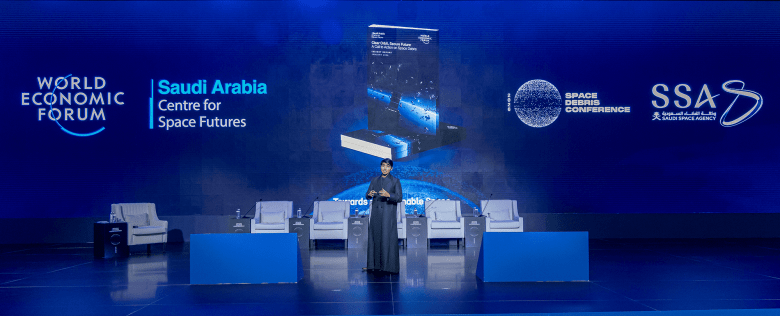
The Space Futures Centre a global independent center established in partnership with the World Economic Forum and the Saudi Space Agency to support the growth of the global space economy

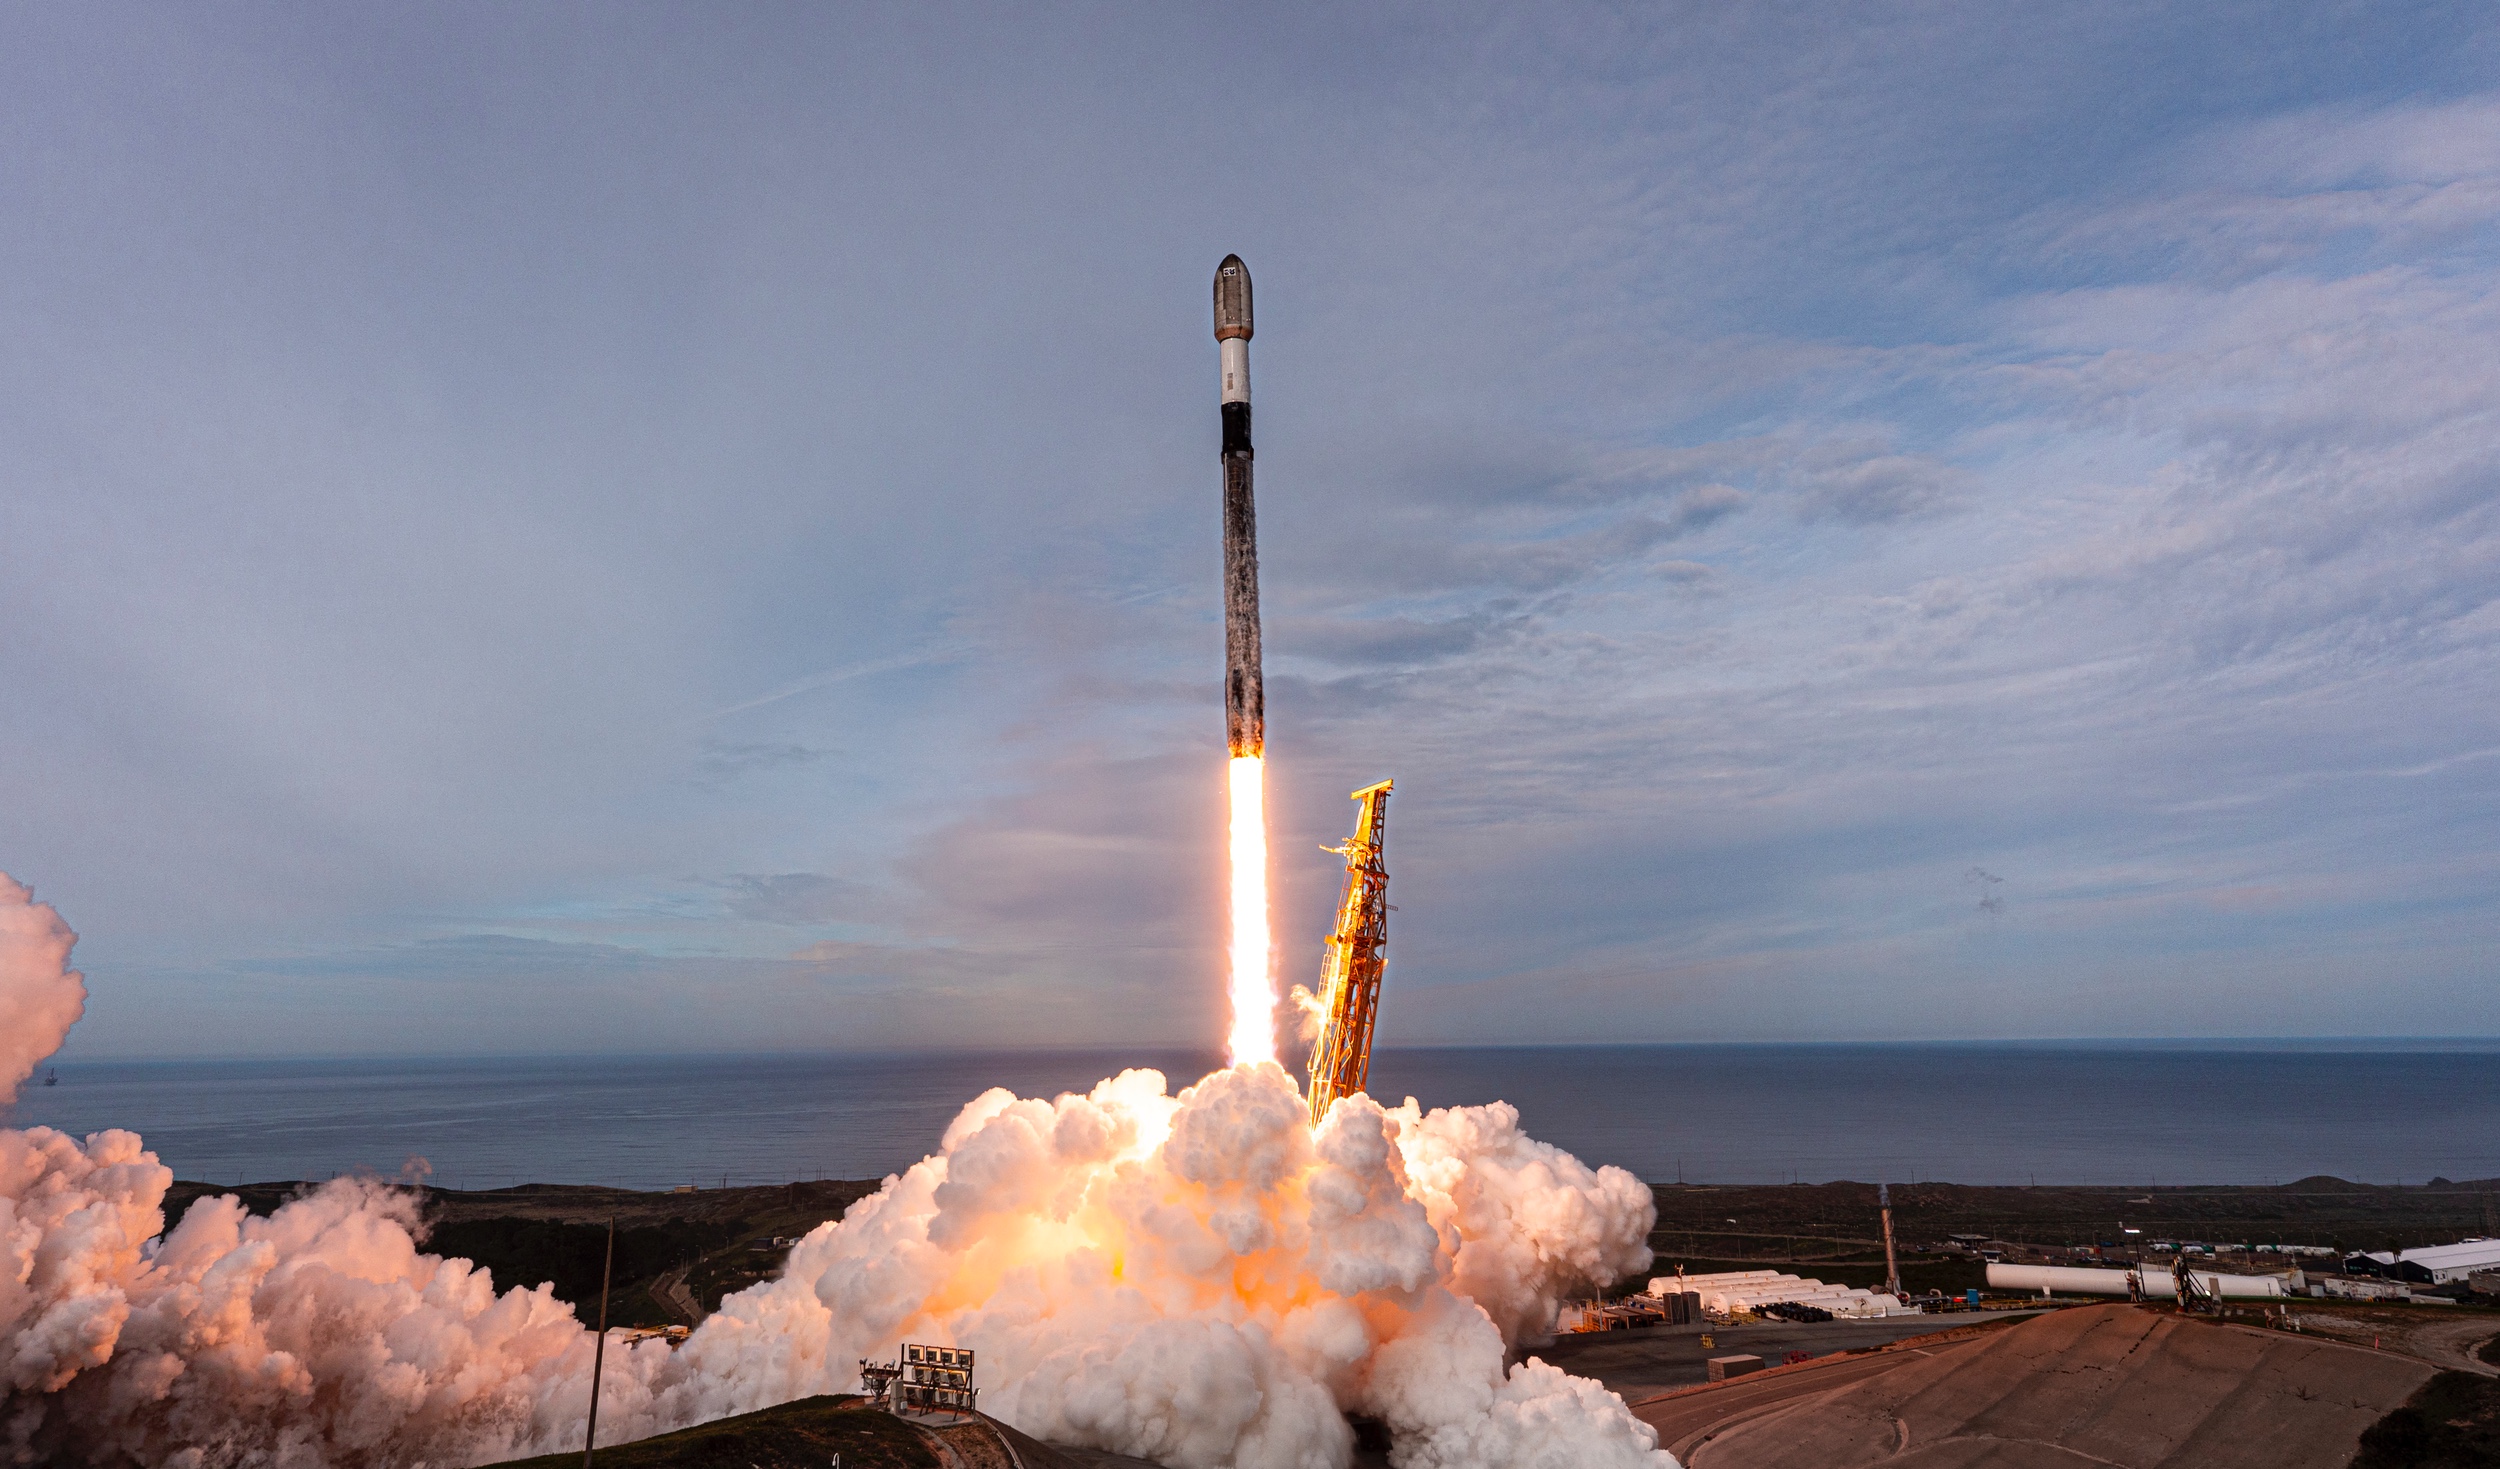
TAMPA, Fla. — Luxembourg-based OQ Technology is preparing to deploy a small satellite to test using C-band to connect smartphones from low Earth orbit, joining SpaceX in a push to
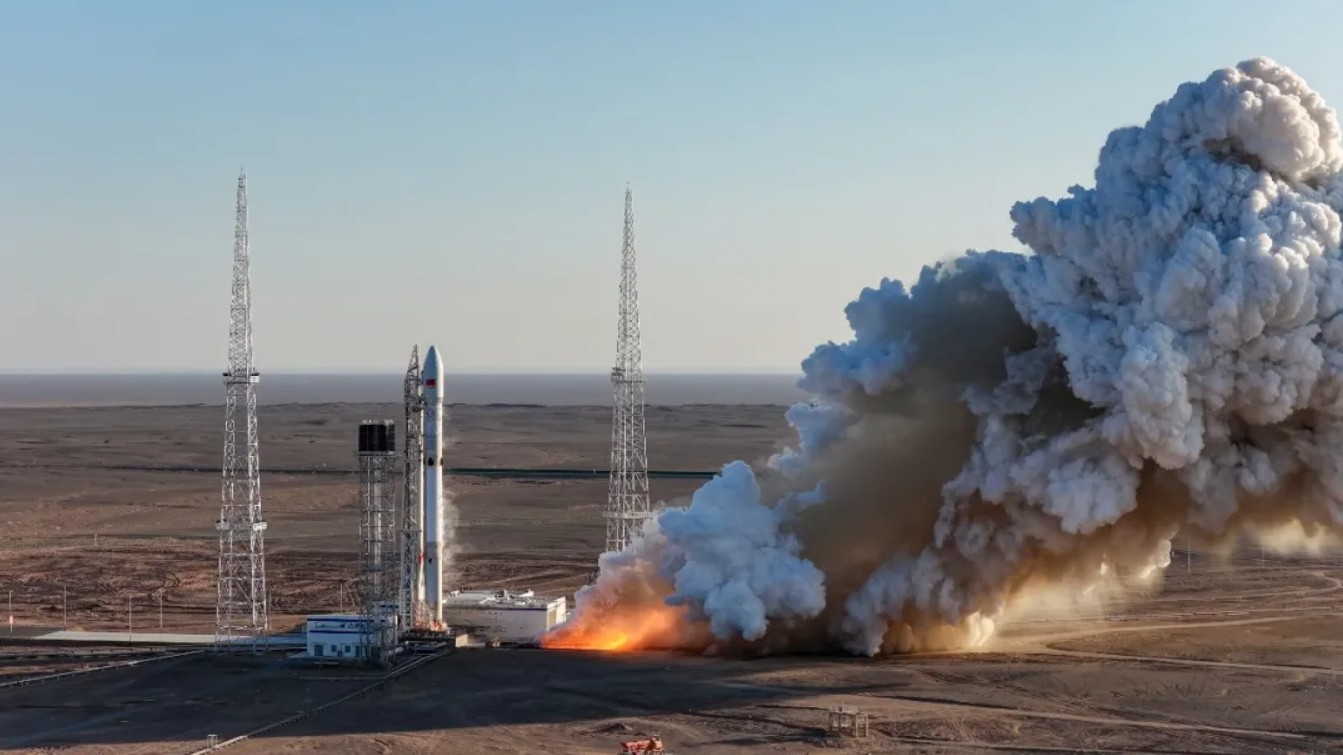
HELSINKI — China appears set to accelerate its launch rate this year while also conducting tests key to its crewed lunar ambitions and launching major missions. The China Aerospace Science
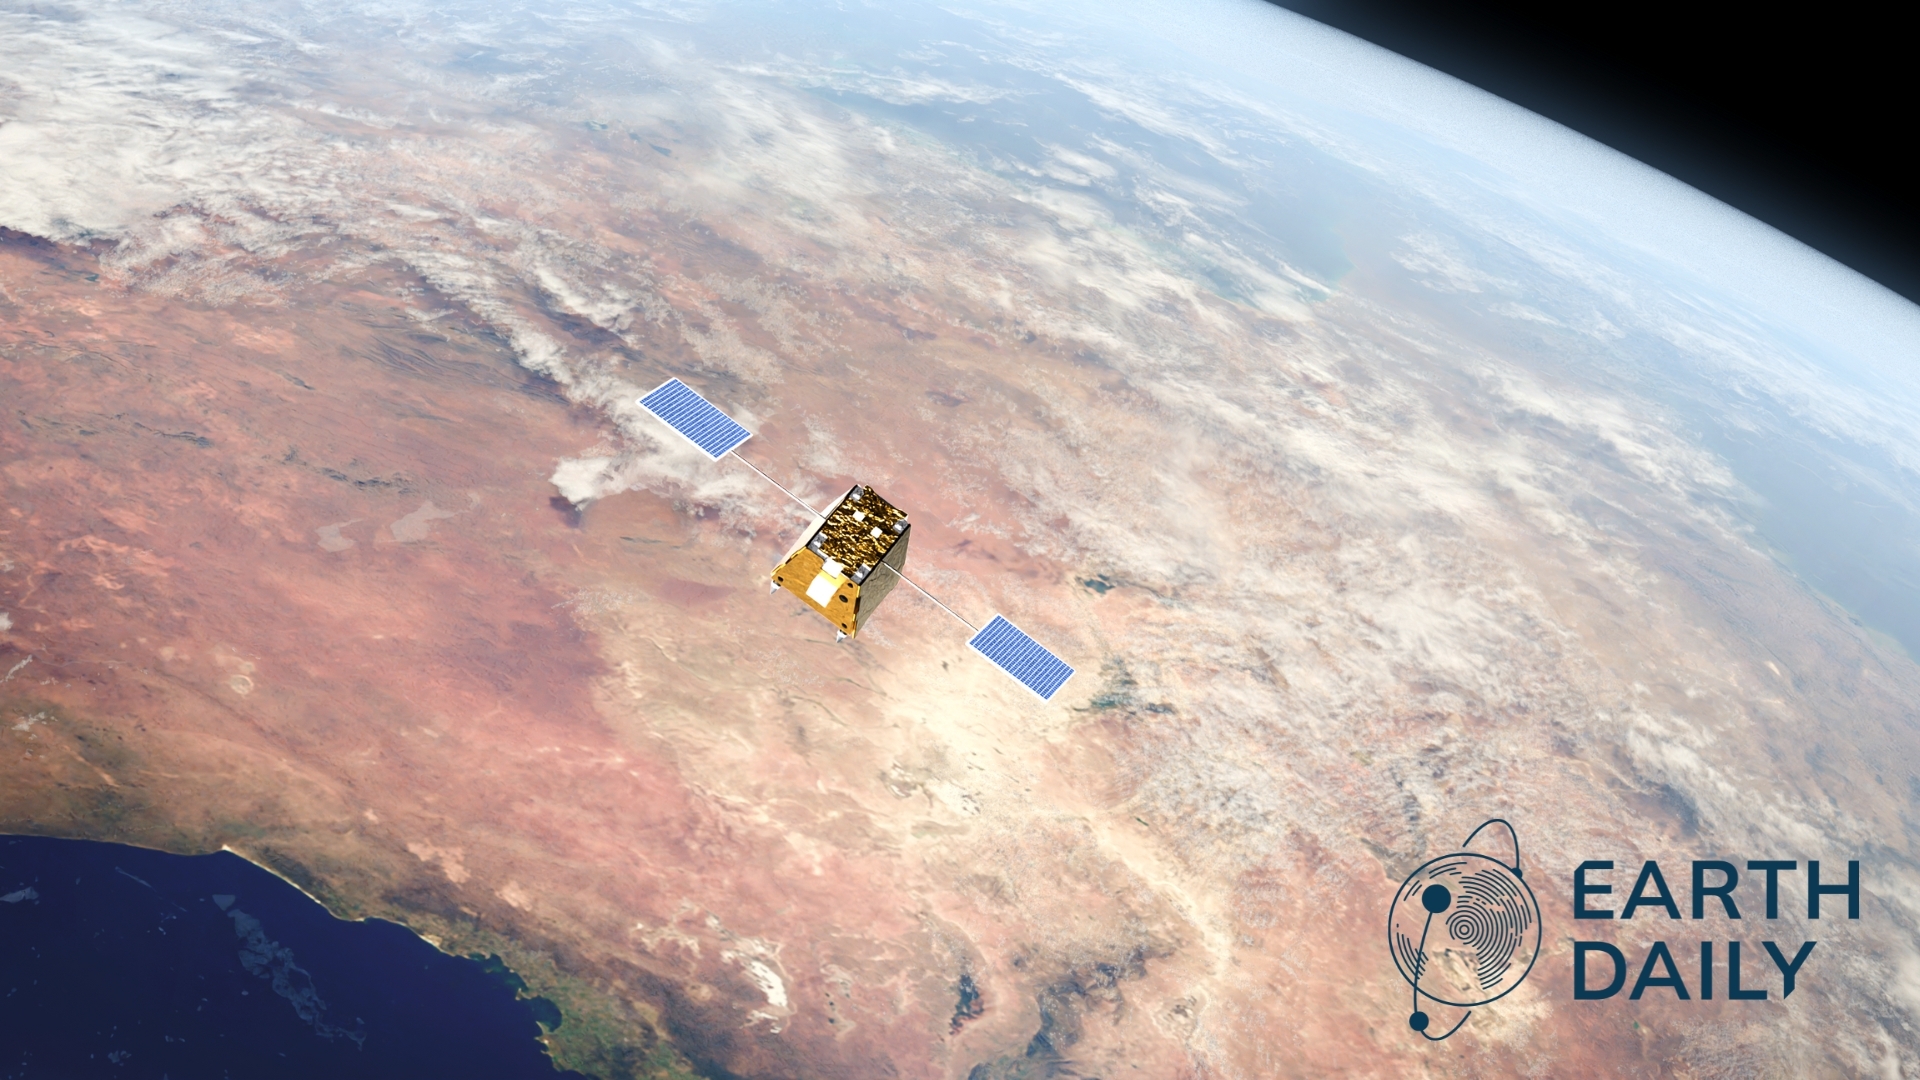
For more than a decade, the Earth observation industry has insisted that commercial adoption is just around the corner. Yet adoption outside defense remains limited, uneven, and difficult to sustain.
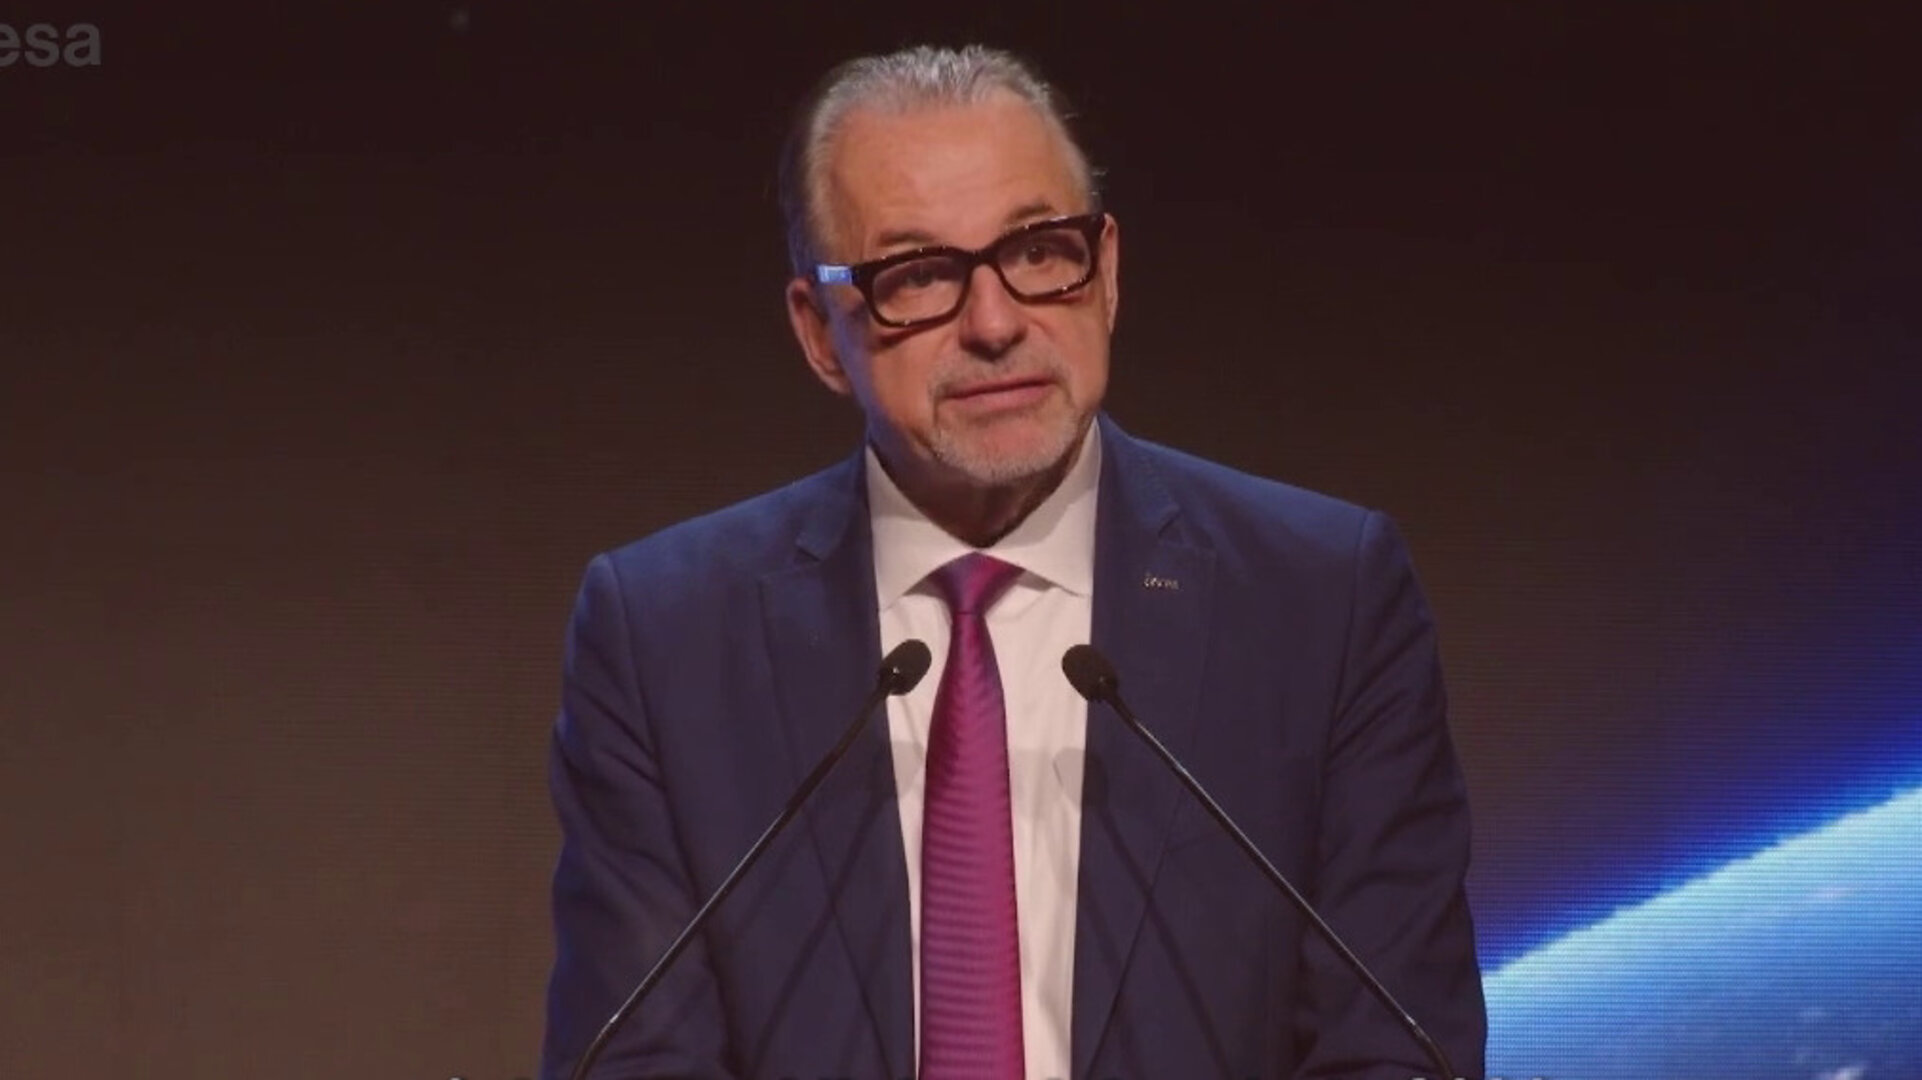
Watch the keynote address by ESA Director General Josef Aschbacher on the second day of the 18th European Space Conference in Brussels. The European Space Conference is a key strategic
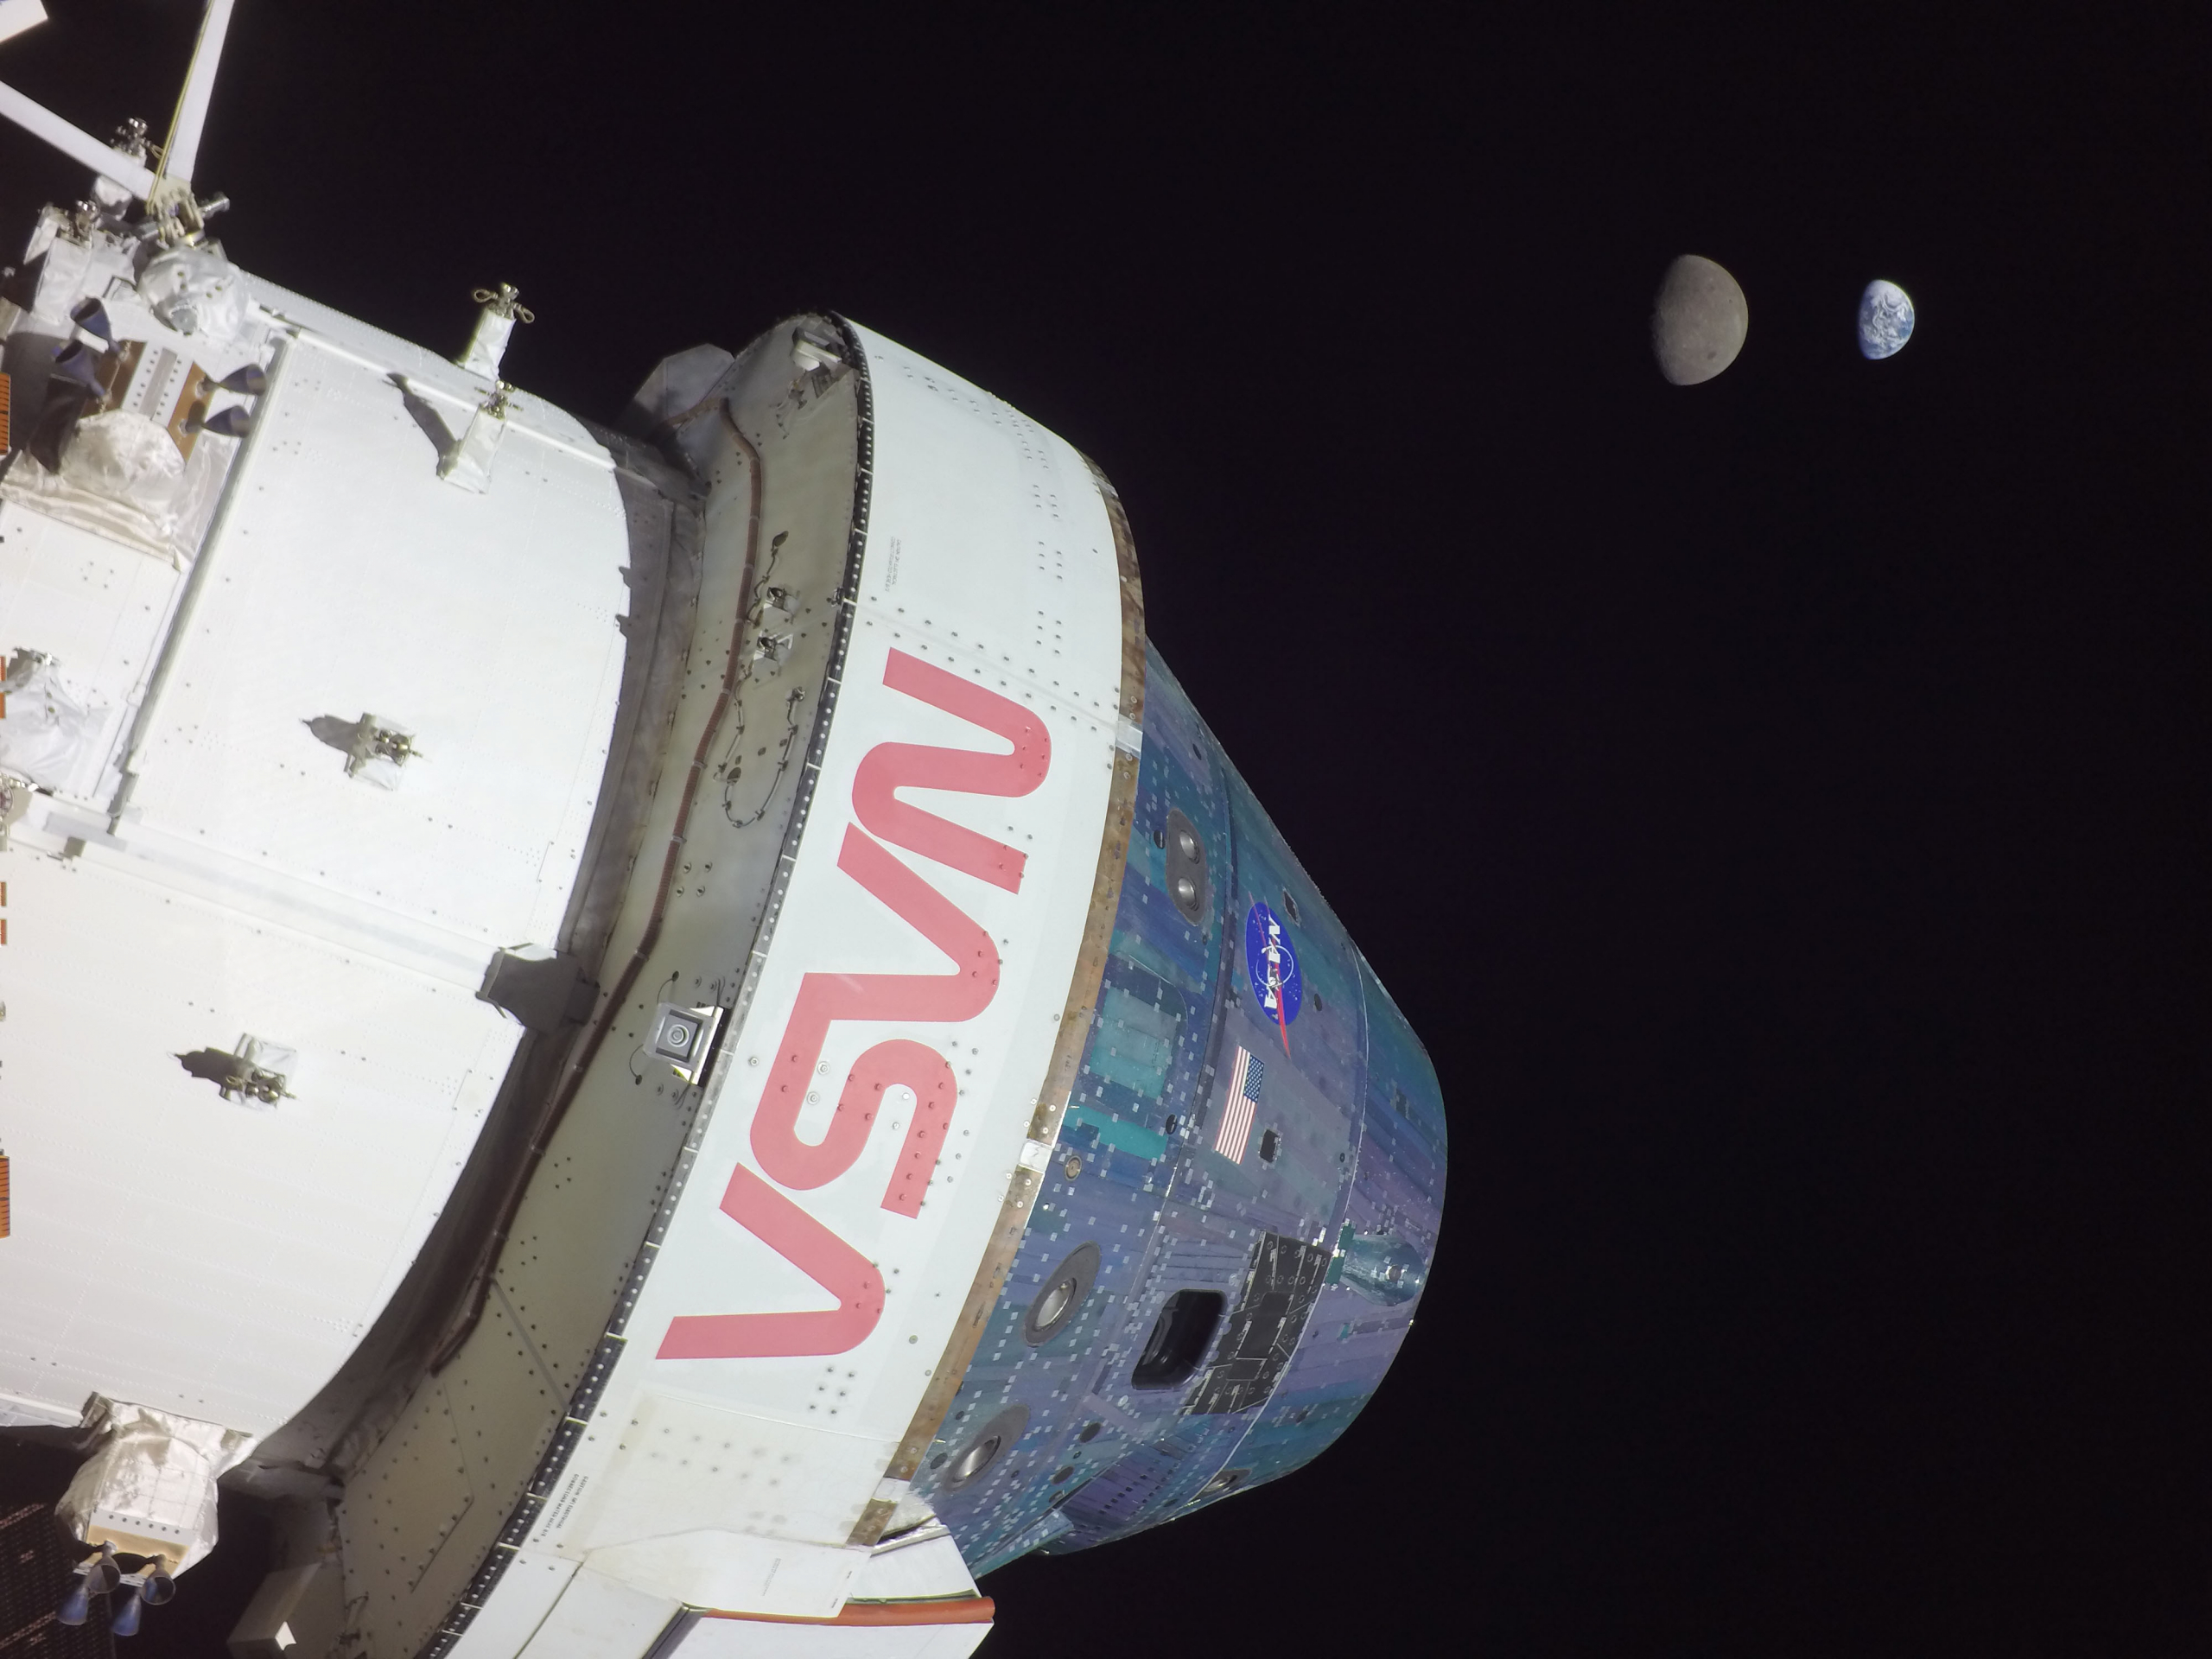
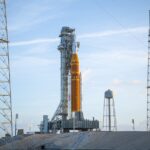
NASA is preparing for the Artemis II mission, set to launch from Florida in the coming weeks. This landmark mission marks the first time humans will return to the vicinity
ORLANDO, Fla. — The Federal Aviation Administration office that regulates commercial spaceflight expects continued growth in launches, despite industry concerns about whether the office can keep pace. Speaking at the
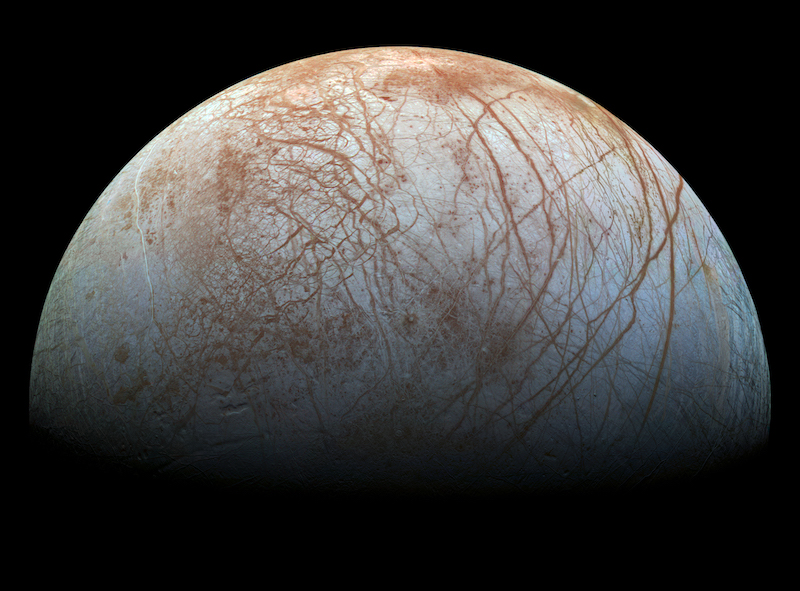
Is there life in Europa’s ocean? A new study suggests that chemical nutrients in the moon’s icy crust could sink down into the subsurface ocean, providing a source of nutrients