Keith Cowing Explorers Club Fellow, ex-NASA Space Station Payload manager/space biologist, Away Teams, Journalist, Lapsed climber, Synaesthete, Na’Vi-Jedi-Freman-Buddhist-mix, ASL, Devon Island and Everest Base Camp veteran, (he/him) 🖖🏻 Follow on

Keith Cowing Explorers Club Fellow, ex-NASA Space Station Payload manager/space biologist, Away Teams, Journalist, Lapsed climber, Synaesthete, Na’Vi-Jedi-Freman-Buddhist-mix, ASL, Devon Island and Everest Base Camp veteran, (he/him) 🖖🏻 Follow on
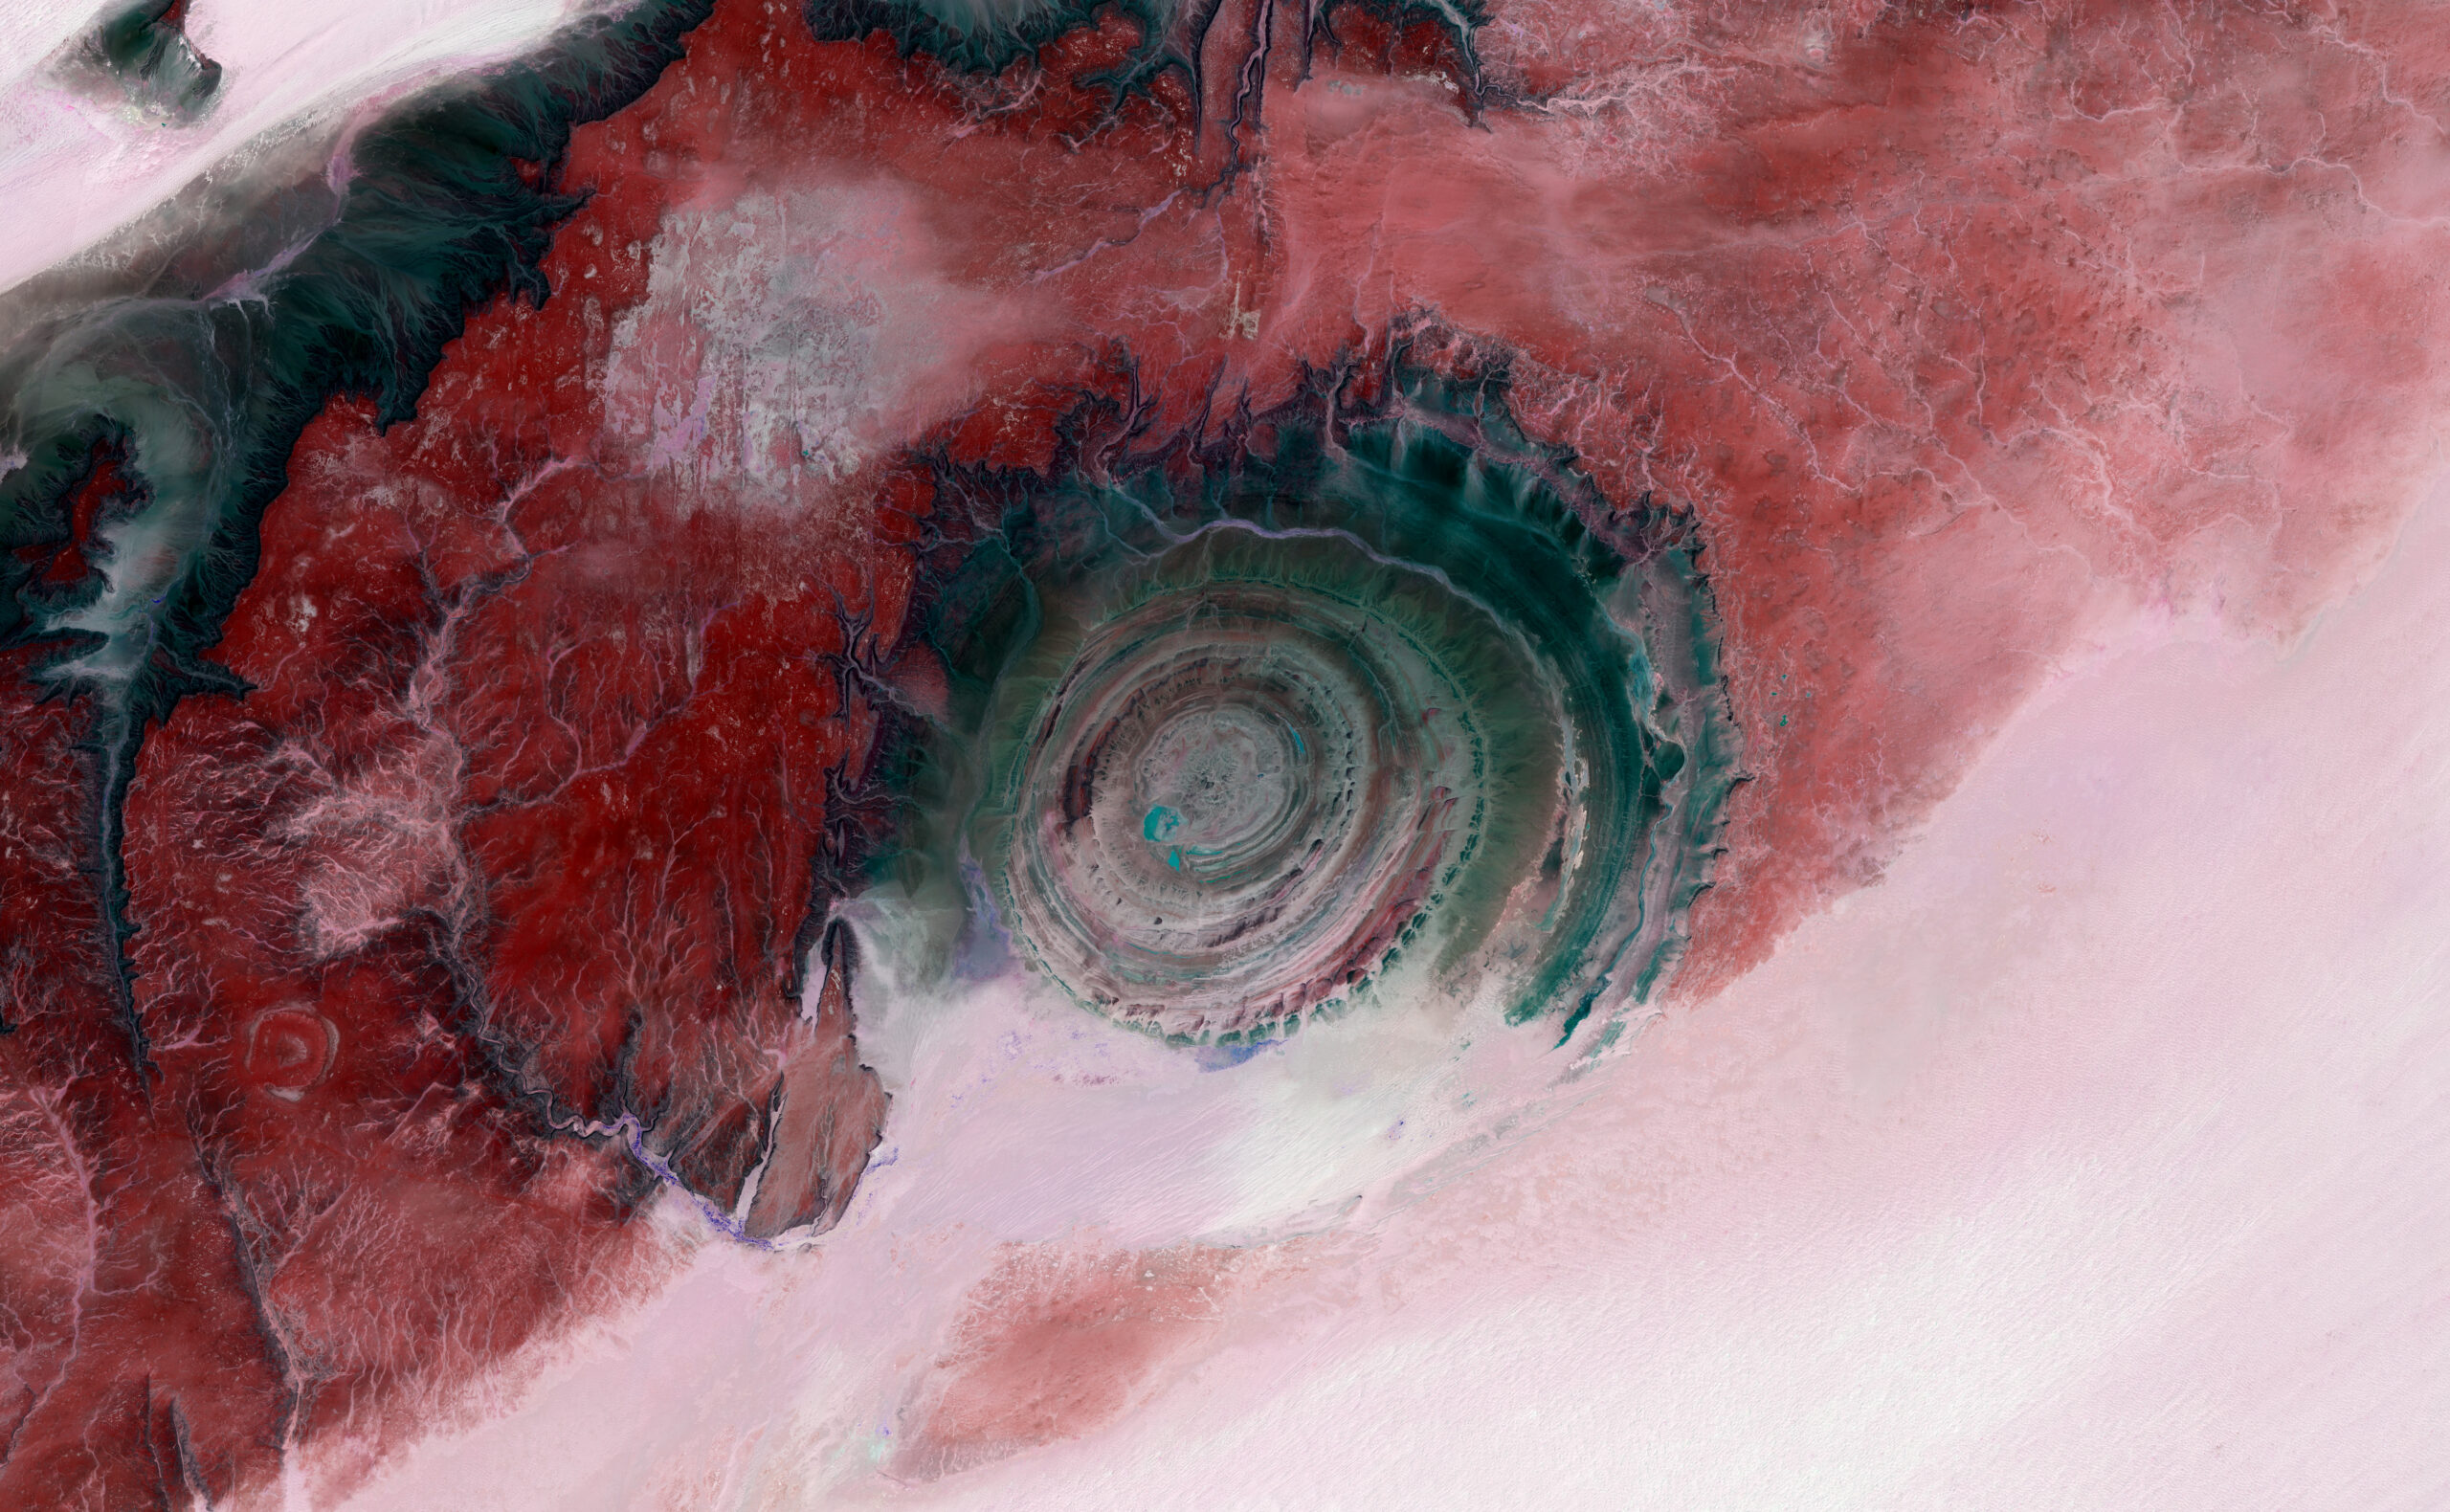
In the middle of Mauritania’s Sahara Desert, surrounded by an ocean of sand, lies a colossal stone spiral that seems almost too perfect to be natural. From orbit, in a
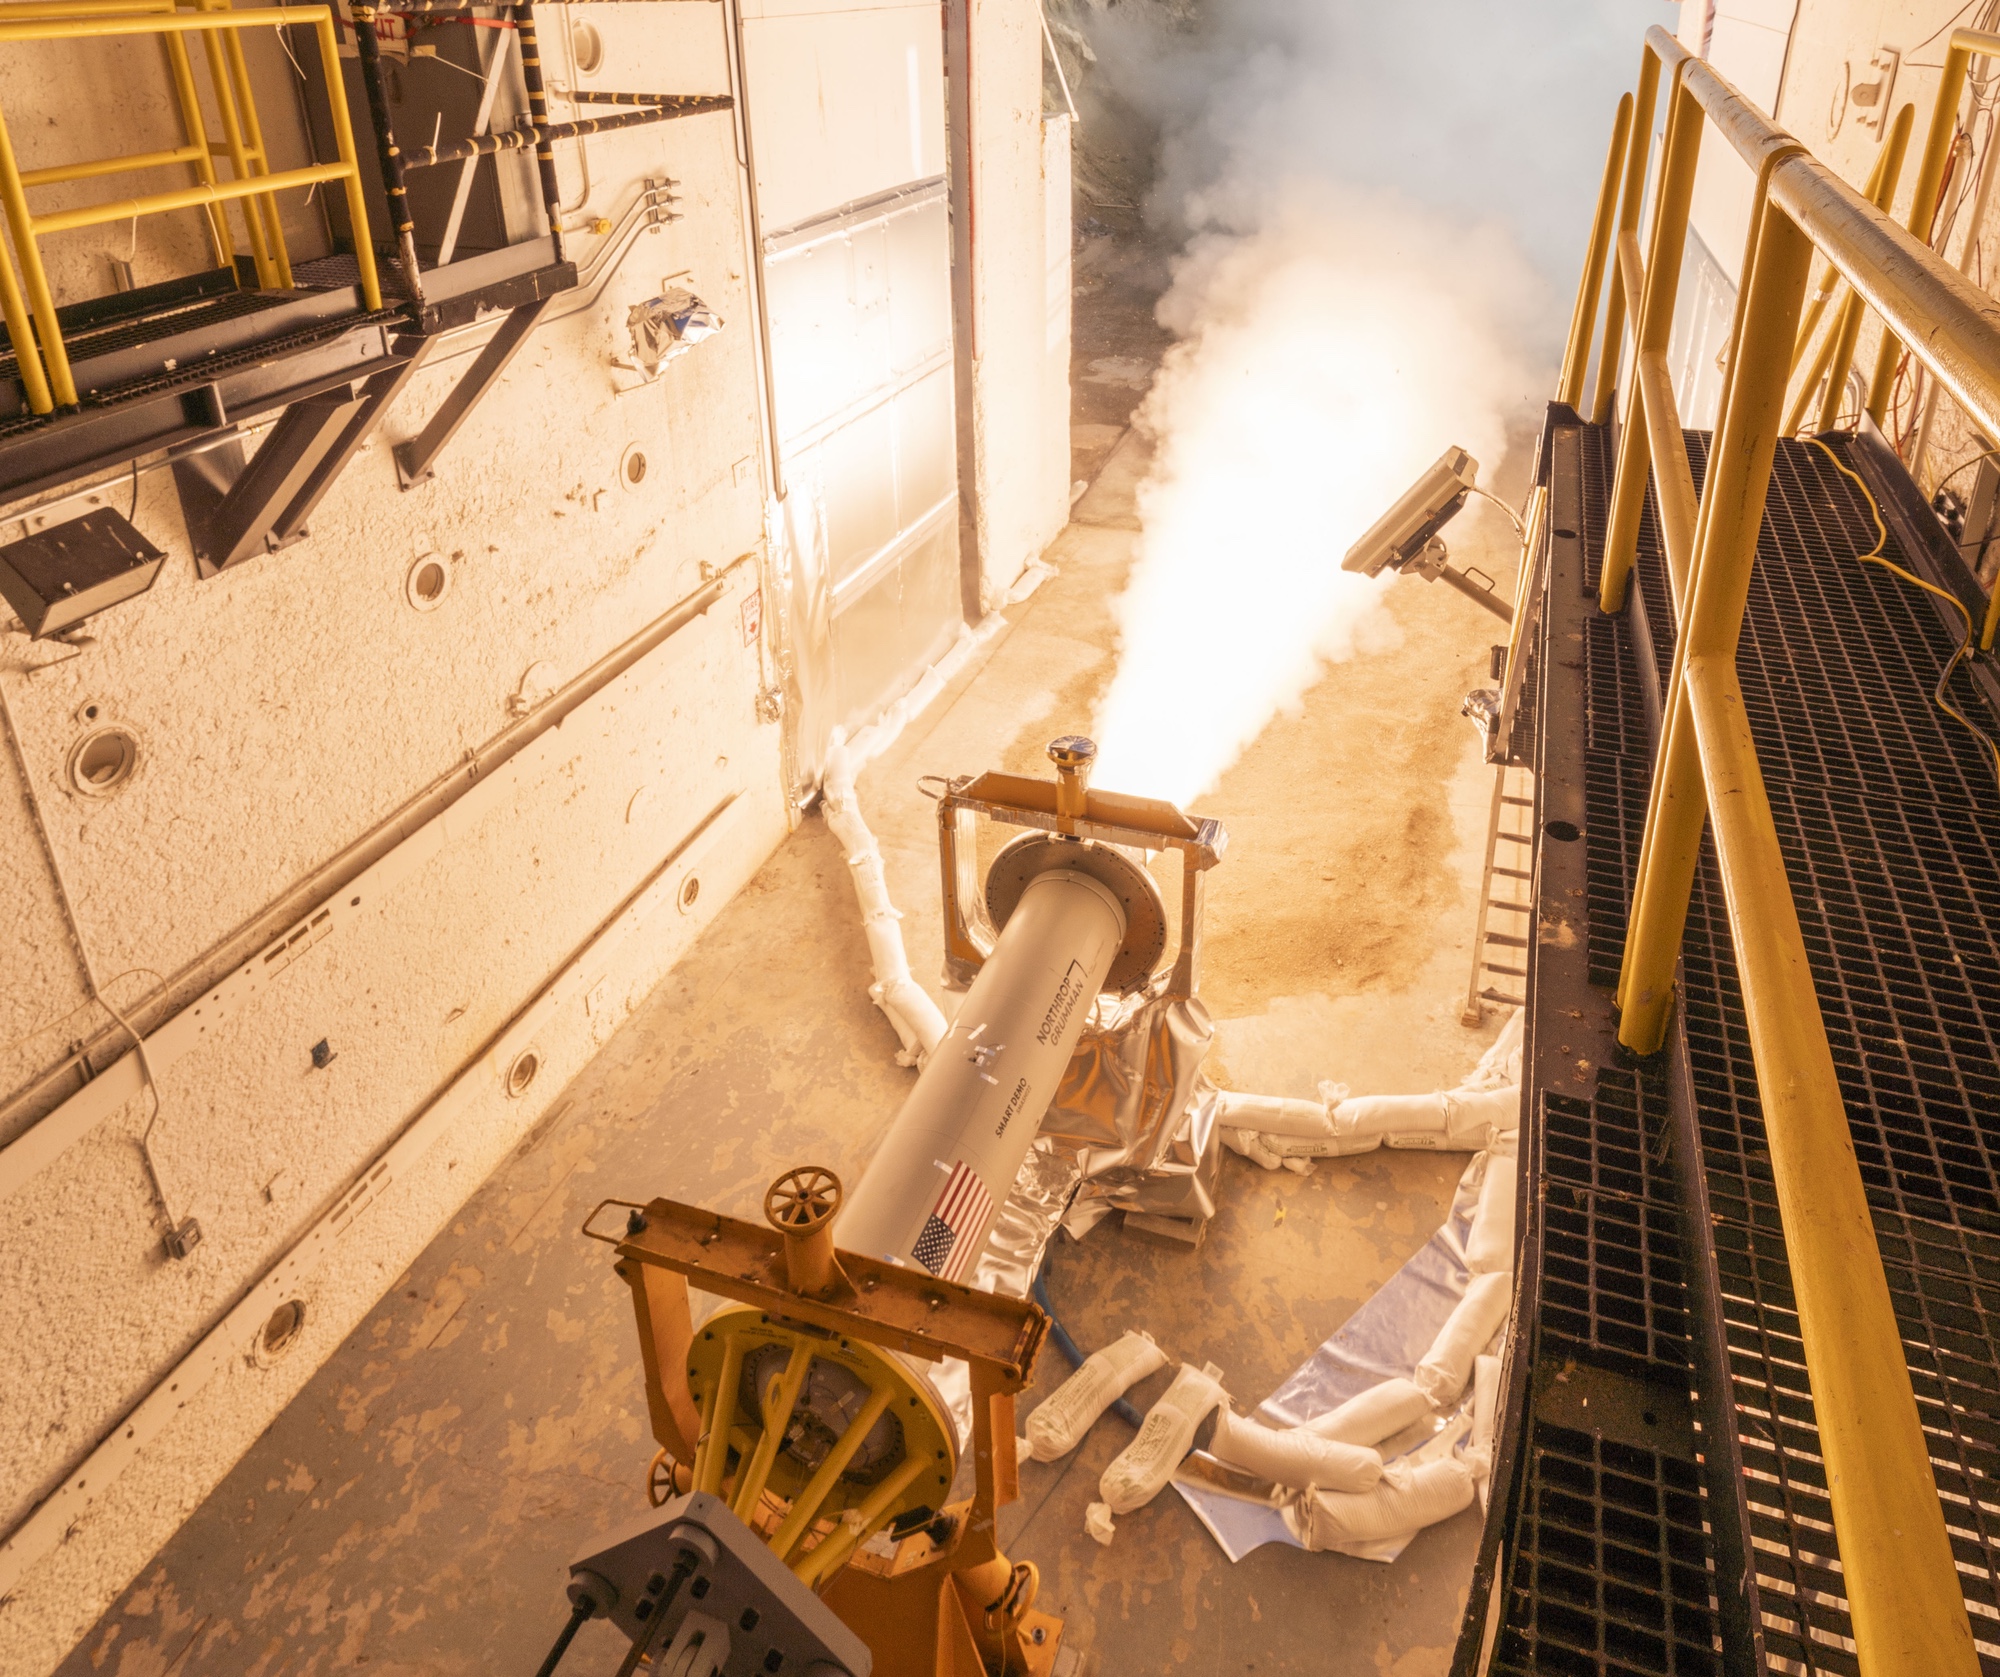
WASHINGTON — Northrop Grumman tested a solid rocket motor Dec. 4 as part of an internal program to advance solid rocket propulsion technologies. The company conducted a static-fire test of
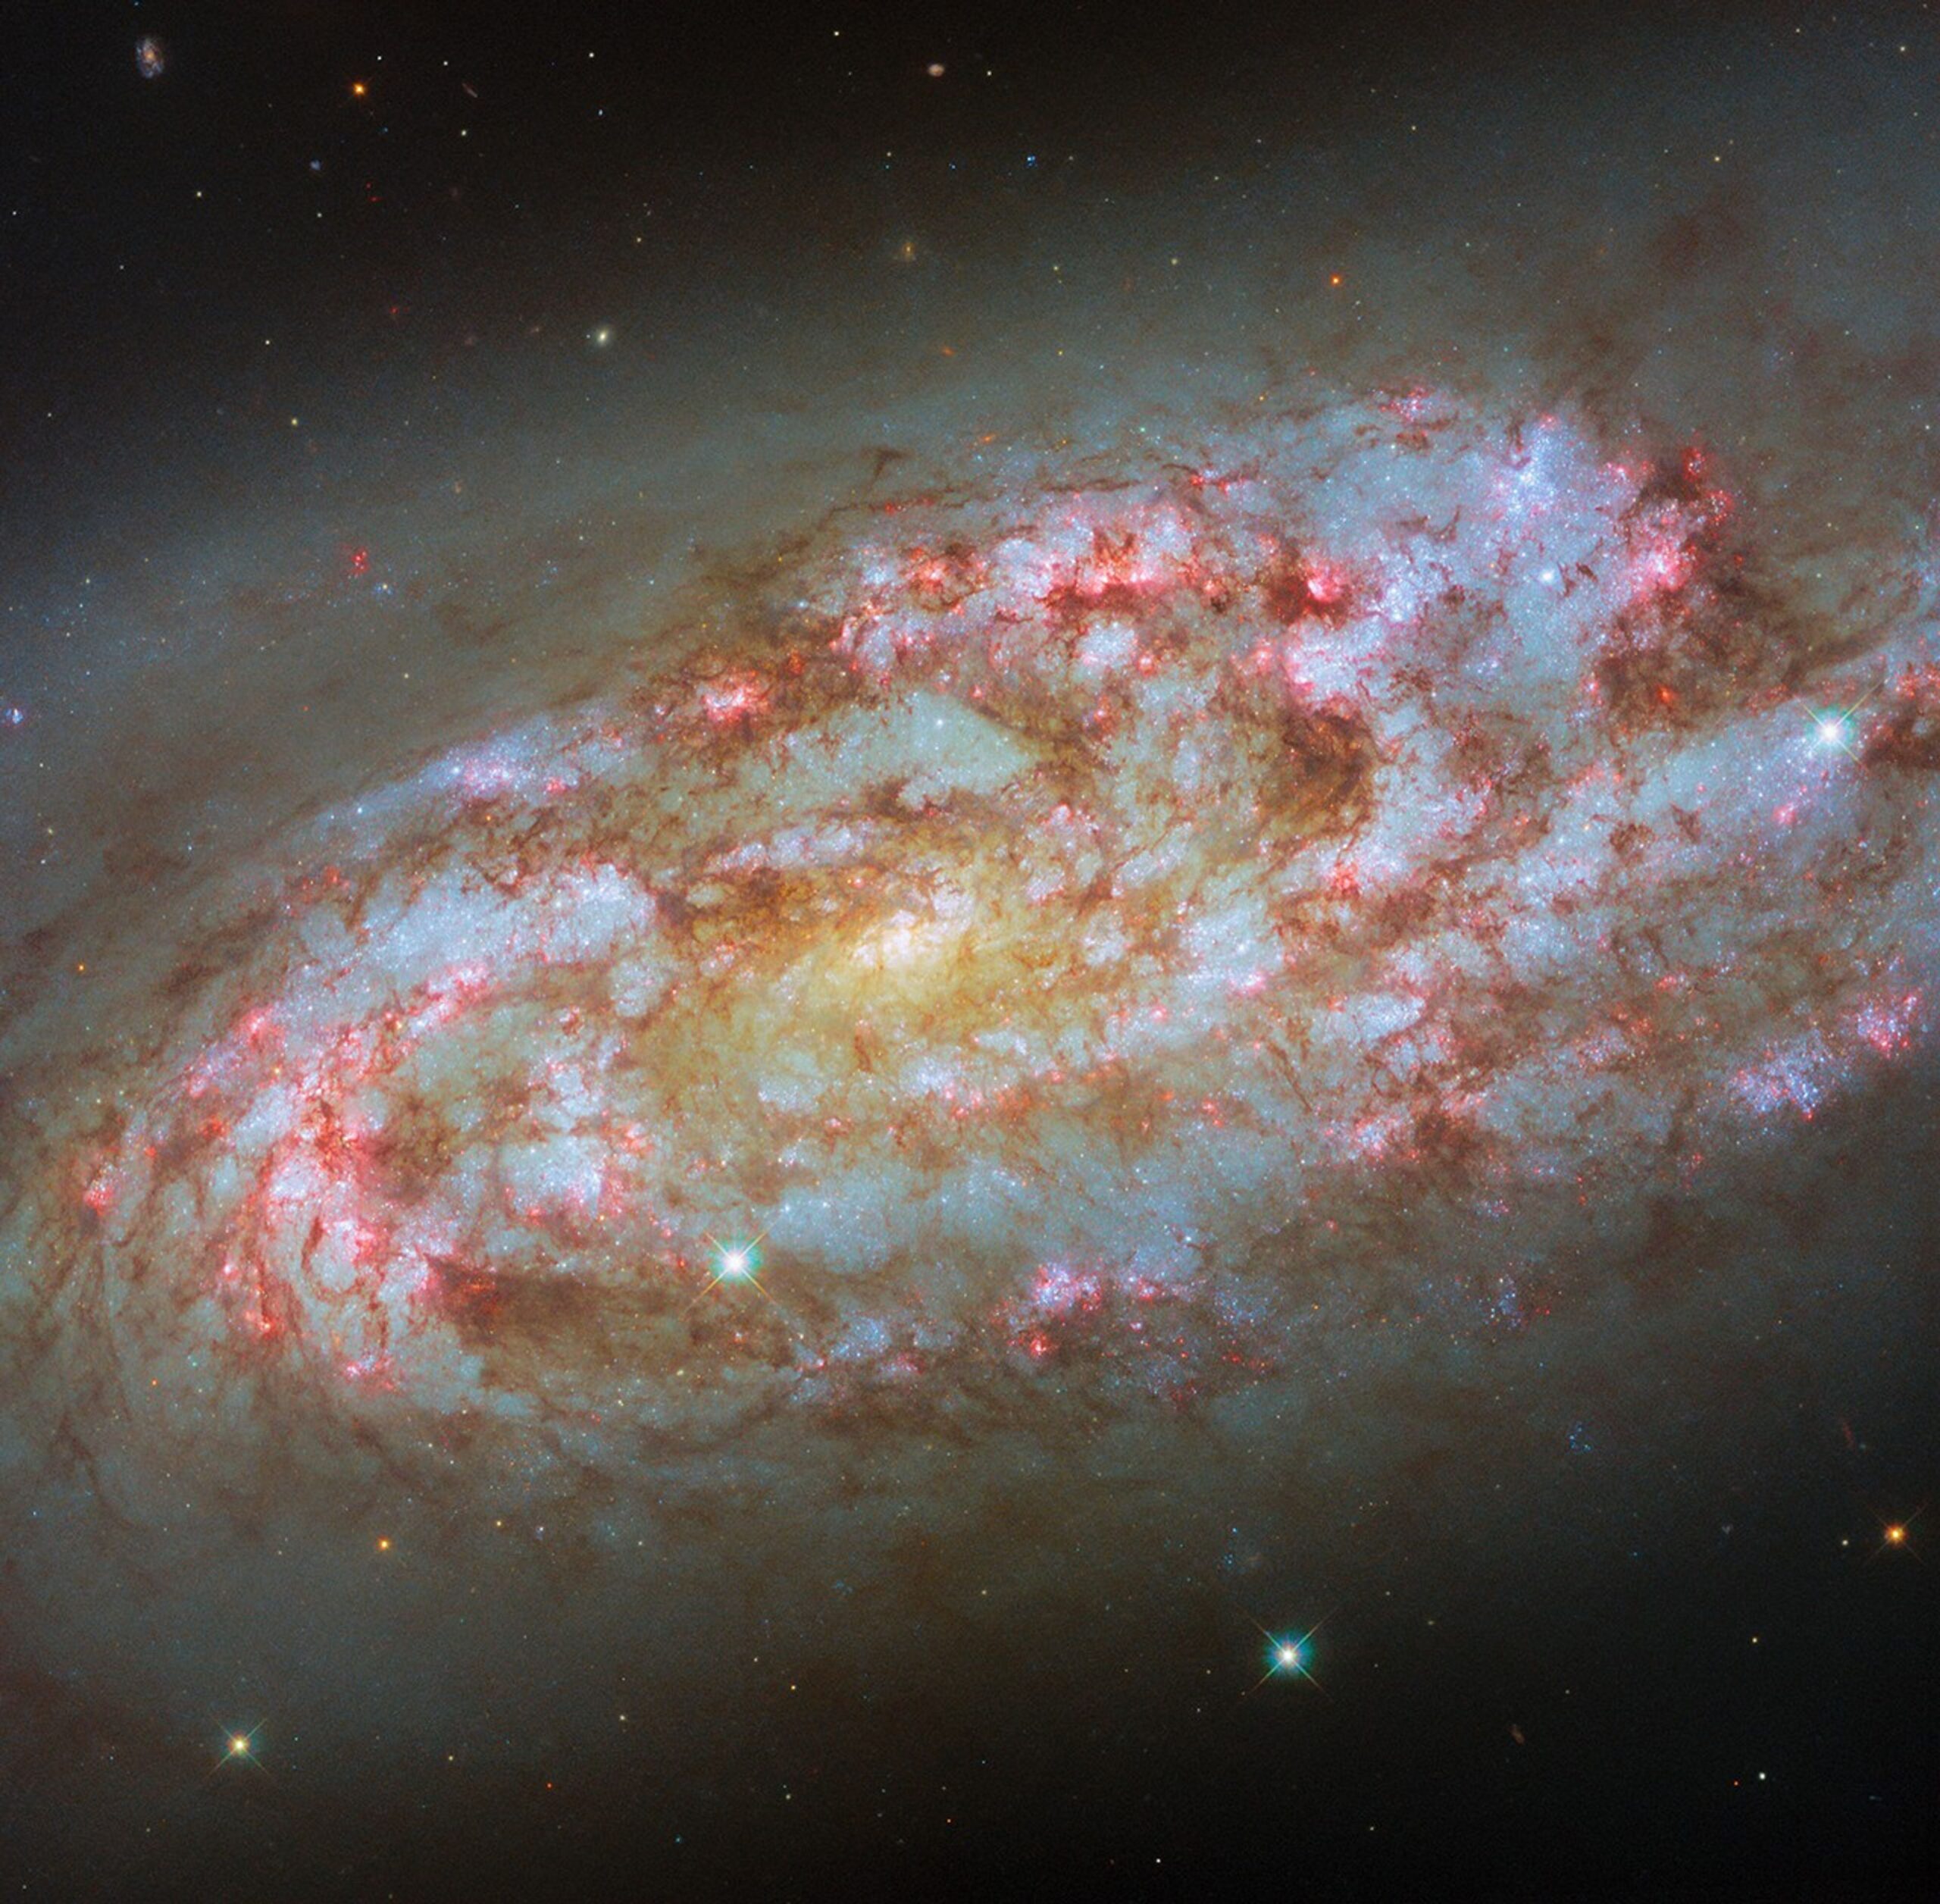
Explore Hubble Hubble Home Overview About Hubble The History of Hubble Hubble Timeline Why Have a Telescope in Space? Hubble by the Numbers At the Museum FAQs Impact & Benefits
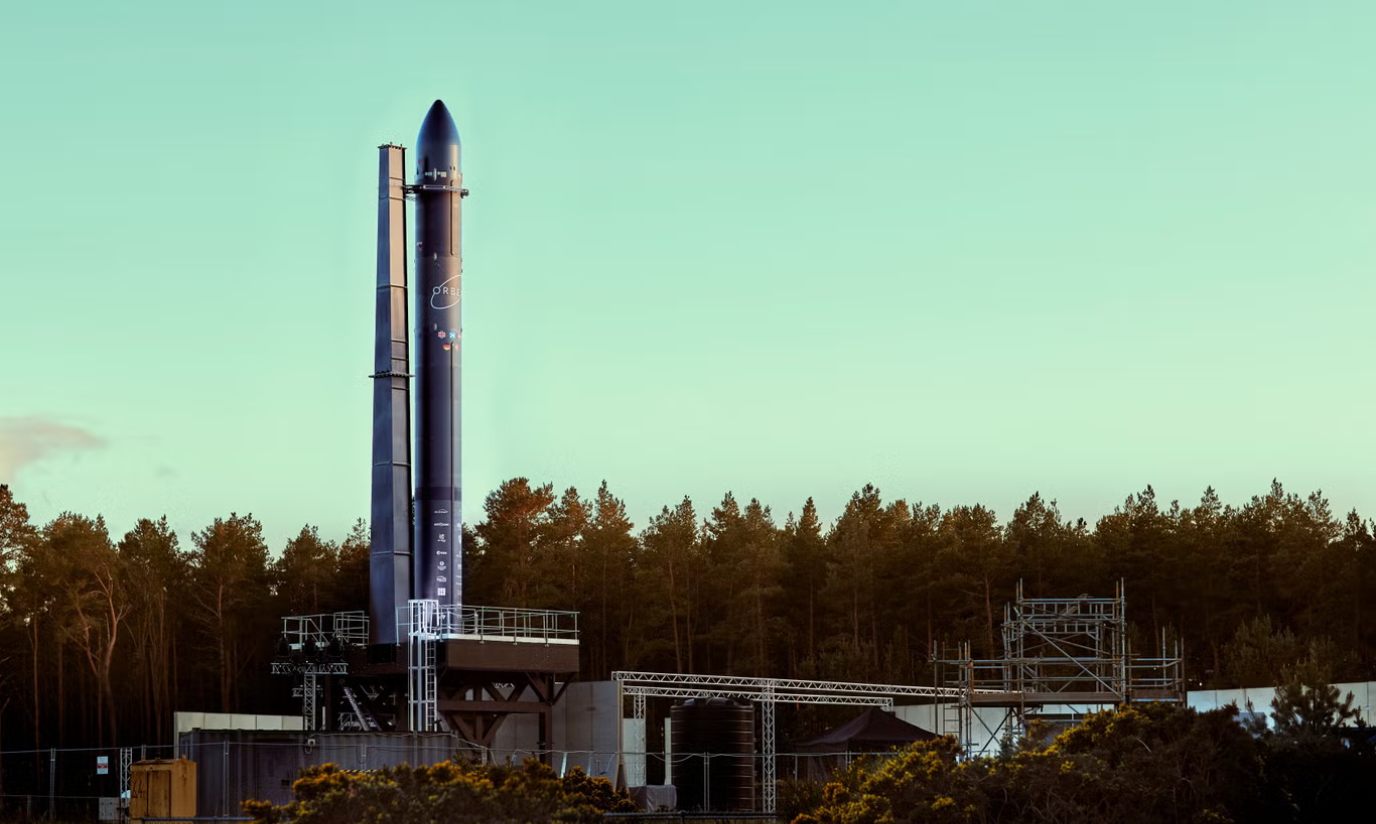
WASHINGTON — Orbex, one of the five launch companies in ESA’s European Launcher Challenge, received far less funding than the other four at the agency’s ministerial conference after the United
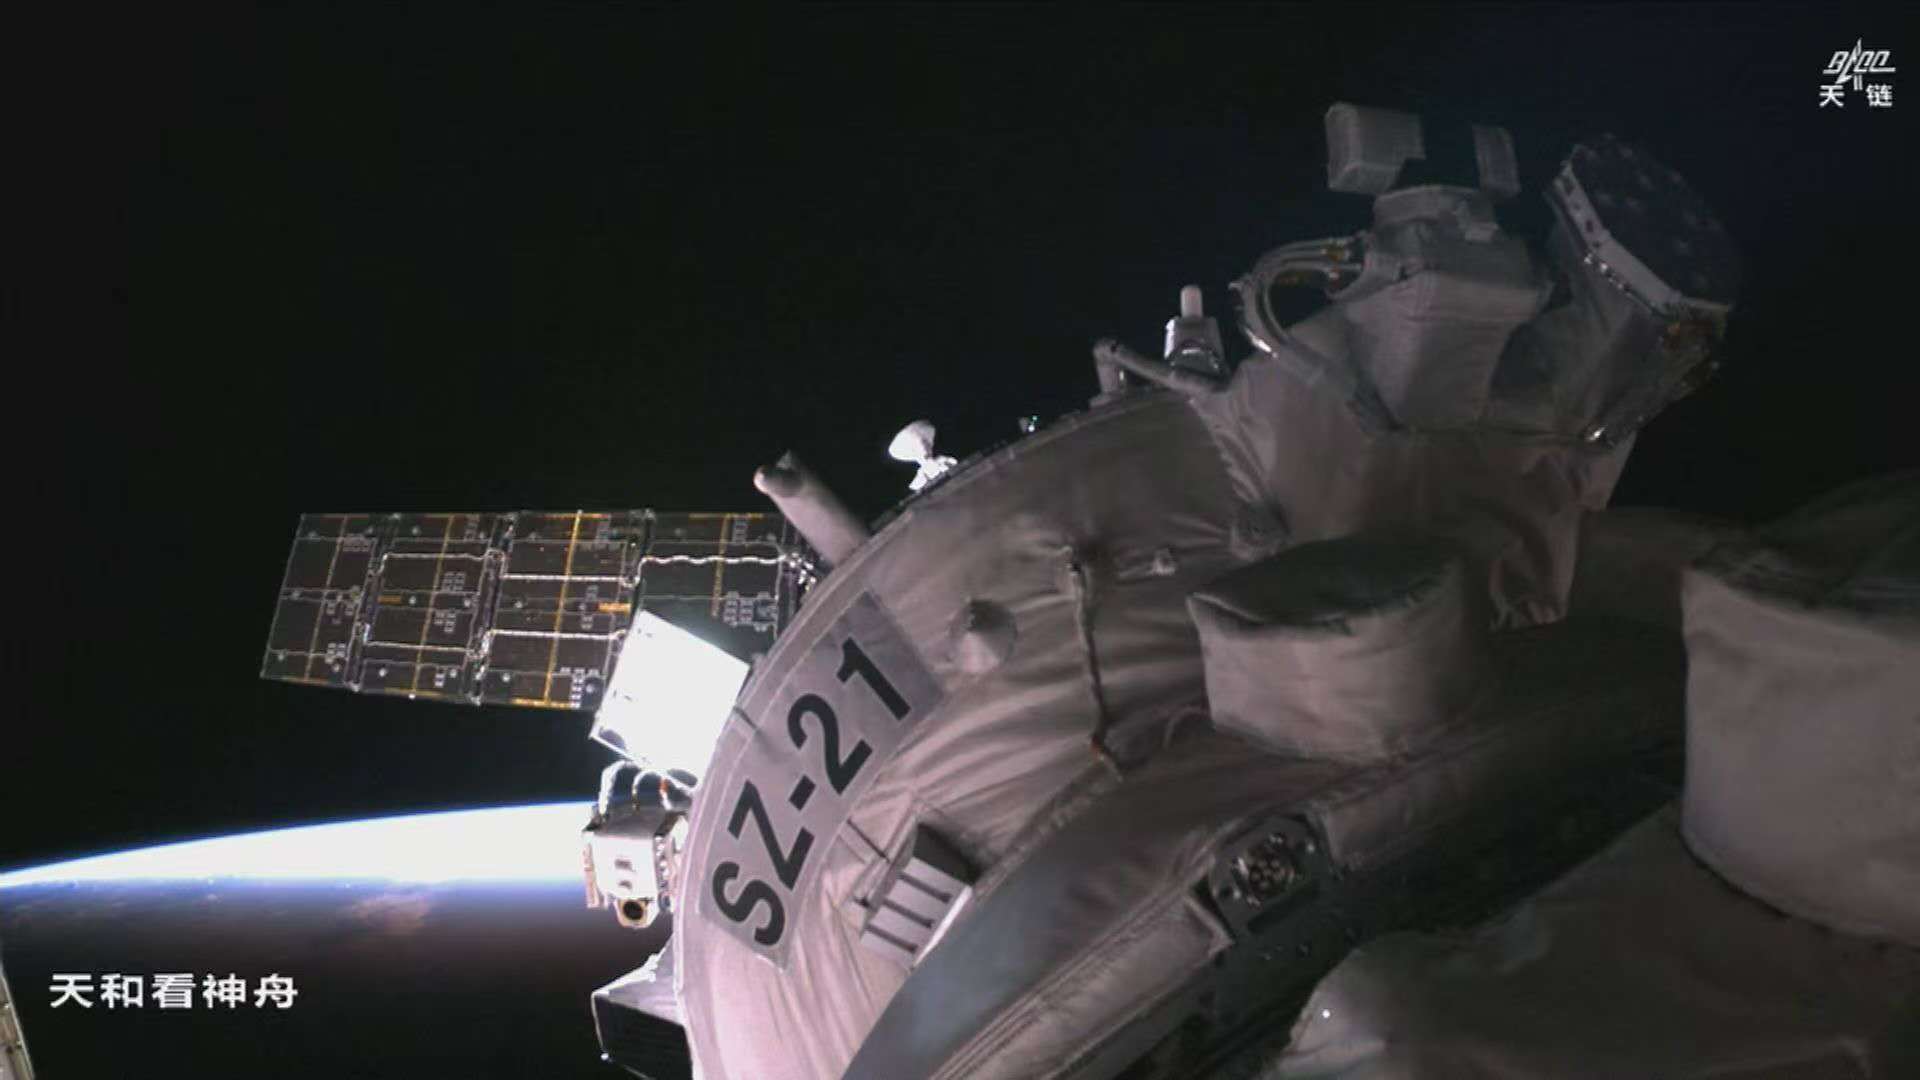
HELSINKI — China could be without emergency launch capability to Tiangong space station for months, leaving no rapid-response option for any new crisis following the Shenzhou-20 incident. The Shenzhou-22 spacecraft
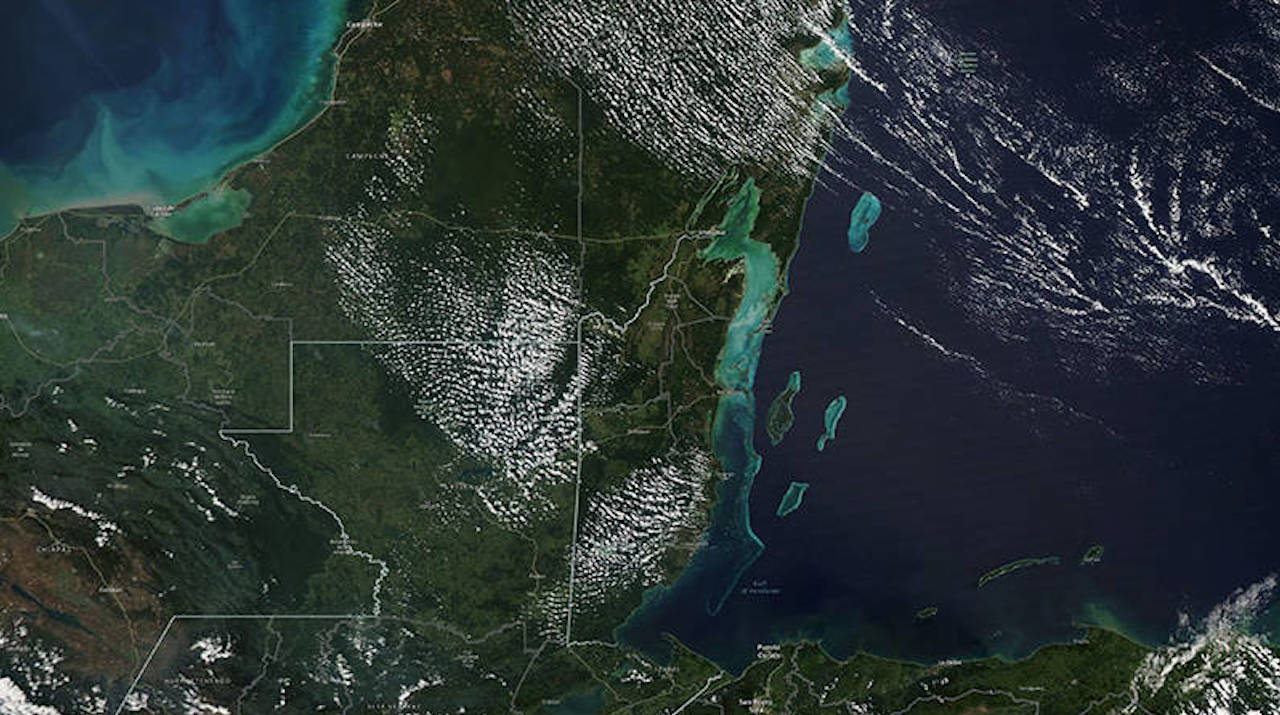
At next year’s World Radiocommunications Conference (WRC-25), governments will face a choice that goes to the heart of how we monitor our warming planet. Some regulators are wondering whether to
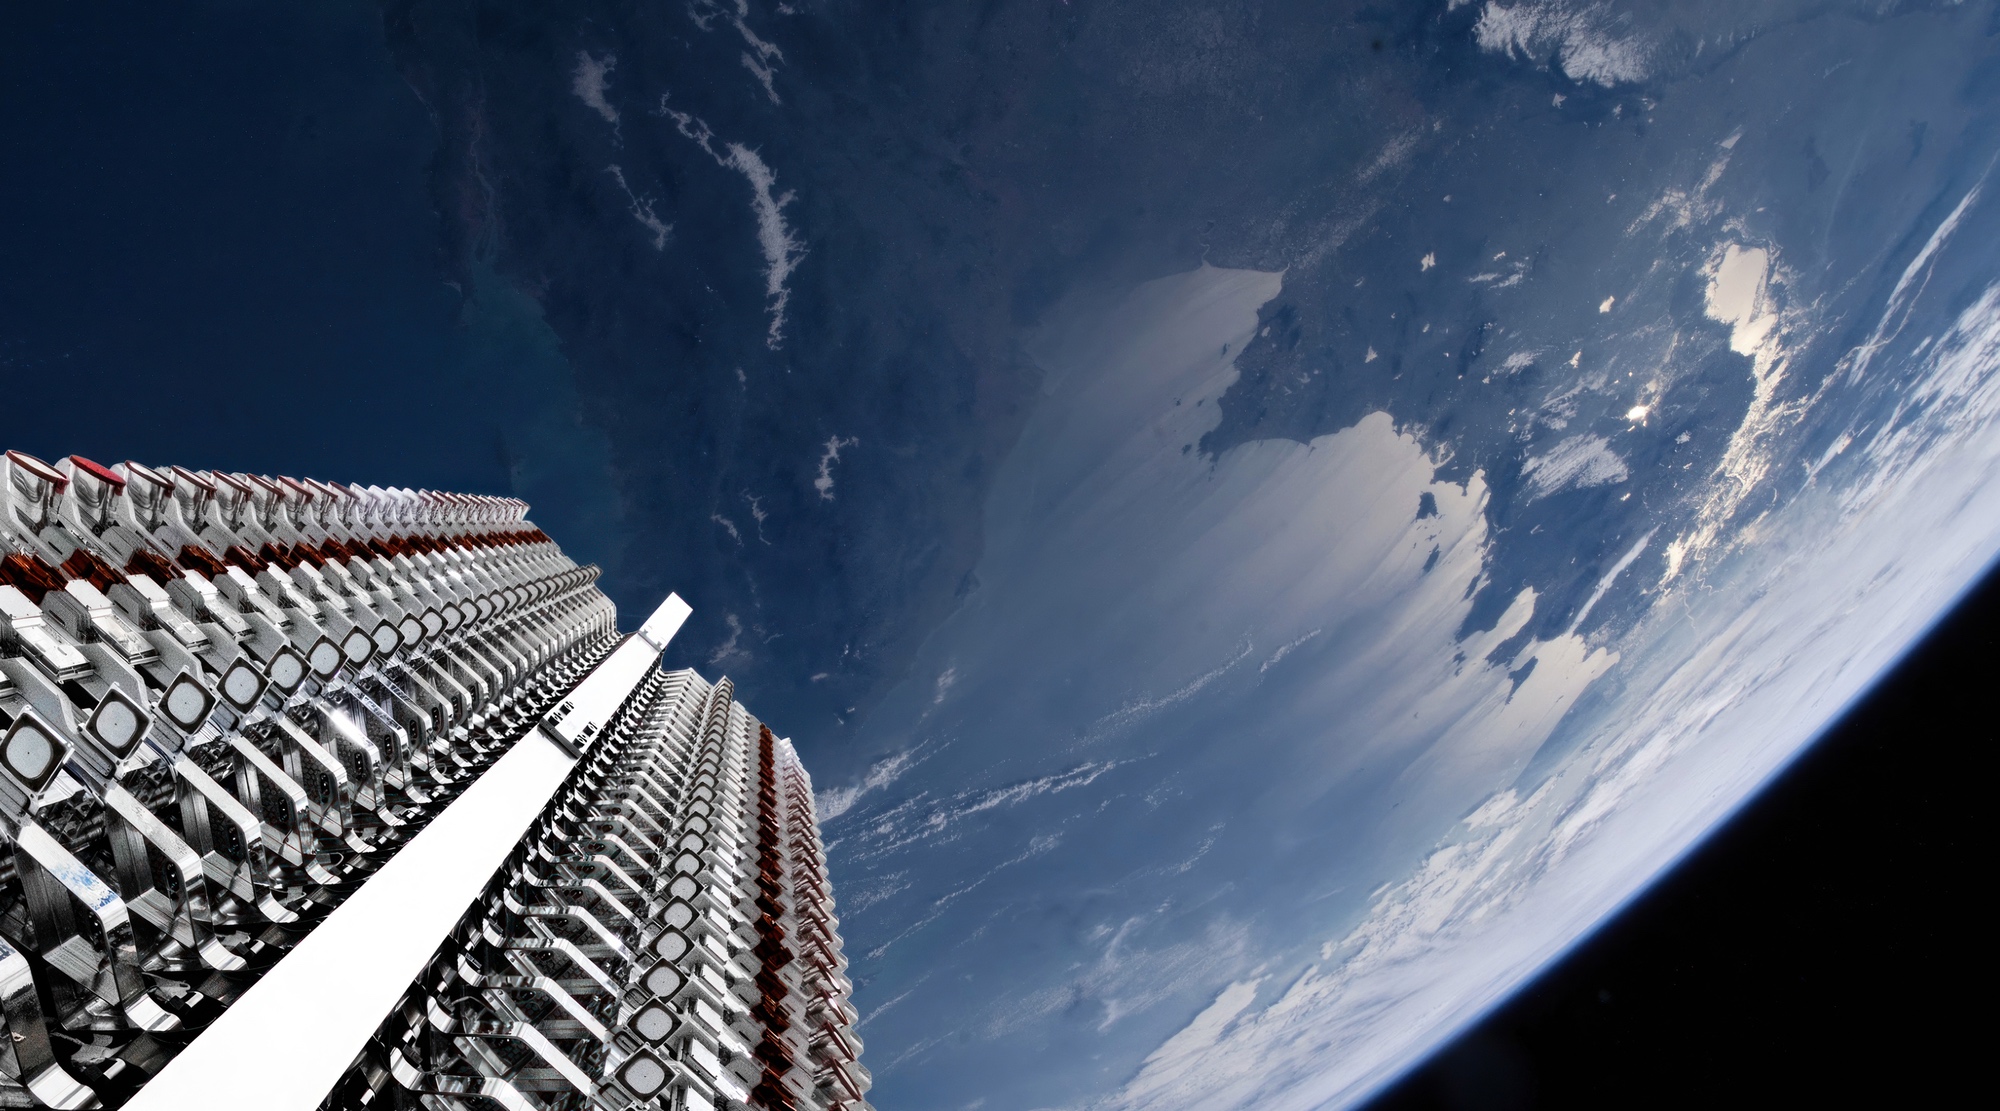
Projections for the booming space economy often come with trillion-dollar headlines, but the lion’s share of near-term revenue looks destined for just a handful of massive constellations with the funds

The final full moon of 2025 treated stargazers to a high-flying lunar spectacle as the “Cold Moon” glowed among the stars of the constellation Taurus on Dec. 4. December’s full
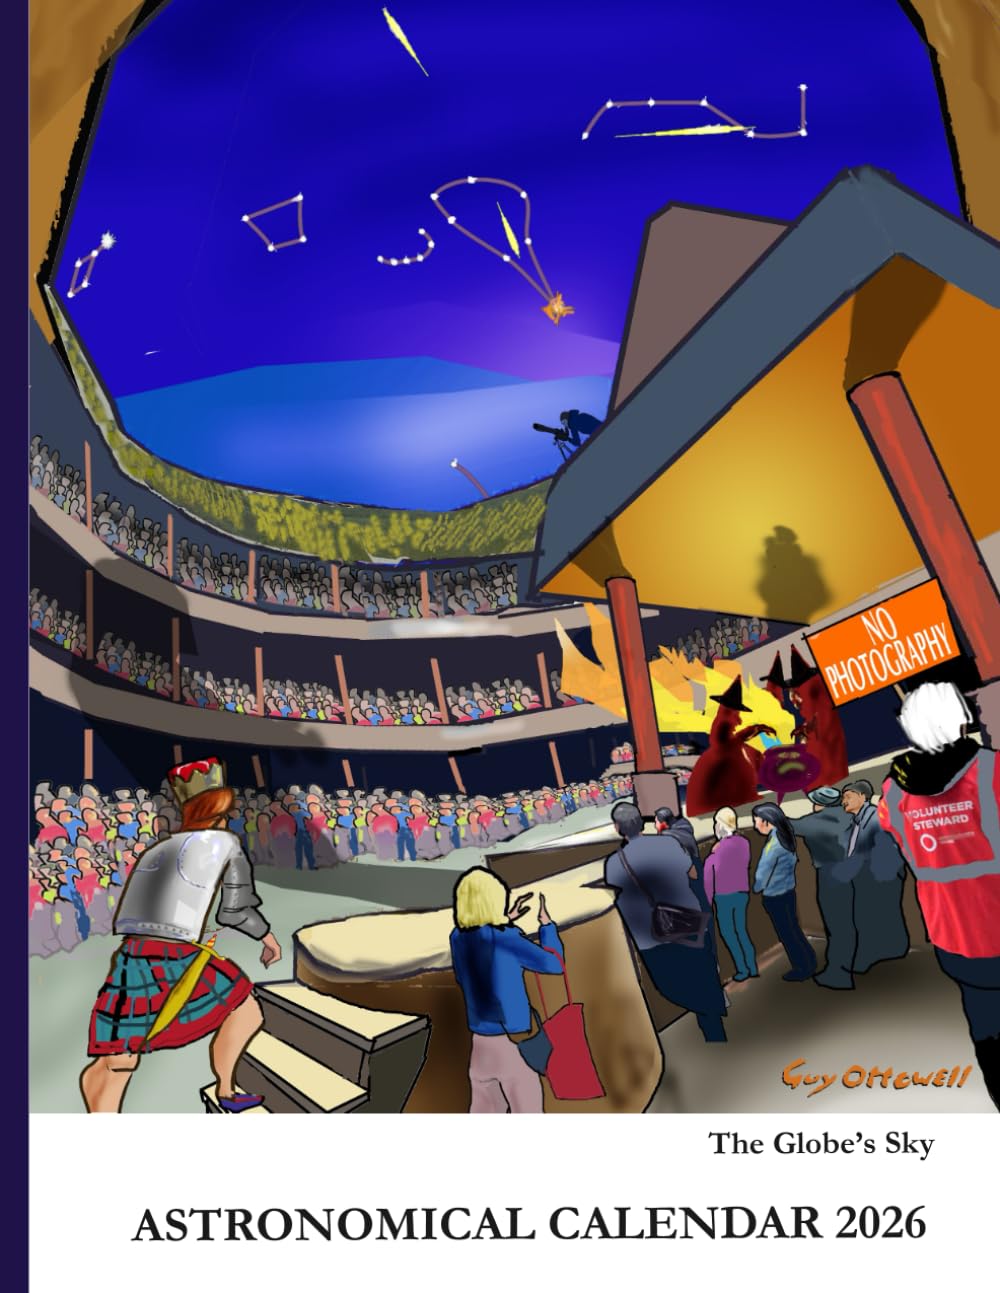
Open the door to the cosmos with the “Astronomical Calendar 2026,” an exquisite guide that transcends mere pages to become your personal companion in the exploration of the universe. As