
Now Reading: Bridging The Atmospheric Circulations Of Hot And Warm Giant Exoplanets
-
01
Bridging The Atmospheric Circulations Of Hot And Warm Giant Exoplanets


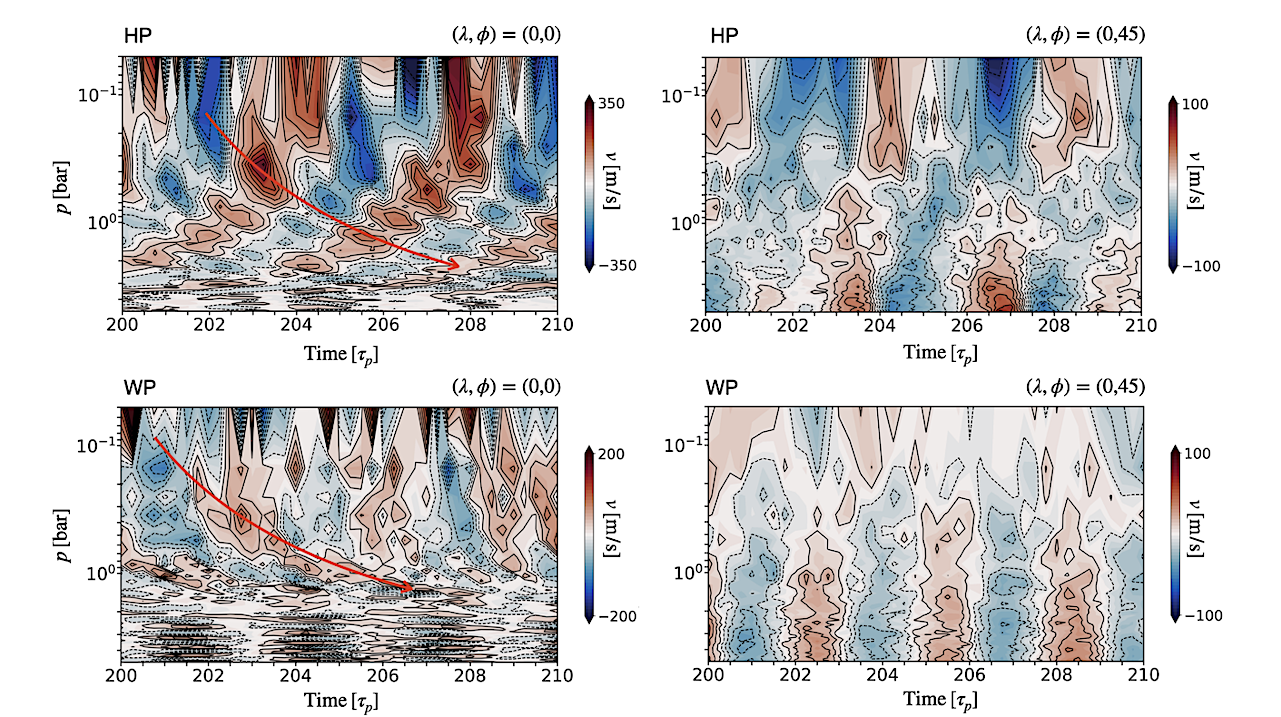
Hovmoller plots showing the time evolution of meridional wind velocity v as a function of pressure for the simulated hot planet (HP) and warm planet (WP) at the substellar point (λ, ϕ) = (0◦, 0◦) (left) and mid-latitudes (λ, ϕ) = (0◦, 45◦) (right) with red and blue colors corresponding to northward and southward flow, respectively. Both planets exhibit oscillations in their equatorial regions with a period of ≲3 τp and a downward propagation in time, as illustrated by red arrows. The HP has higher amplitude and more clear oscillations in v compared to the WP. Rossby waves appear as oscillations in the deep regions of both planets at (λ, ϕ) = (0◦, 45◦). — astro-ph.EP
We perform high-resolution atmospheric flow simulations of hot and warm giant exoplanets that are tidally locked.
The modeled atmospheres are representative of those on KELT-11b and WASP-39b, which possess markedly different equilibrium temperatures but reside in a similar dynamical regime: in this regime, their key dynamical numbers (e.g., Rossby and Froude numbers) are comparable.
Despite their temperature difference, both planets exhibit qualitatively similar atmospheric circulation patterns, which are characterized by turbulent equatorial flows, anticyclonic polar vortices, and large-scale Rossby waves that gives rise to quasi-zonal flows in the extra-tropics (i.e., near ~20 degrees).
Quantitative differences between the KELT-11b and WASP-39b atmospheres reflect their different Rossby deformation scales, which influence the horizontal length scale of wave–vortex interactions and the overall structure of the circulation.
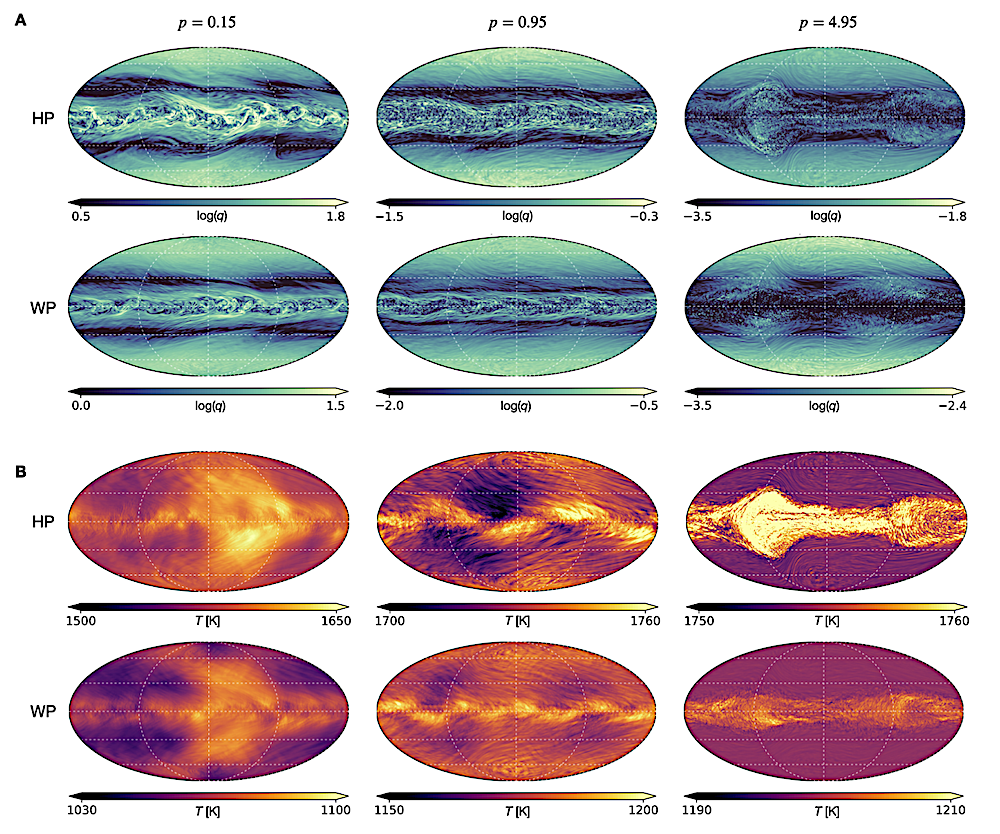
A log(|q(λ, ϕ, p)|), where q is the potential vorticity in units of 10−6 K m2 kg−1 s −1 , and B temperature T(λ, ϕ, p) fields in units of K, at time t = 200 τp for T341L50 simulations of tidally synchronized hot and warm gas giant exoplanets (HP and WP, respectively). Fields are shown for p ∈ {0.15, 0.95, 4.95} bar. These p-levels are near the top, middle, and bottom of the simulation domains. Fields are shown in Mollweide projection, centered on the substellar point (λ, ϕ) = (0◦ , 0◦ ) where λ is the longitude and ϕ is the latitude. White horizontal dashed lines indicate the latitudes ϕ ∈ {0 ◦ , ±30◦ , ±60◦ }, and the white dashed circle indicates the dayside–nightside boundary. — astro-ph.EP
J. W. Skinner, S. Wei
Comments: 10 pages, 5 figures, submitted to APJ
Subjects: Earth and Planetary Astrophysics (astro-ph.EP)
Cite as: arXiv:2505.01397 [astro-ph.EP] (or arXiv:2505.01397v1 [astro-ph.EP] for this version)
https://doi.org/10.48550/arXiv.2505.01397
Focus to learn more
Submission history
From: Jack Skinner
[v1] Fri, 2 May 2025 17:13:42 UTC (8,916 KB)
https://arxiv.org/abs/2505.01397
Astrobiology,


Related Posts
Stay Informed With the Latest & Most Important News
Previous Post
Next Post


Advertisement
-
 01Two Black Holes Observed Circling Each Other for the First Time
 -
 02From Polymerization-Enabled Folding and Assembly to Chemical Evolution: Key Processes for Emergence of Functional Polymers in the Origin of Life
 -
 03Astronomy 101: From the Sun and Moon to Wormholes and Warp Drive, Key Theories, Discoveries, and Facts about the Universe (The Adams 101 Series)
 -
 04True Anomaly hires former York Space executive as chief operating officer
 -
 05Φsat-2 begins science phase for AI Earth images
 -
 06Hurricane forecasters are losing 3 key satellites ahead of peak storm season − a meteorologist explains why it matters
 -
 07Binary star systems are complex astronomical objects − a new AI approach could pin down their properties quickly