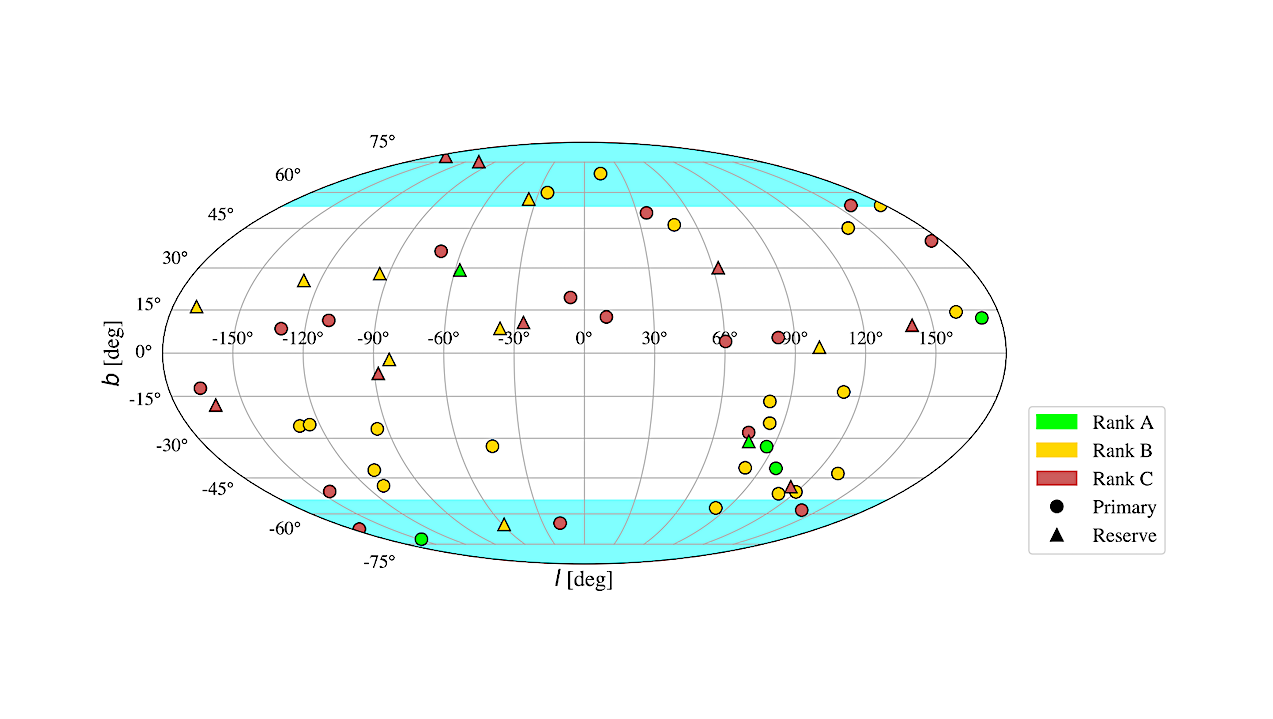
Primary (circles, ≤ 2 mas) and reserve (triangles, 5 mas) candidate reference stars plotted in ecliptic coordinates in epoch J2027 and equinox 2027 with colors indicating rankings. The CVZs are

Primary (circles, ≤ 2 mas) and reserve (triangles, 5 mas) candidate reference stars plotted in ecliptic coordinates in epoch J2027 and equinox 2027 with colors indicating rankings. The CVZs are
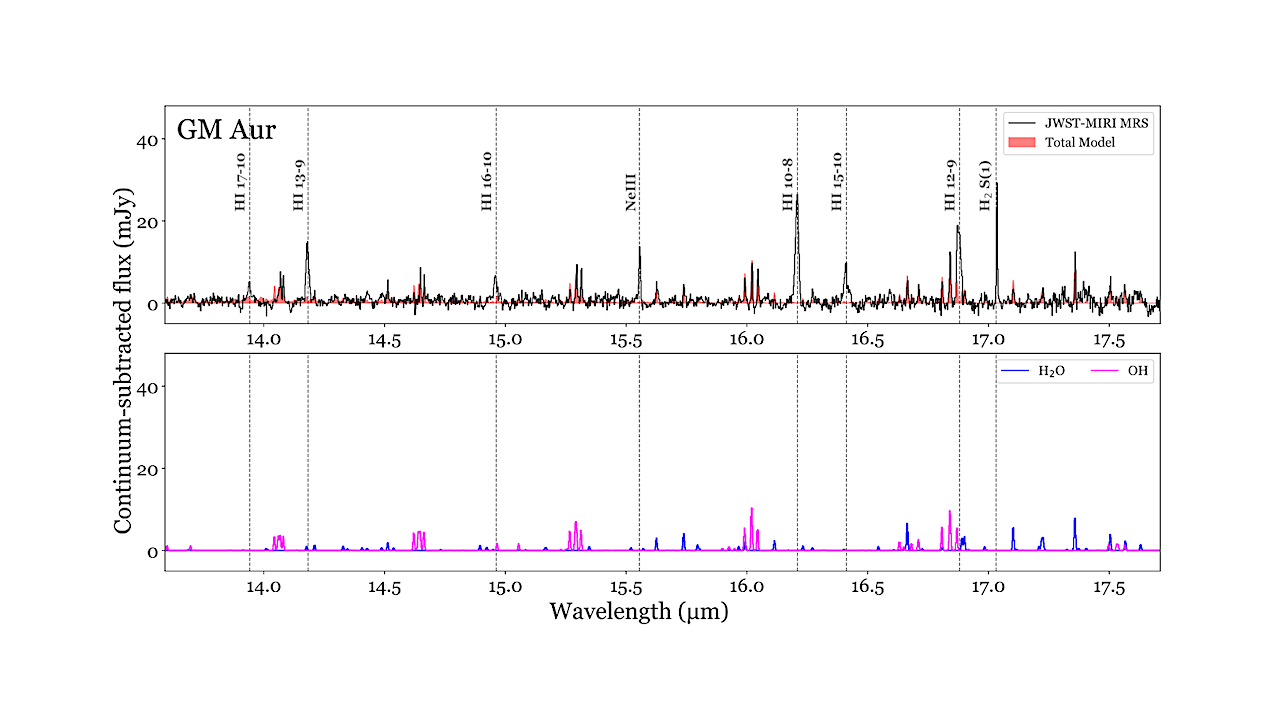
The 13.6 − 17.7 µm range of the GM Aur spectrum. The continuum-subtracted JWST-MIRI data (black, top panel) is overlaid with the total modeled emission (red, top panel) from molecules
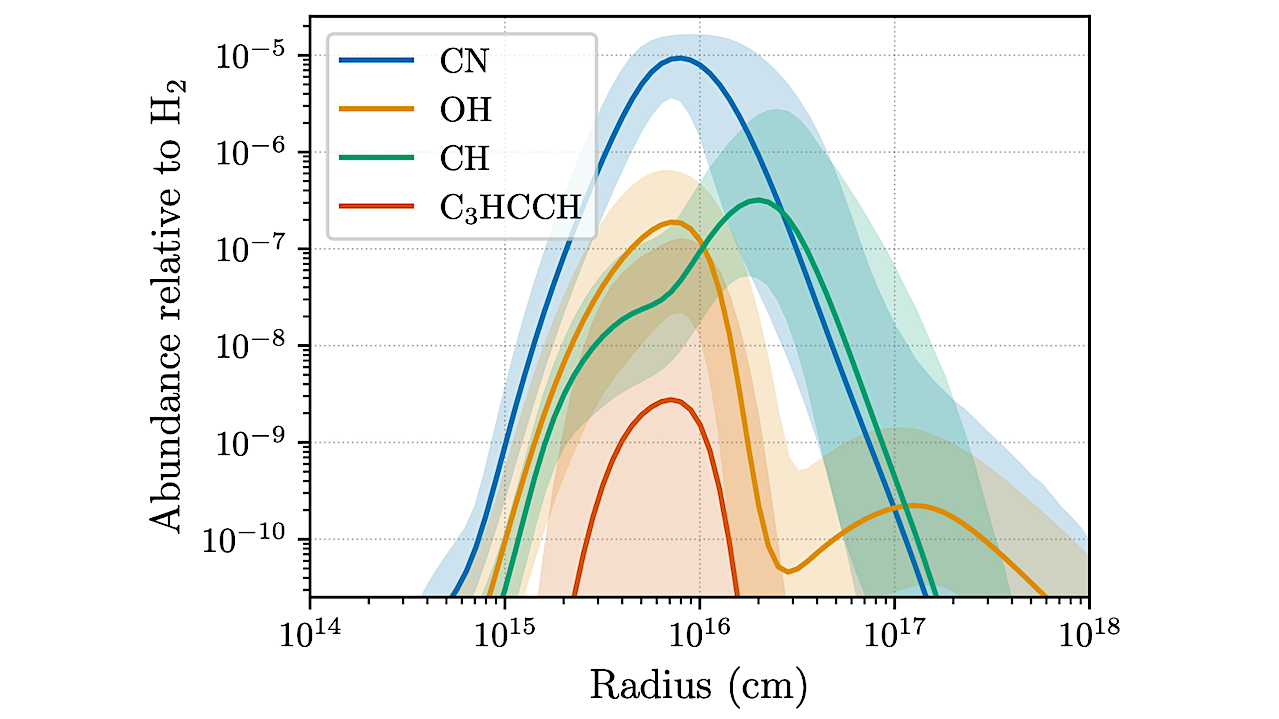
A figure illustrating the sensitivity of a carbon rich stellar outflow with a MCMC sampler varying reaction rates of the entire network. — astro-ph.GA Since the first observations of interstellar
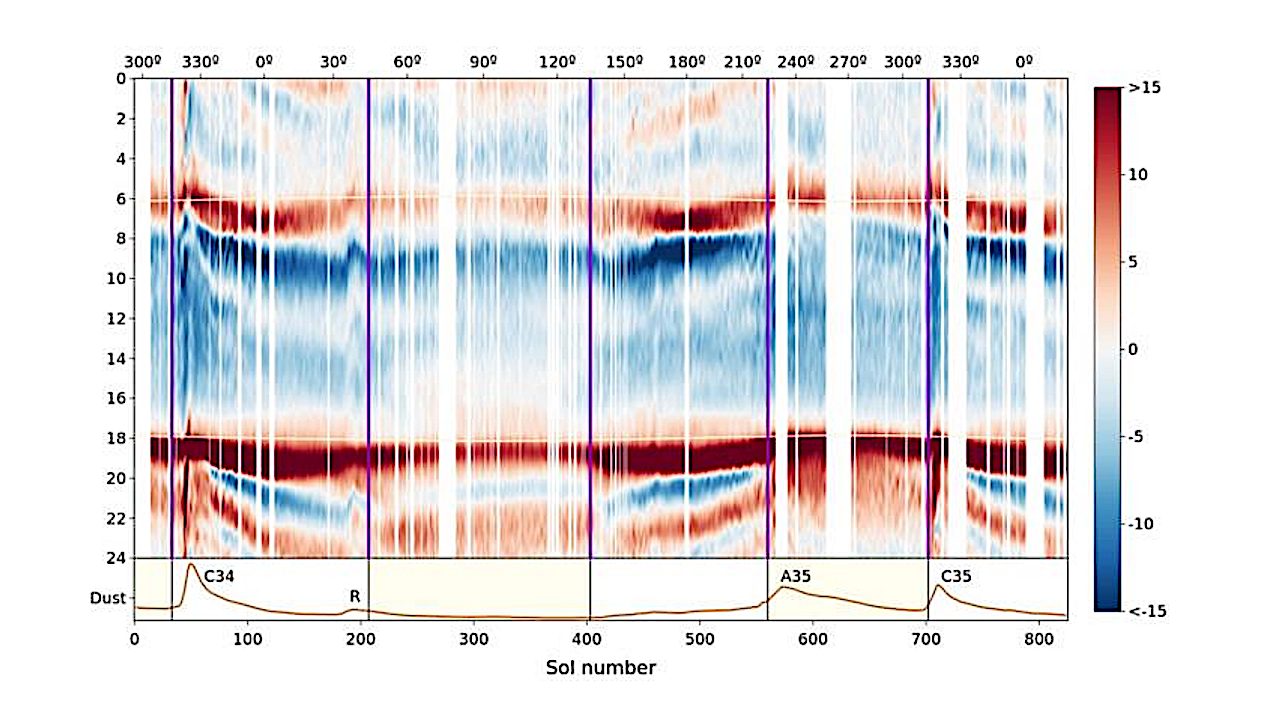
Climatology of diurnal pressure variation (dP/dt) in units of Pa h⁻¹. High-frequency signals (with periods shorter than 3,700 s) were removed from the original time series prior to differentiation. Sunrise
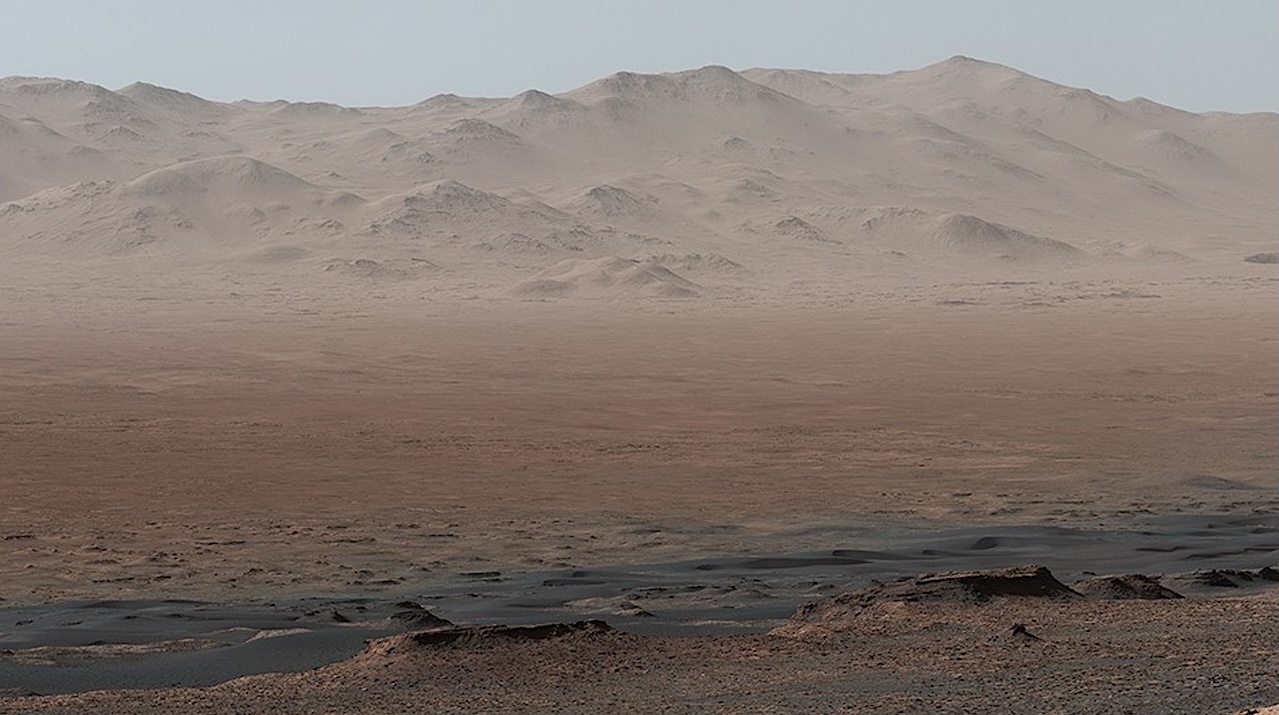
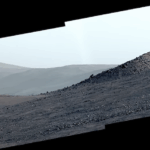
A vantage point on “Vera Rubin Ridge” provided NASA’s Curiosity Mars rover this detailed look back over the area where it began its mission inside Gale Crater, plus more-distant features
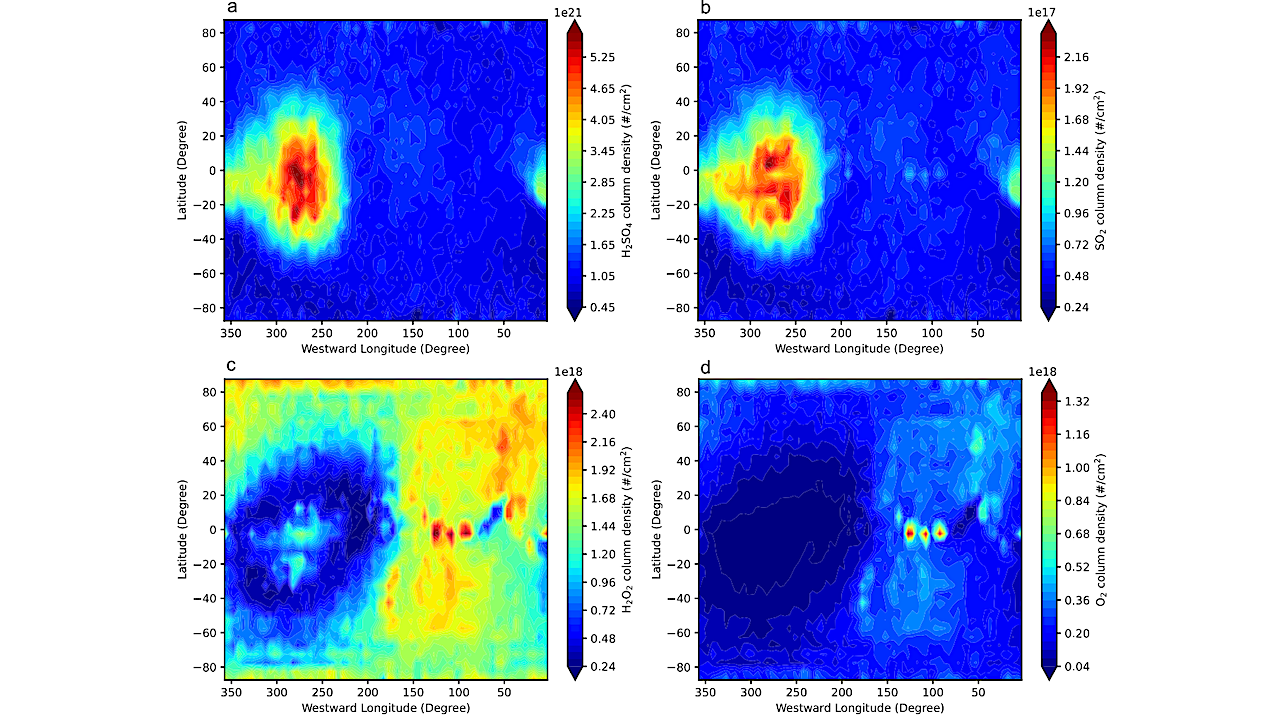
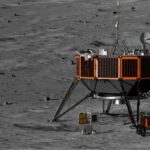
Global distribution of the four major nonwater species in Europa’s surface ice with reaction rate coefficients scaled down by a factor of 10. (a) H2SO4. (b) SO2. (c) H2O2. (d)
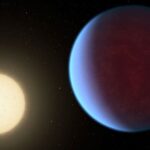
This artist’s impression shows a coronal mass ejection (CME) around another star. We see these eruptions coming often from the Sun. During a CME, massive amounts of material are flung
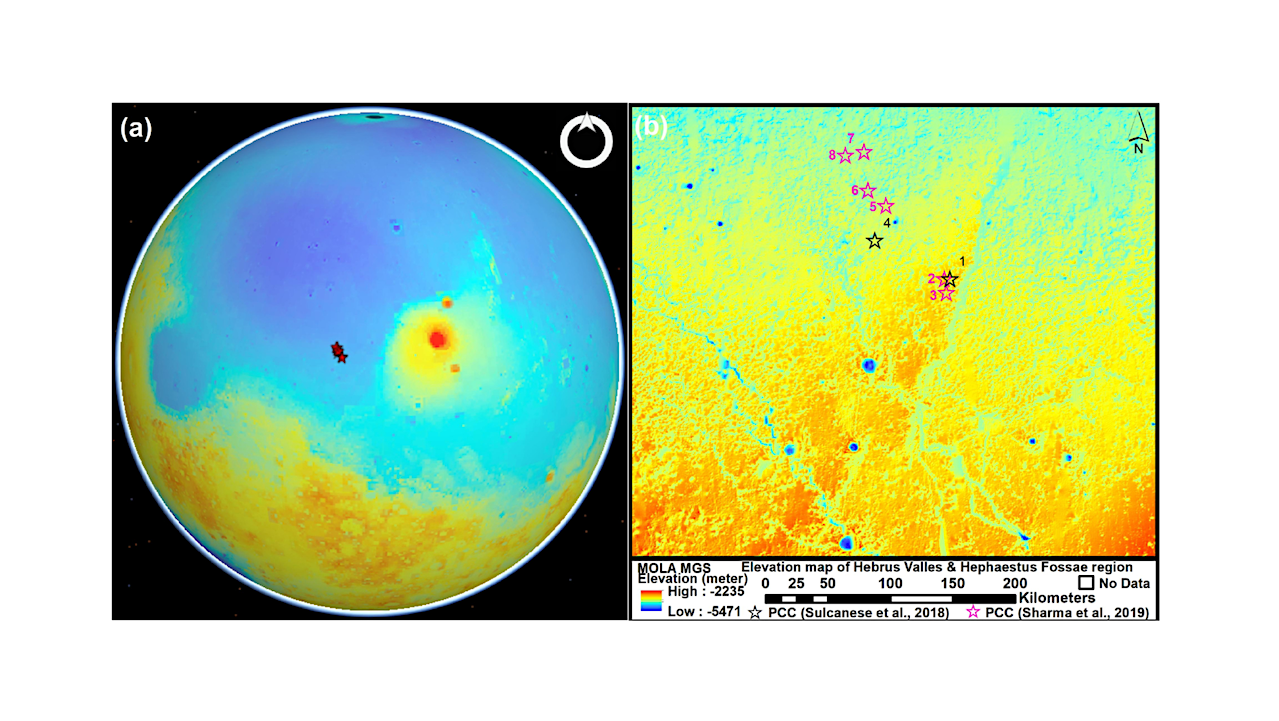
Regional context and geospatial distribution of potential karstic skylight features in Hebrus Valles, Mars. (a) Mars Orbiter Laser Altimeter (MOLA) global topography illustrating the location of Hebrus Valles relative to
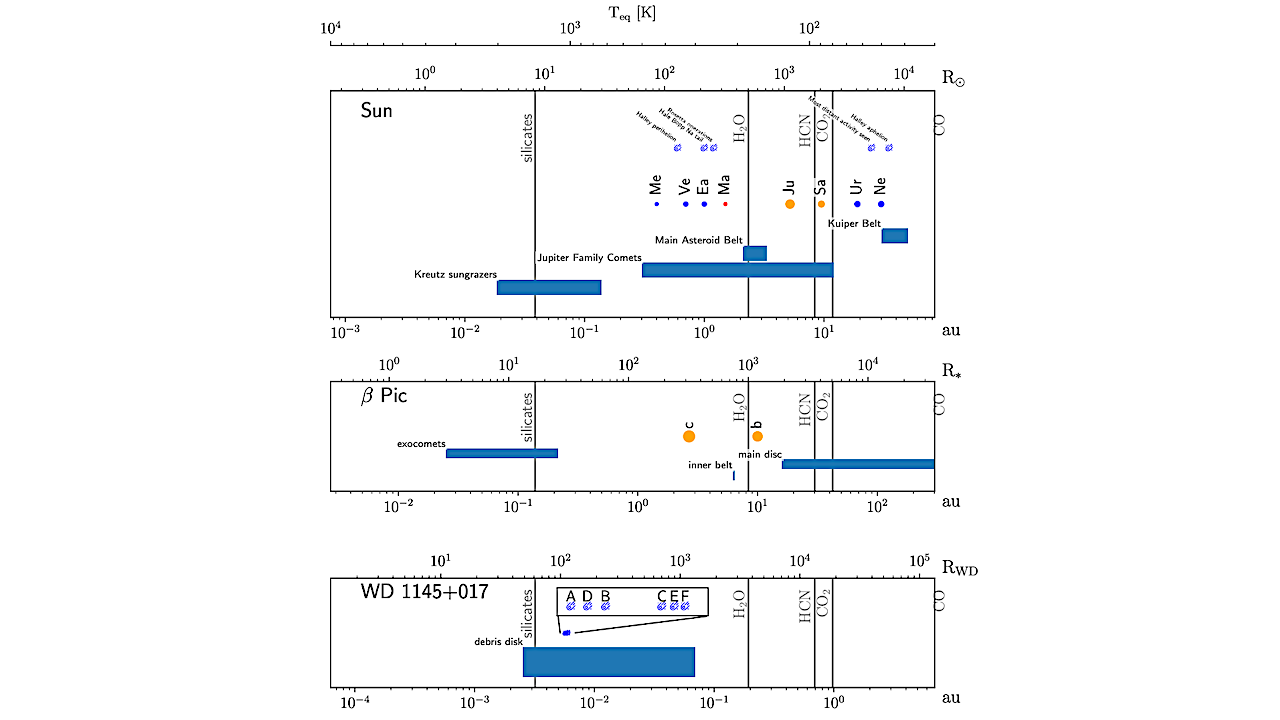
The distribution of planets, main comet and asteroid belts around the Sun, and the equivalent analogues for Beta Pictoris and WD 1145+017. All distances are logarithmic, scaled such that they
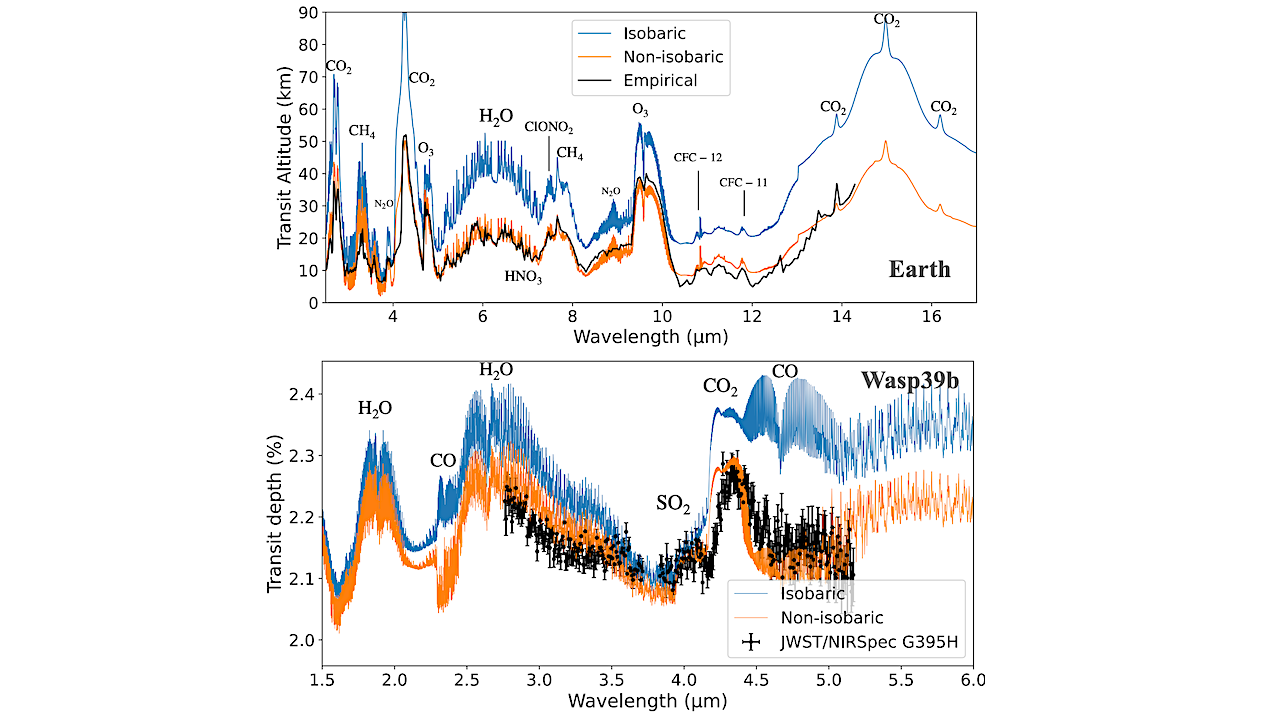
Comparison between the analytical transmission models and the empirical spectra. Top: Earth’s transmission spectrum from Macdonald & Cowan (2019, 2023) derived from ACE-FTS solar-occultation measurements. The empirical spectrum is shown