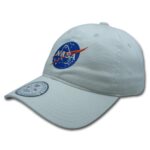
(Left) Predicted concretion diameter for different nucleation density scaling exponents α. For α ≤ 1, diffusion controls at the Mars dust grain size and predictions match observations (green band). For

(Left) Predicted concretion diameter for different nucleation density scaling exponents α. For α ≤ 1, diffusion controls at the Mars dust grain size and predictions match observations (green band). For
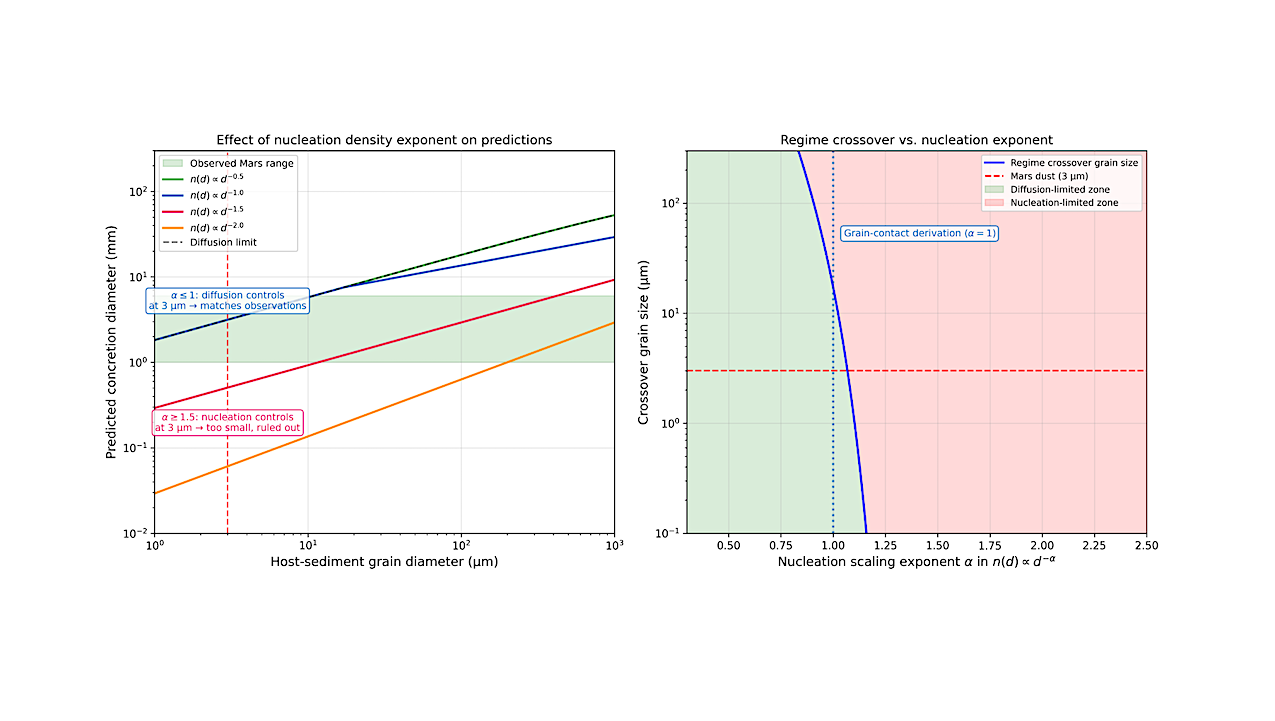
Pollux instrument concept schematic diagram. — astro-ph.IM Pollux is a candidate European instrument contribution to the Habitable Worlds Observatory (HWO), designed to advance our understanding of the formation and evolution
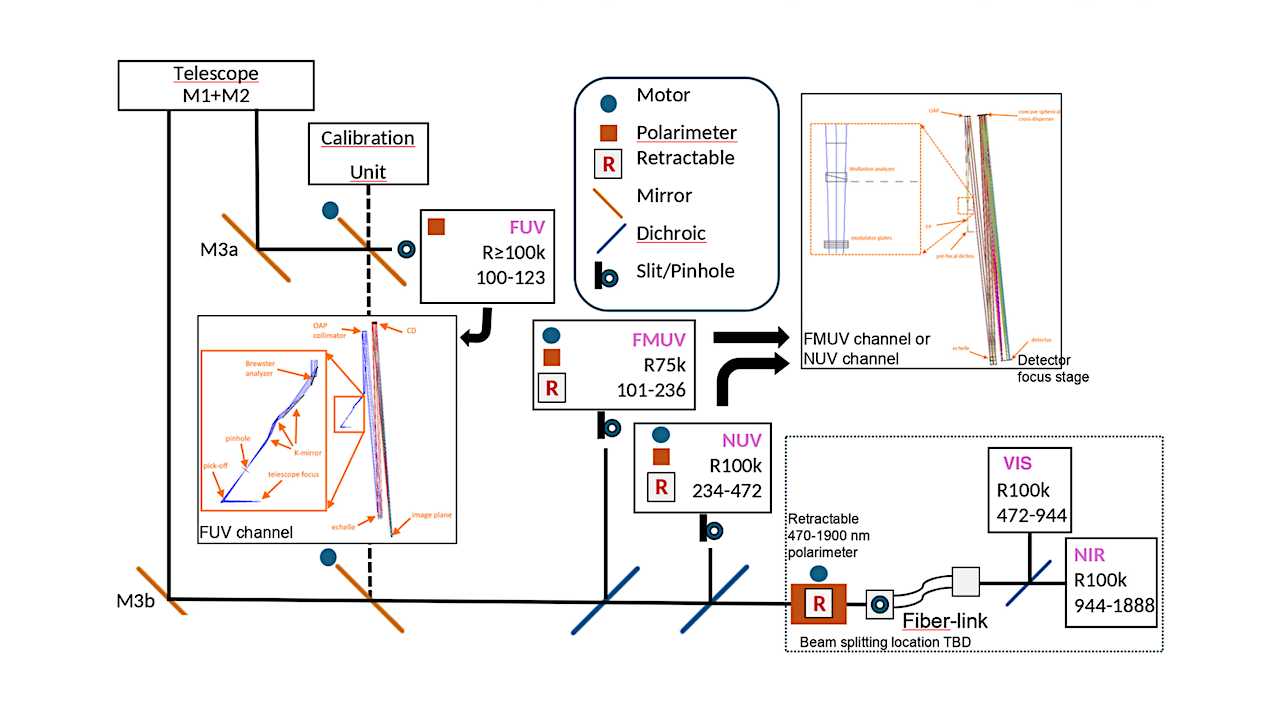
CH3OH/H2O column density ratio found in the literature for a wide range of clouds, YSOs and Solar System comets (see Sect 4.1 for the references). The values for molecular clouds,
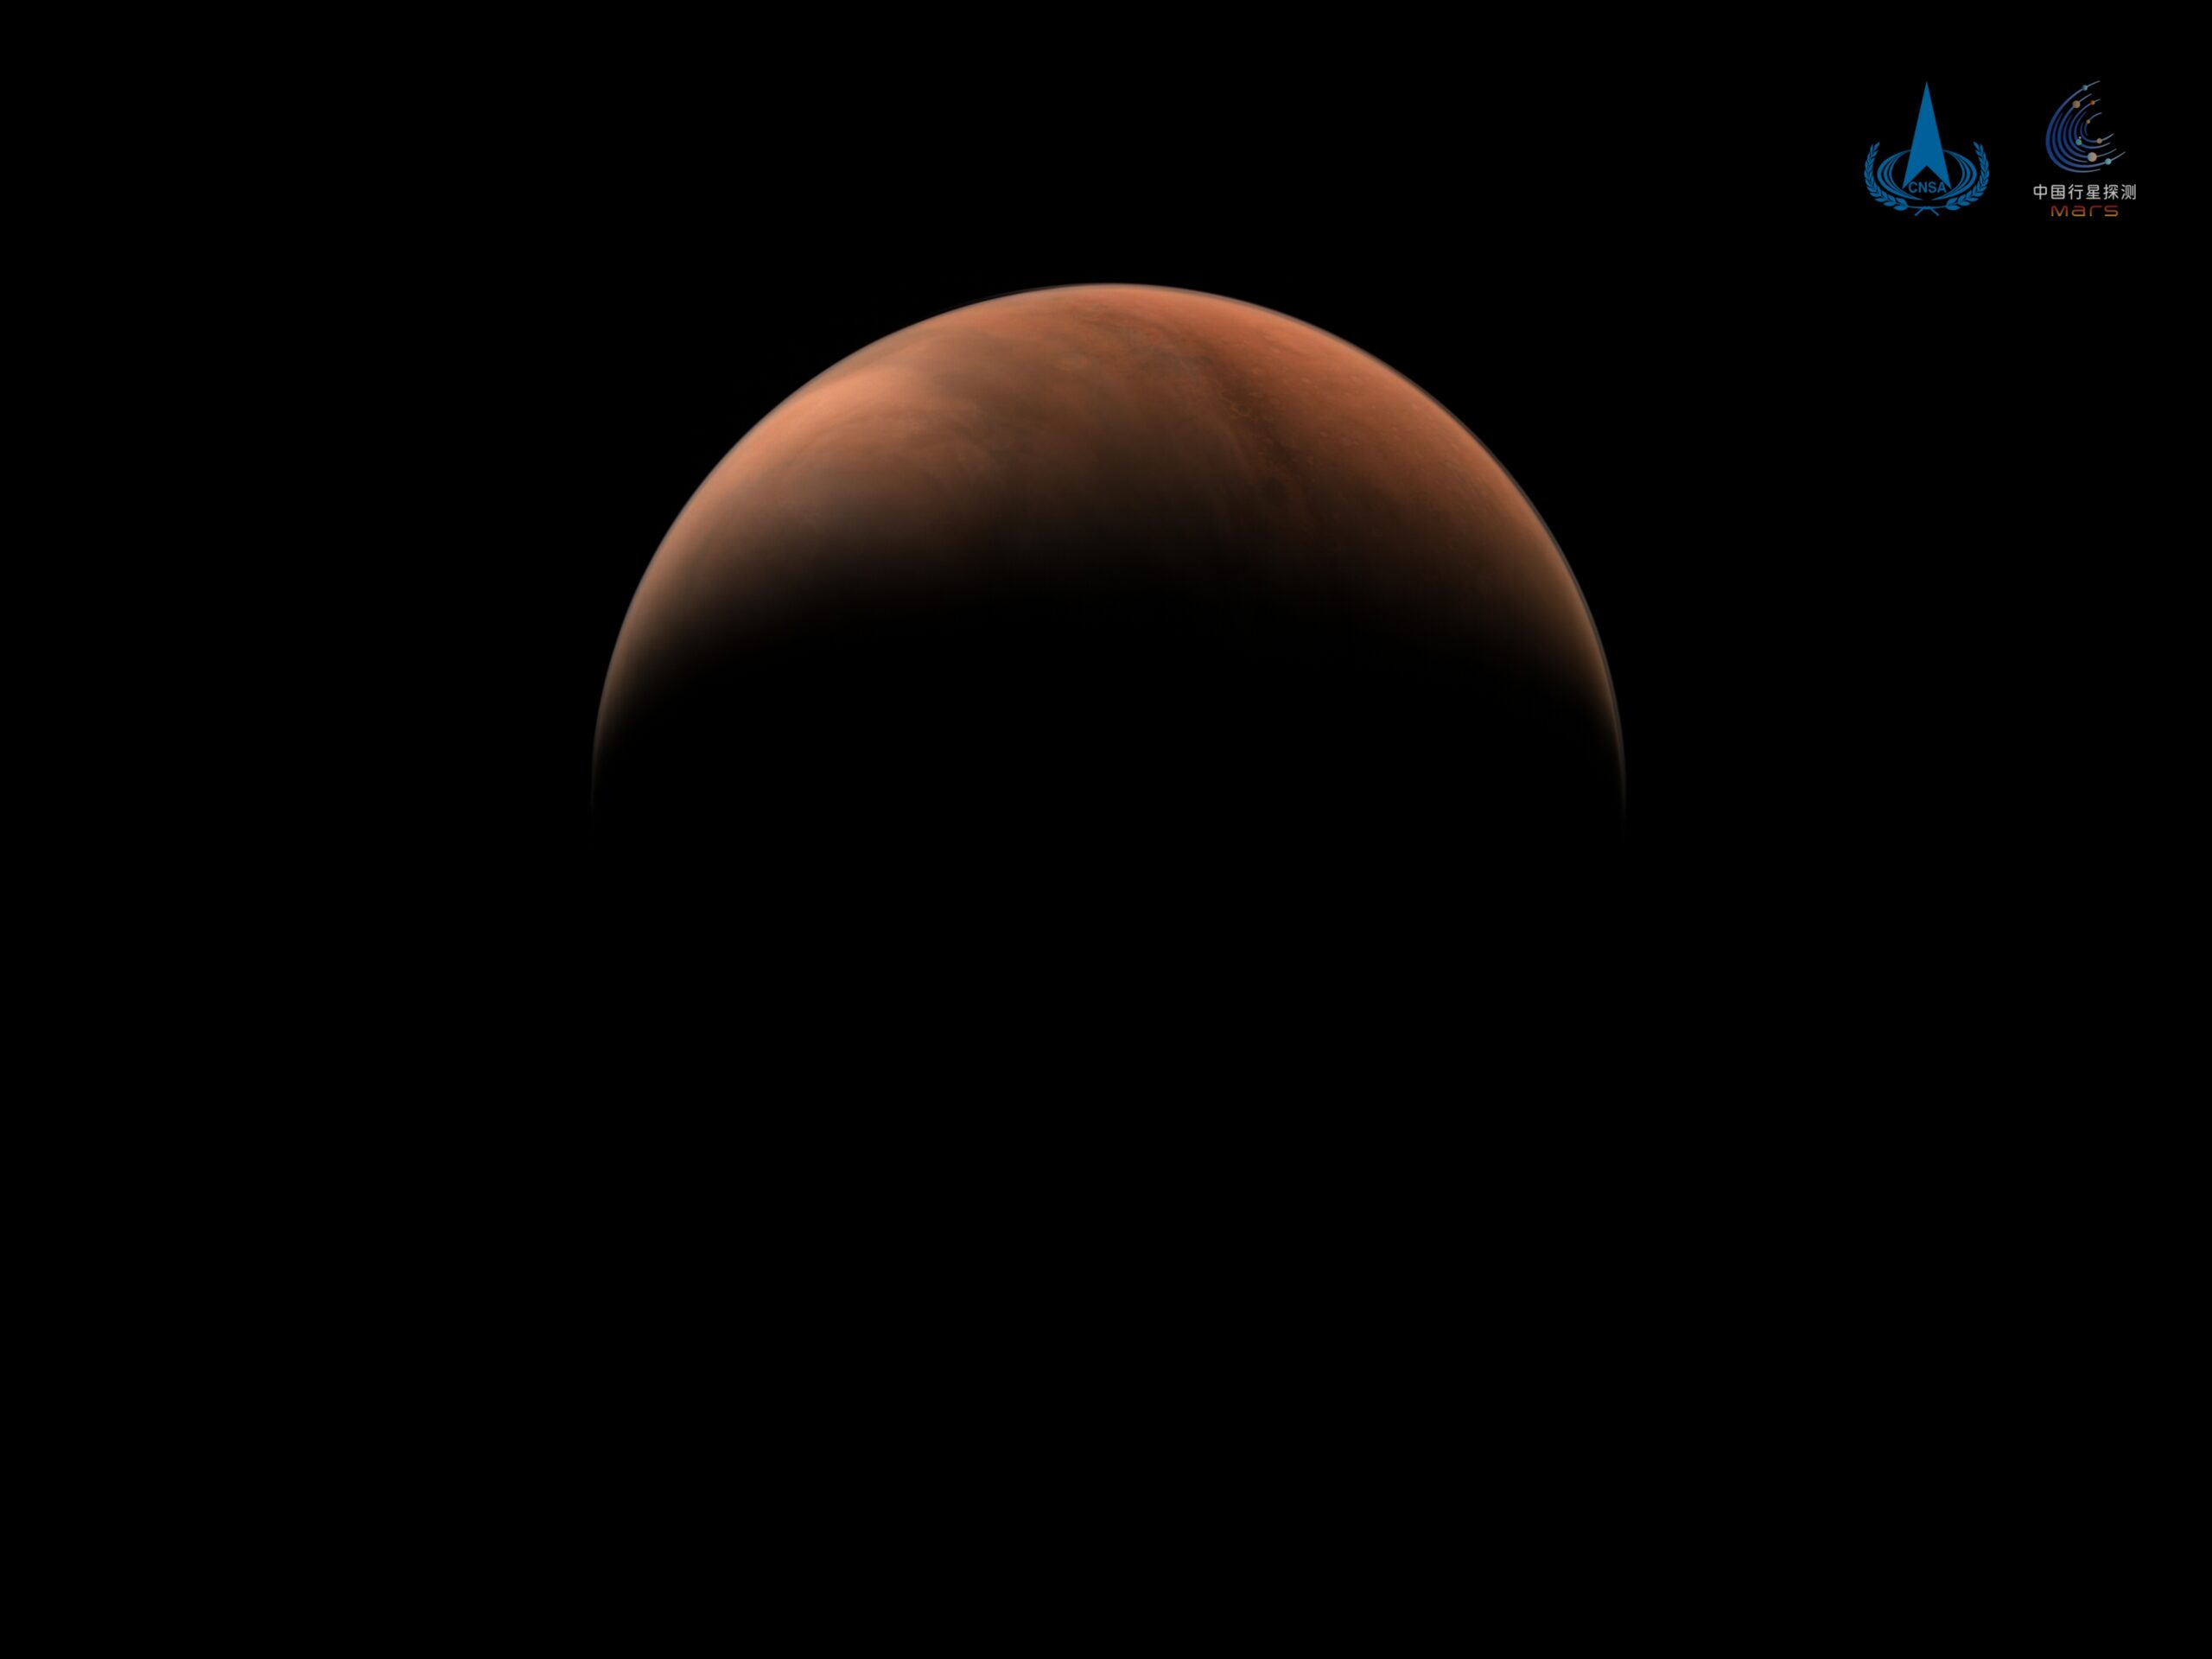
ESPOO, Finland — China’s Tianwen-3 Mars sample return mission is entering flight hardware development, targeting a late 2028 launch to seek out biosignatures on the Red Planet. The mission has
The Andromeda Strain On this date in 1971 the Astrobiology / Planetary Protection – themed film “Andromeda Strain” had begun playing in theaters. The film was based on the late
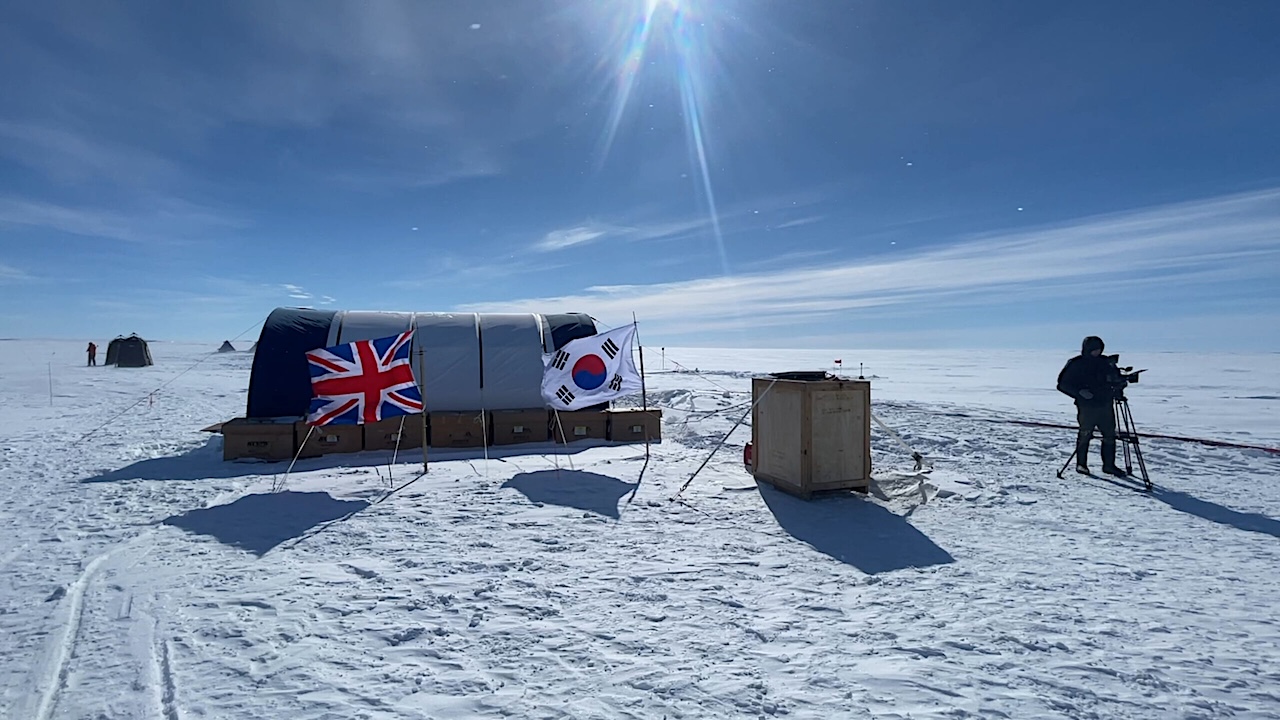
Drilling Base Camp, Thwaites Glacier in West Antarctica — BAS A team of researchers from the UK and Korea has reached the most inaccessible and least-understood part of Thwaites Glacier
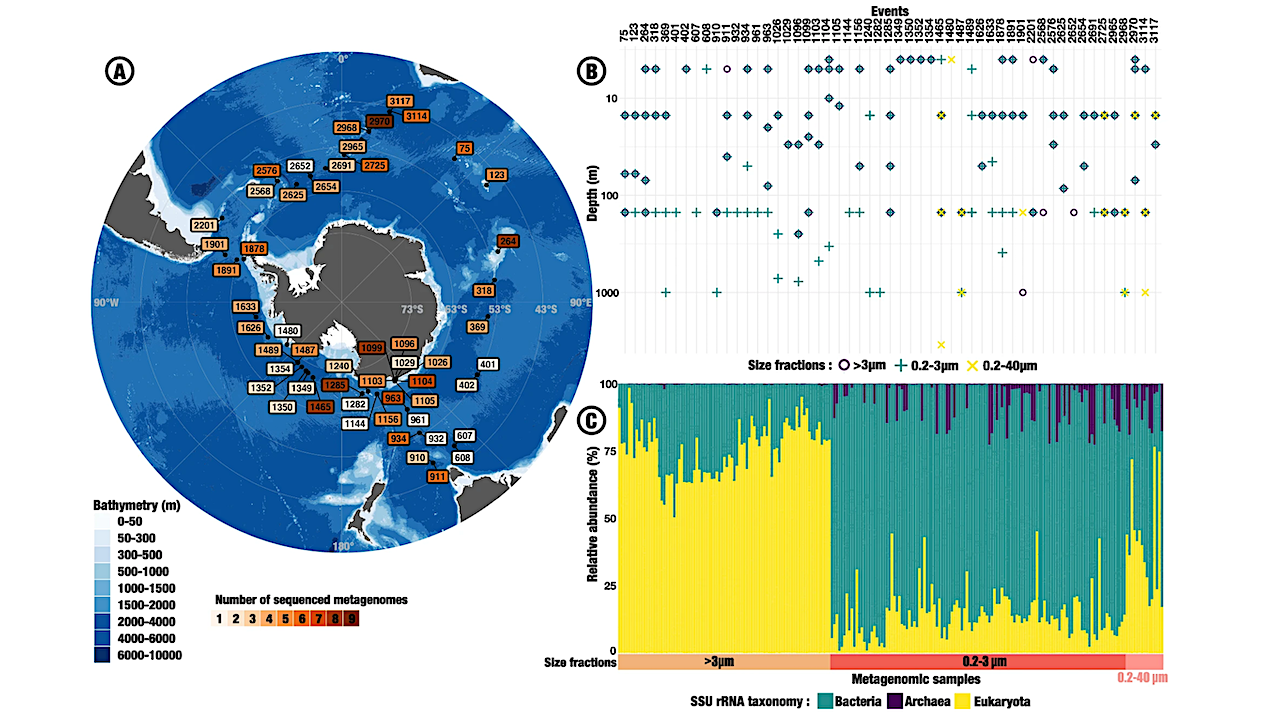
A Map of CTD downcast events on which metagenomics samples were taken, colored according to the number of samples taken on the cast. — Nature Communications The researchers analyzed DNA
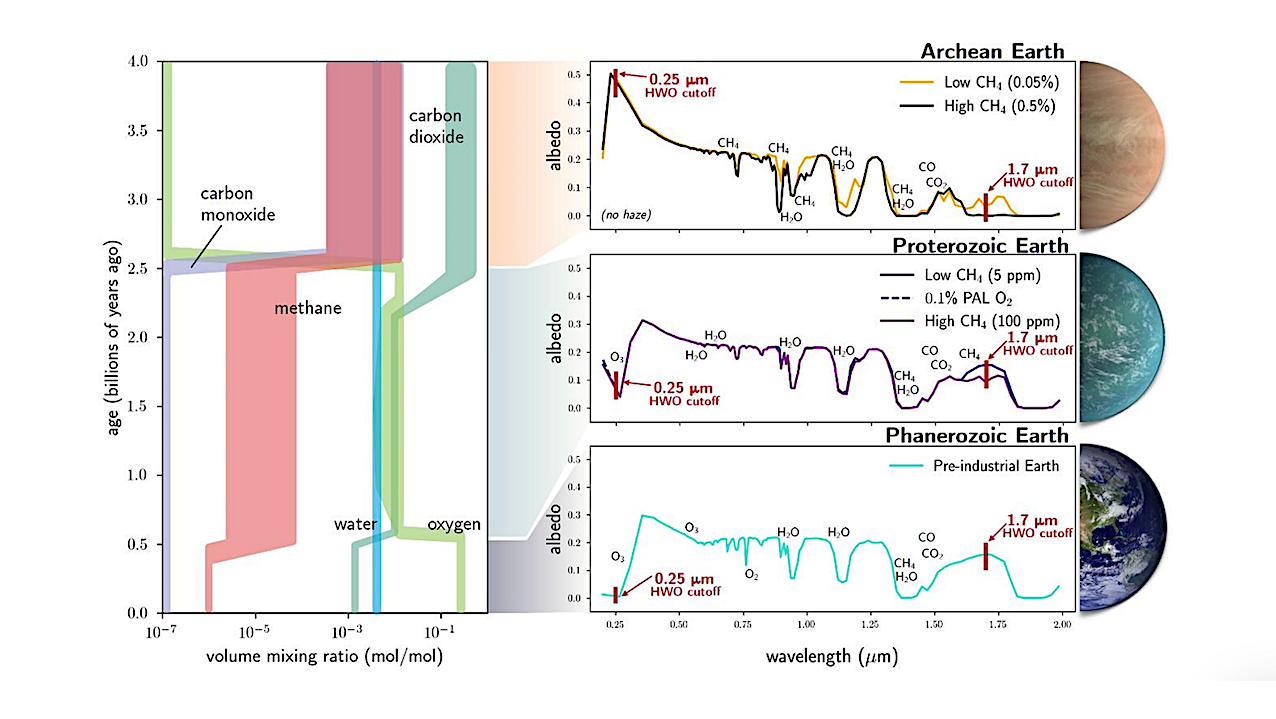
Earth’s spectrum over time (right panel), reproduced from . The biosignature gases present change dramatically from epoch to epoch (left panel), producing significantly different spectra. The simultaneous detection of O2
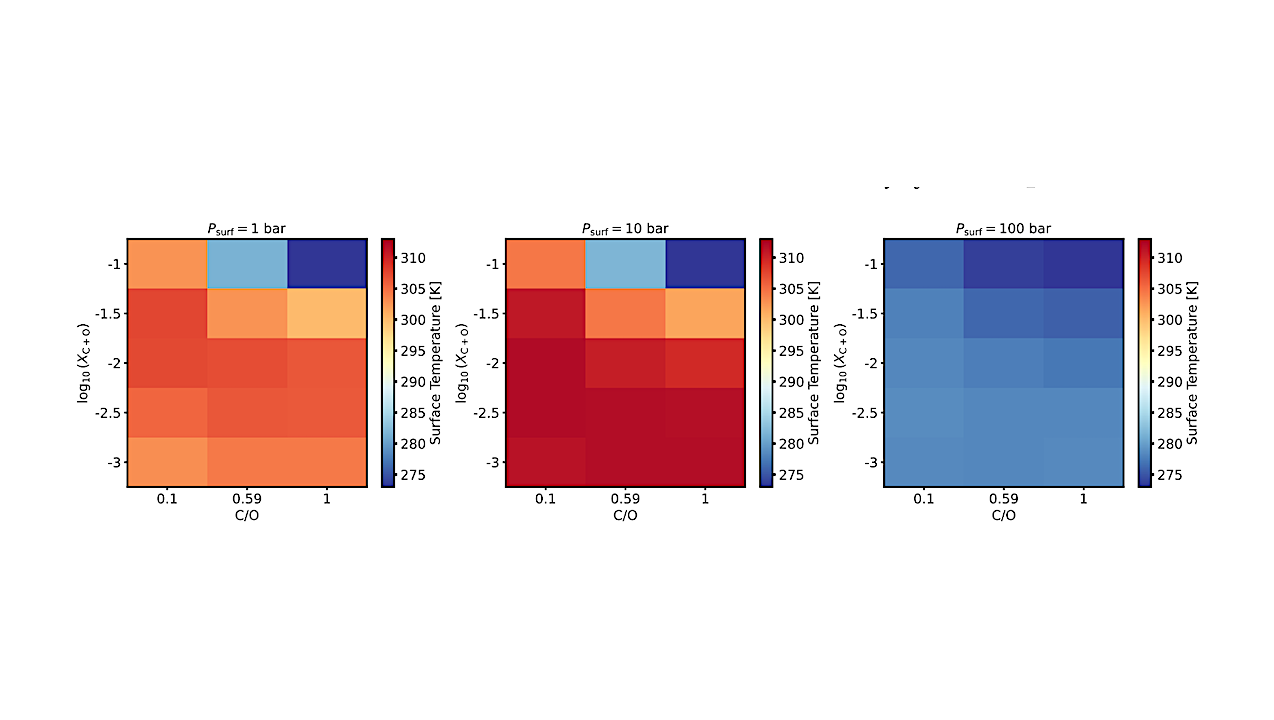
Surface temperatures Tsurf (𝑋C+O, C/O) for varying Psurf (from left to right: 1, 10, and 100 bar). For comparability, the internal temperatures Tint (185, 104, and 56 K, respectively) were
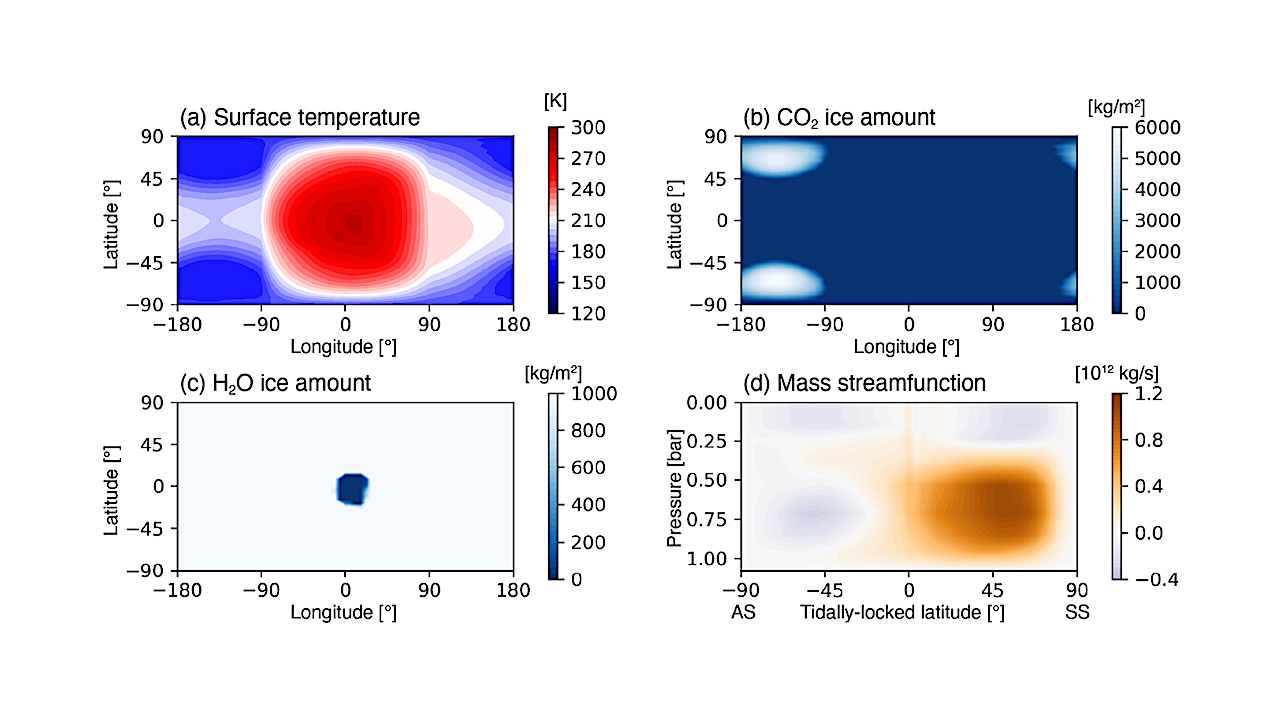
Atmospheric conditions in the case with Sp = 0.4 S0, pN2 = 1.0 bar, pCO2 = 0.1 bar. Each case shows (a) horizontal distribution of surface temperature, (b) horizontal distribution