Explore This Section Science Courses & Curriculums for… From City Lights to Moonlight:… Overview Learning Resources Science Activation Teams SME Map Opportunities More Science Activation Stories Citizen Science 4

Explore This Section Science Courses & Curriculums for… From City Lights to Moonlight:… Overview Learning Resources Science Activation Teams SME Map Opportunities More Science Activation Stories Citizen Science 4
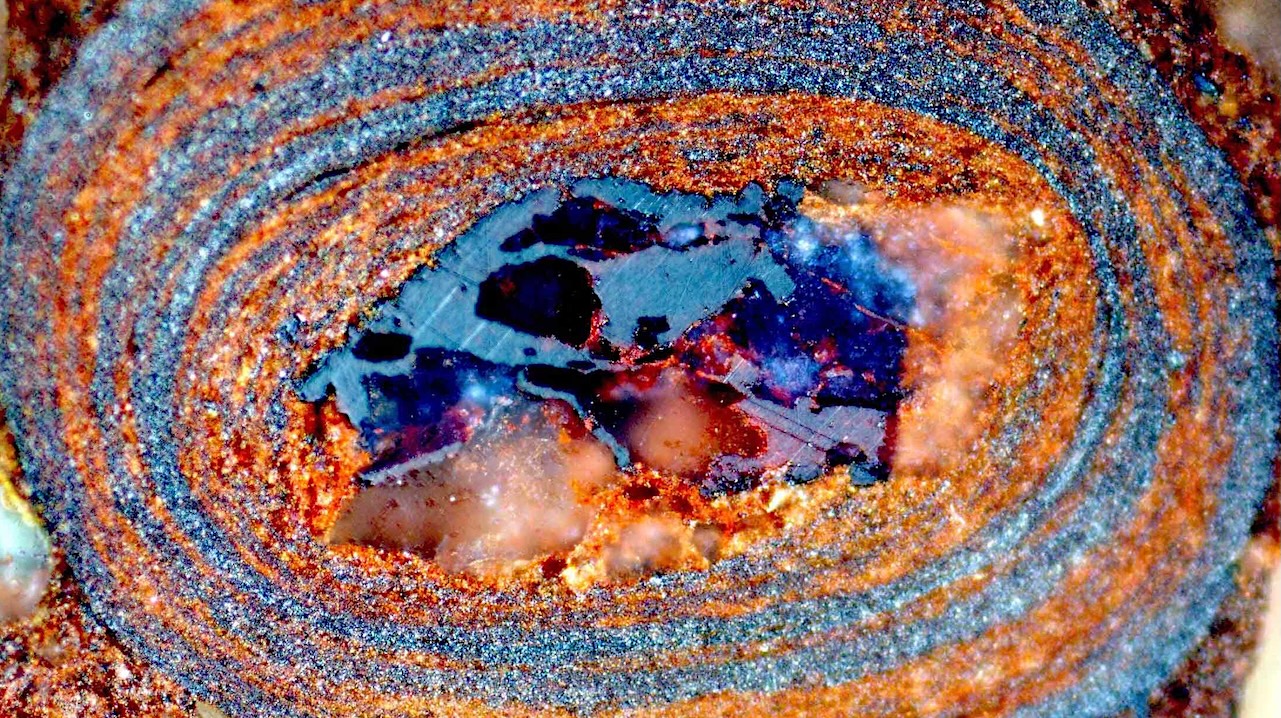
Cross-section of an egg-shaped iron oxide stone: It holds information about the amount of organic carbon in the sea millions of years ago, much like a time capsule. (Image: Nir
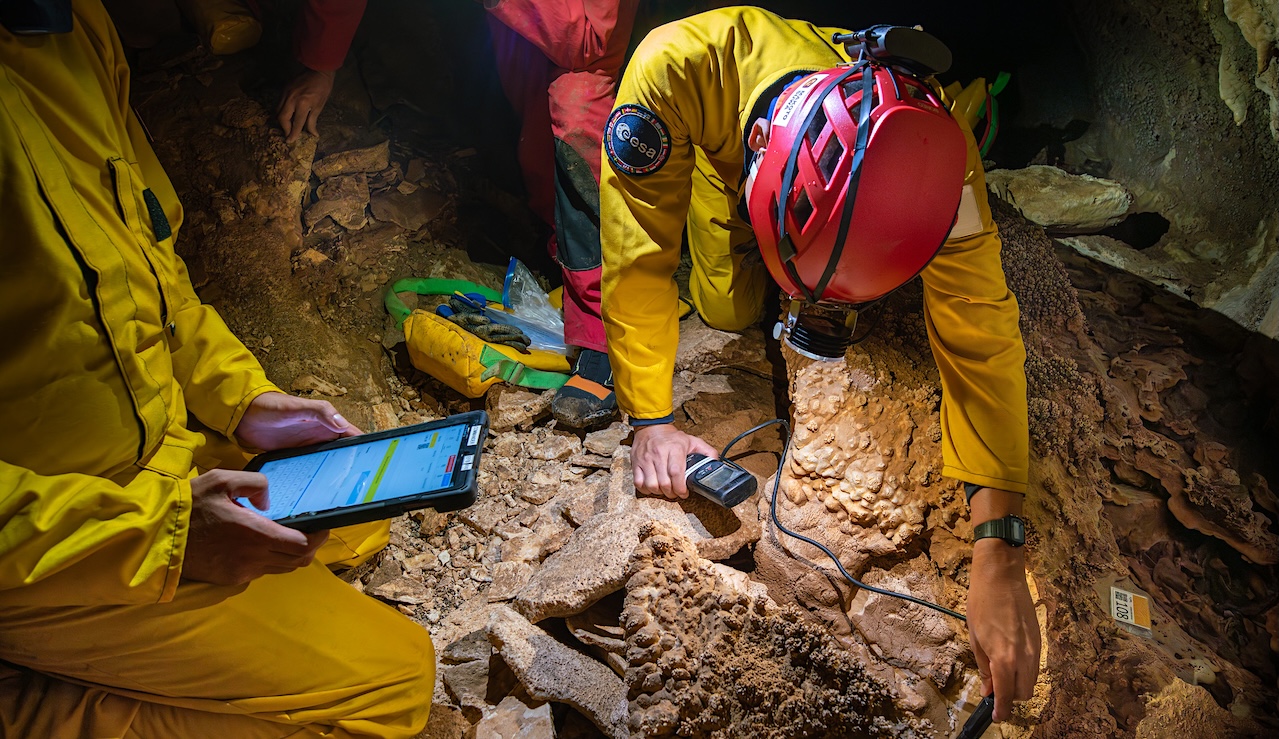
Keith Cowing Explorers Club Fellow, ex-NASA Space Station Payload manager/space biologist, Away Teams, Journalist, Lapsed climber, Synaesthete, Na’Vi-Jedi-Freman-Buddhist-mix, ASL, Devon Island and Everest Base Camp veteran, (he/him) 🖖🏻 Follow on
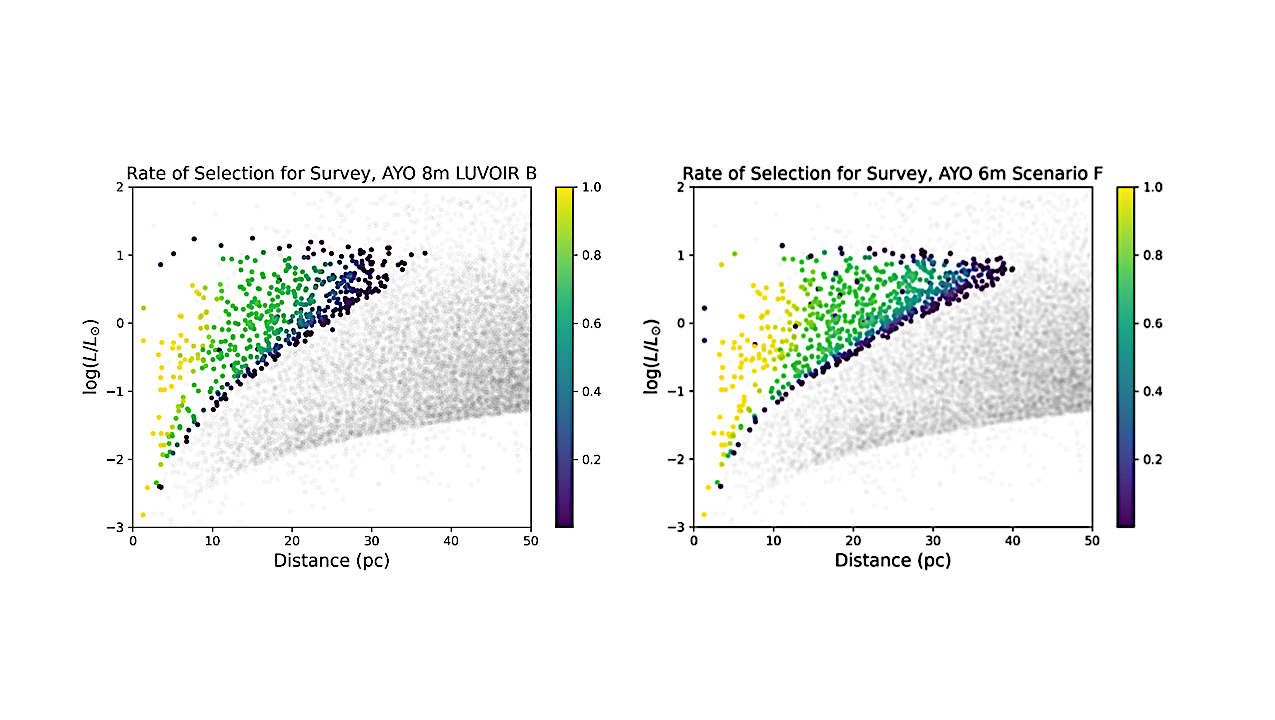
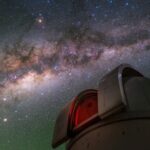
Stars selected by the AYO (Stark et al. 2024) 8m LUVOIR B yield calculation (left) and the 6m ”scenario F” yield calculation (right) in distance vs. luminosity space. Points are
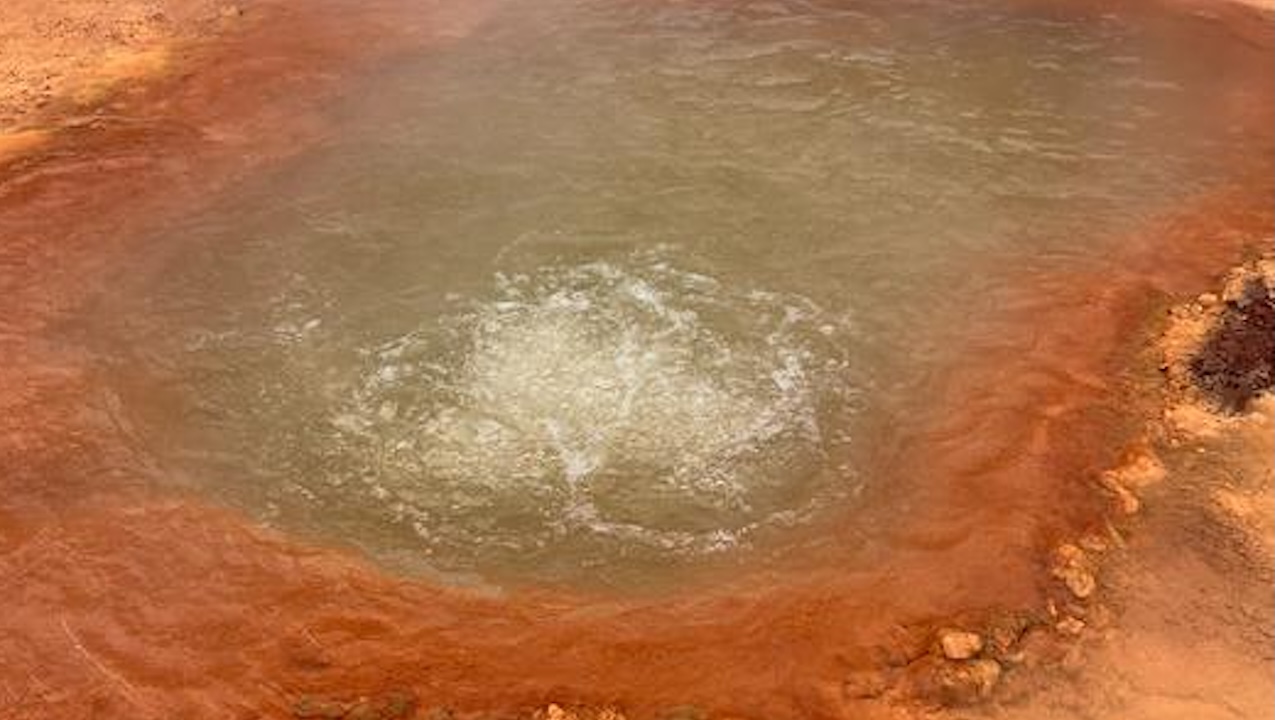
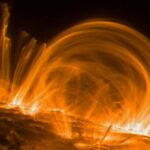
A panoramic picture of one of five hot springs during winter, showing the source water and CO2 bubbles. Credit Fatima Li-Hau, ELSI Earth was not always the blue-green world we
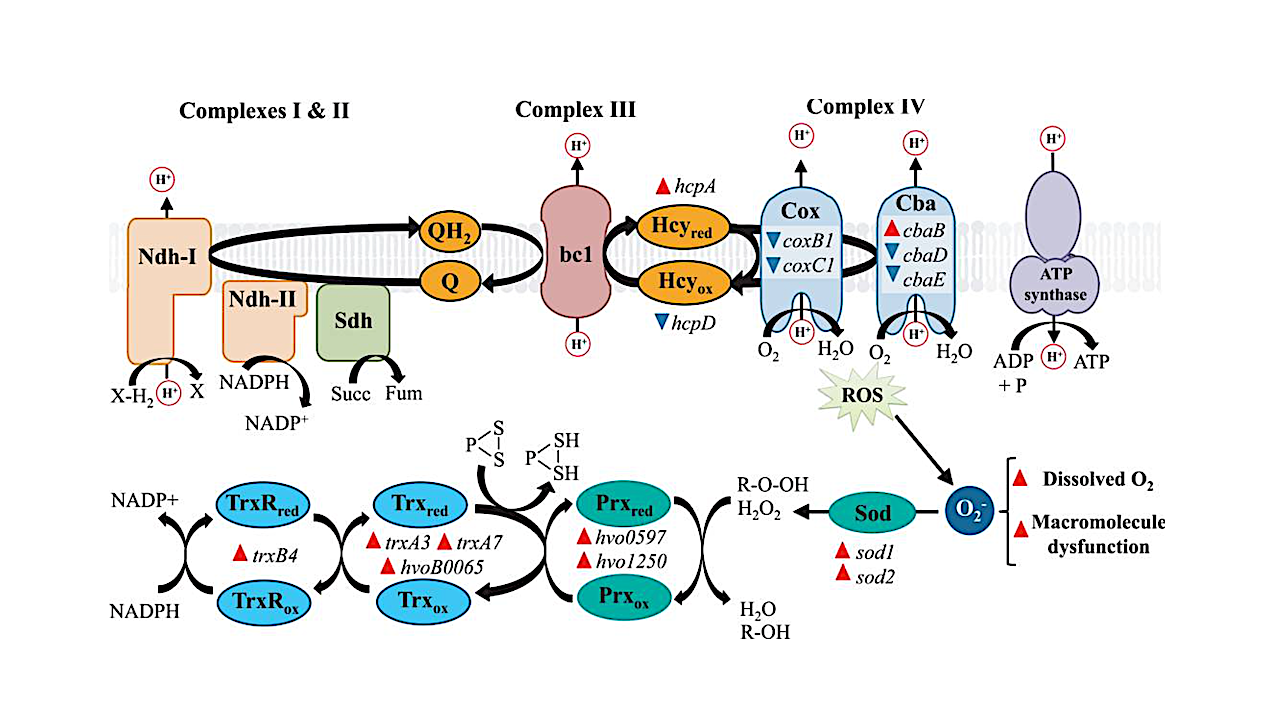
Perchlorate affects the expression of genes involved in ETC, oxidative phosphorylation, and removal of oxidative species. Gene names of DEGs belonging to those processes are shown. Expression changes of DEGs
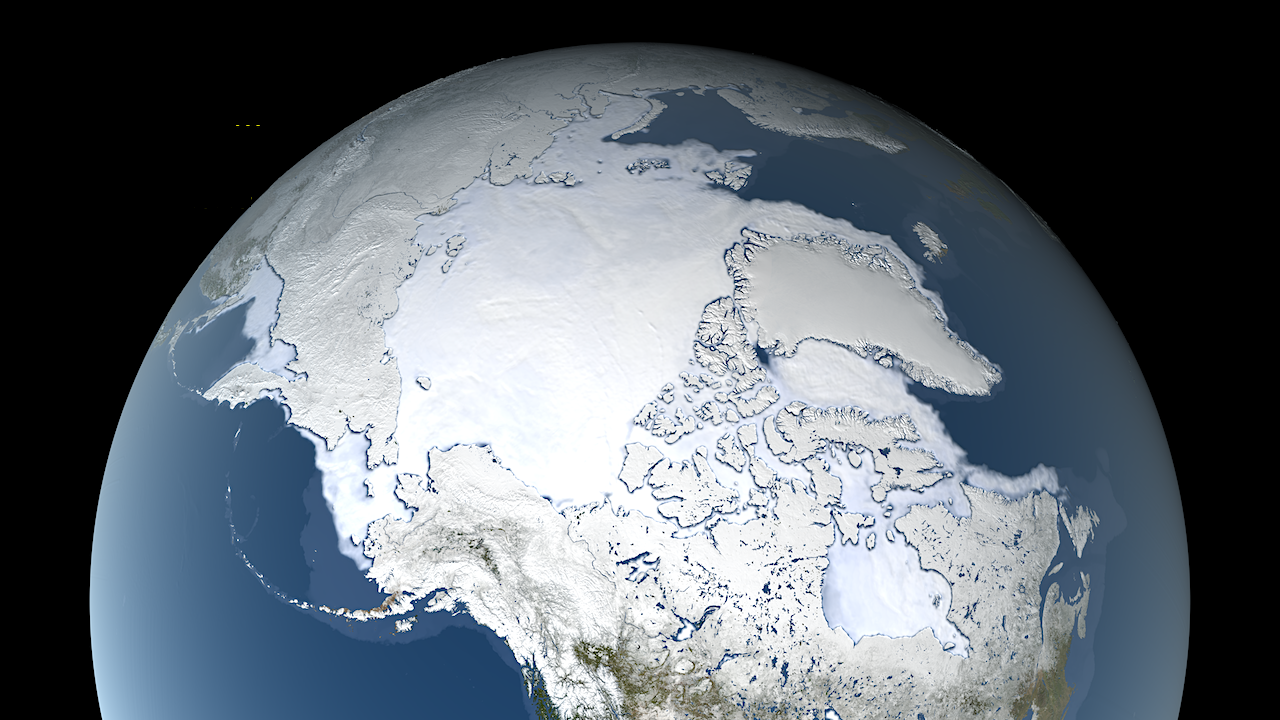
Arctic sea ice maximum extent 2025, still image — NASA UC Riverside researchers have discovered a piece that was missing in previous descriptions of the way Earth recycles its carbon.
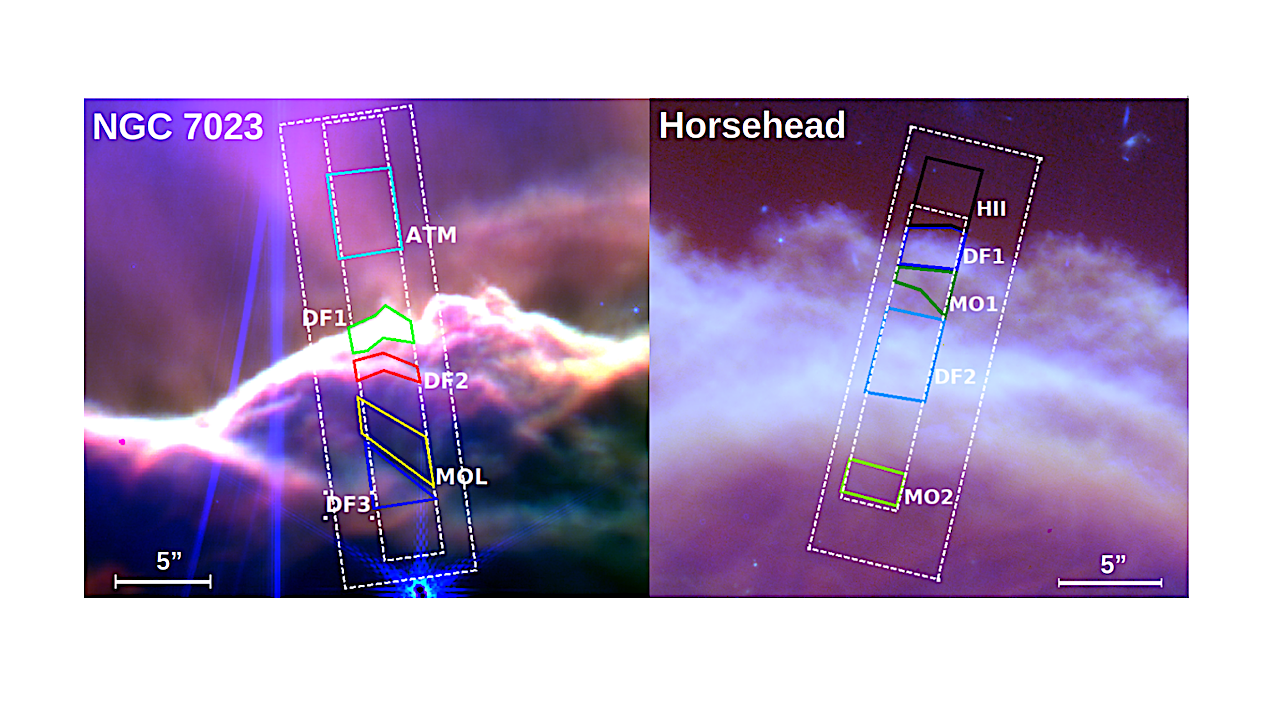
Extractions regions on images (blue = NRC-F210M, green = NRC-F335M, red = MIR-F770W) of NGC 7023 (left) and the Horsehead (right). The exciting star is off the top of the
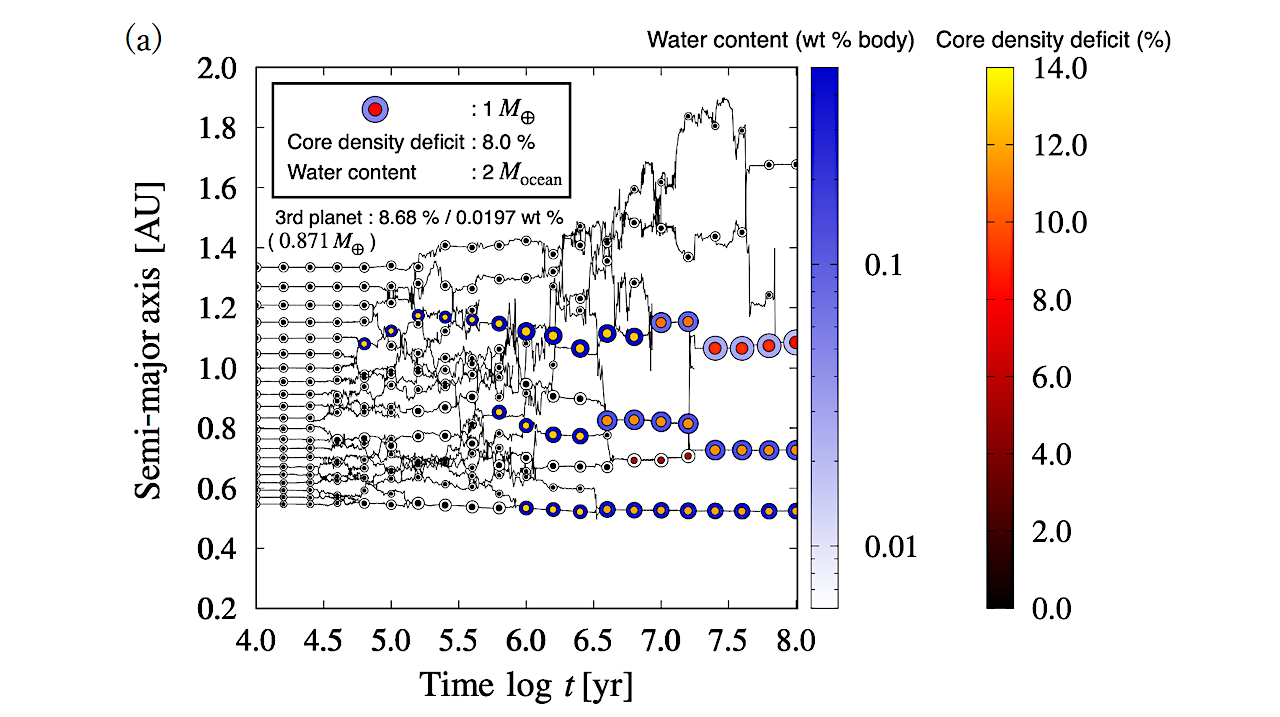
Orbital evolution of protoplanets and changes in core density deficit and water content in atmosphere for (a) Case No.6, (b) No.7, (c) No.11, (d) No.12 (see Table 2). We show
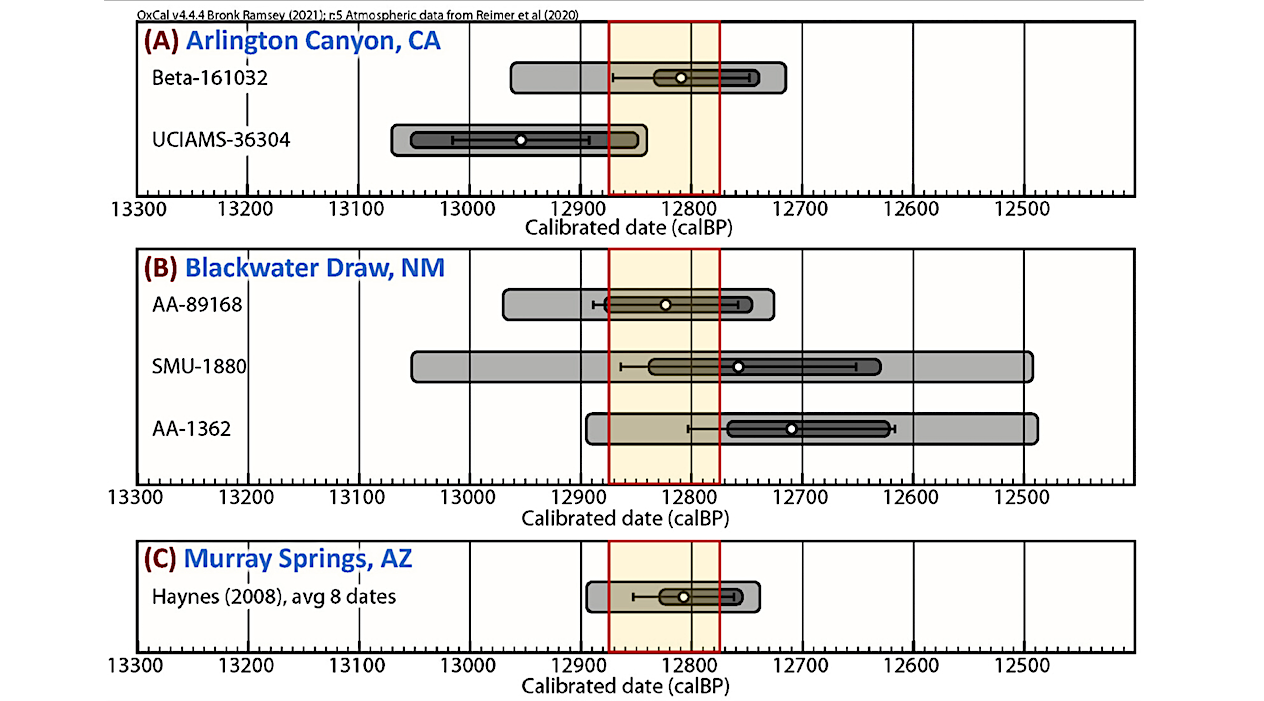
Calibrated ages of the YDB layer at the three sites. Each figure shows the mean calibrated age as a white dot with thin black bars indicating the mean uncertainties. Dark