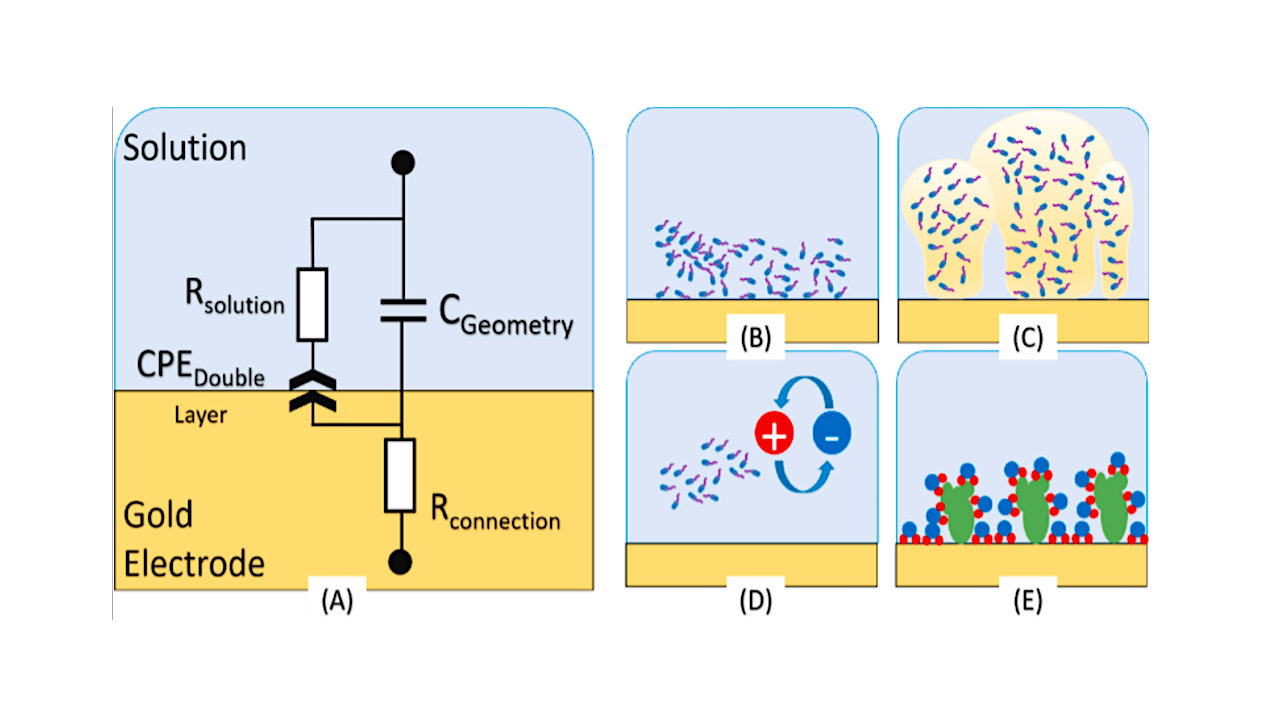
(A) Equivalent complex circuit model of an electrode-electrolyte electrochemical impedimetric cell containing microorganisms and biofilm. Bacteria contribute to different mechanisms at the interface and bulk solution in an electrochemical cell.

(A) Equivalent complex circuit model of an electrode-electrolyte electrochemical impedimetric cell containing microorganisms and biofilm. Bacteria contribute to different mechanisms at the interface and bulk solution in an electrochemical cell.
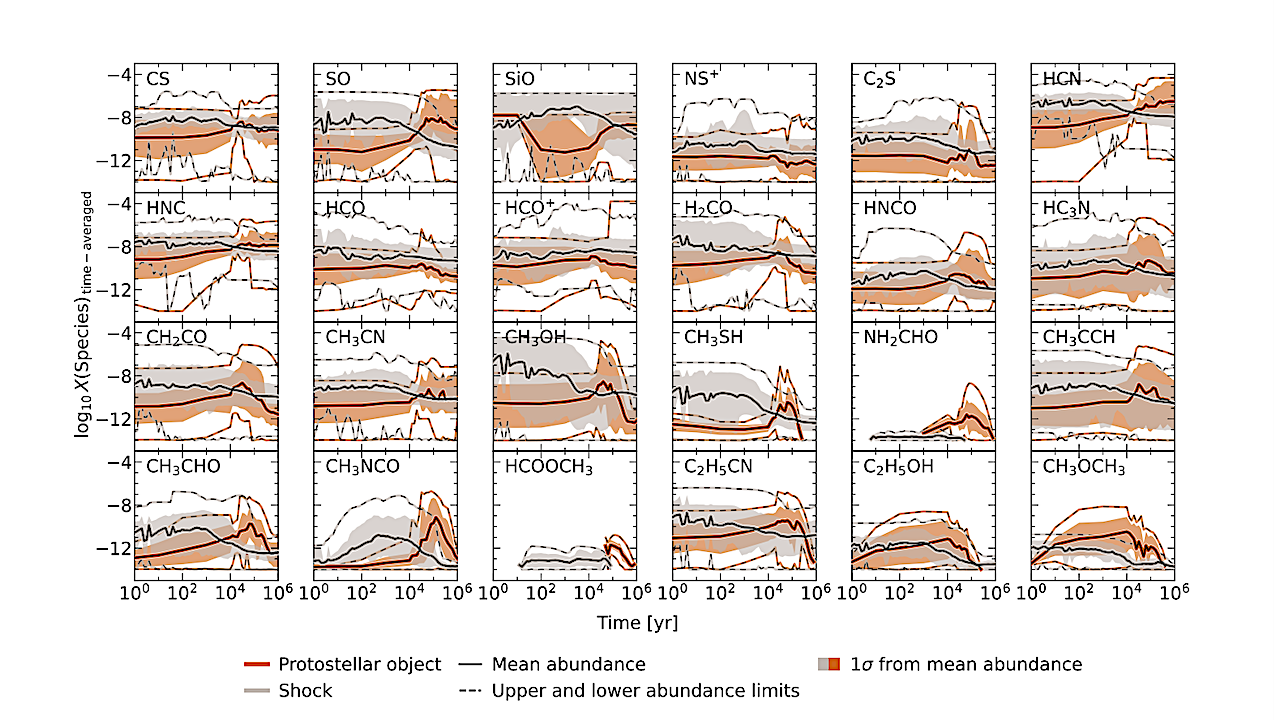
Time-averaged chemical evolution of the studied species across all second stage models, as defined in Tab. 2. Line styles and shading follow those in Fig. 1. Only gas-phase abundances above
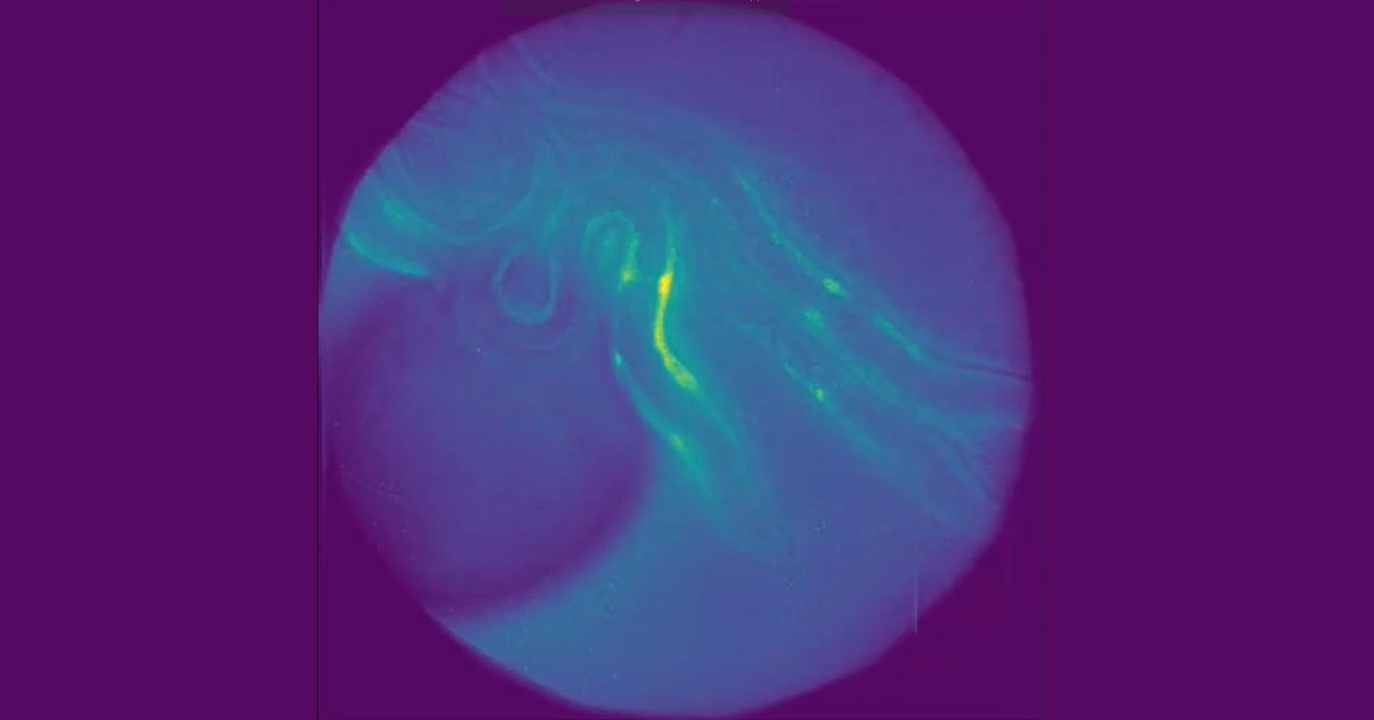
The M25 microscope, which can operate in fluorescence and transmitted light modes, can be used to watch the swimming of entire C. elegans worms, a model organism used to study
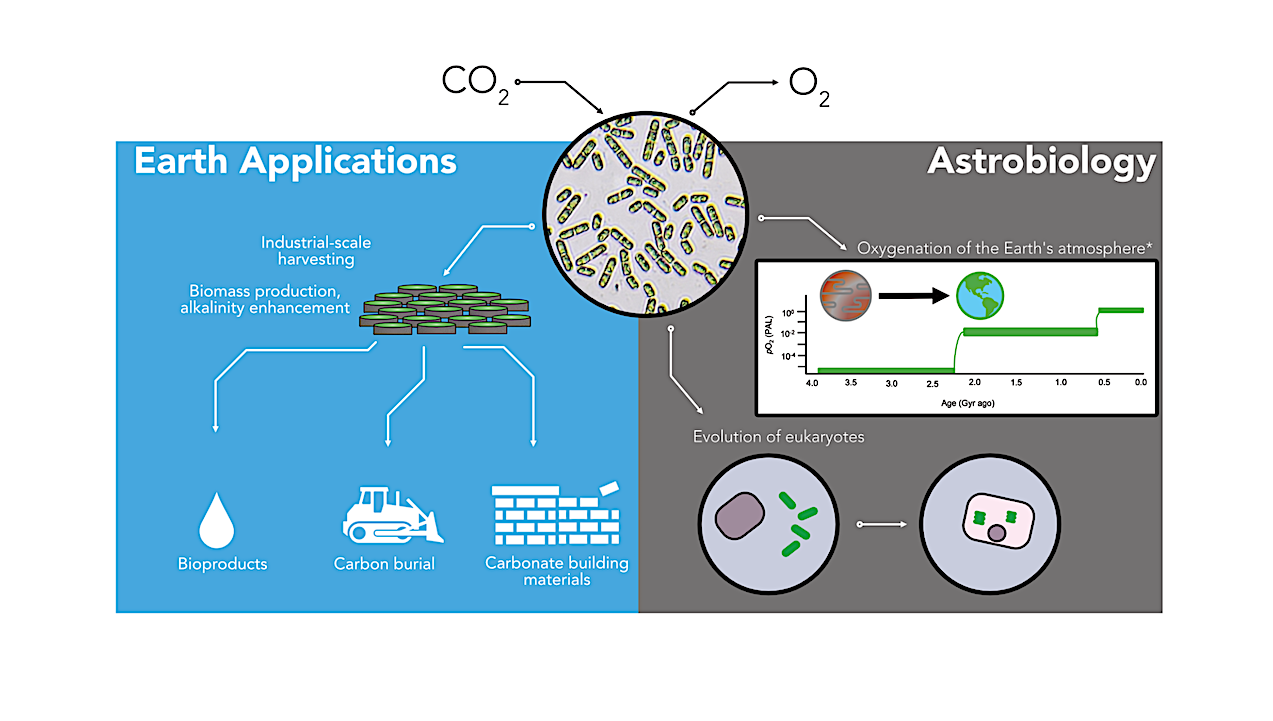
Cyanobacteria as an example of astrobiology and biotechnology. Cyanobacteria fulfill two important roles in Earth habitability: the production of oxygen (right) and the fixation of carbon (from atmospheric carbon dioxide,
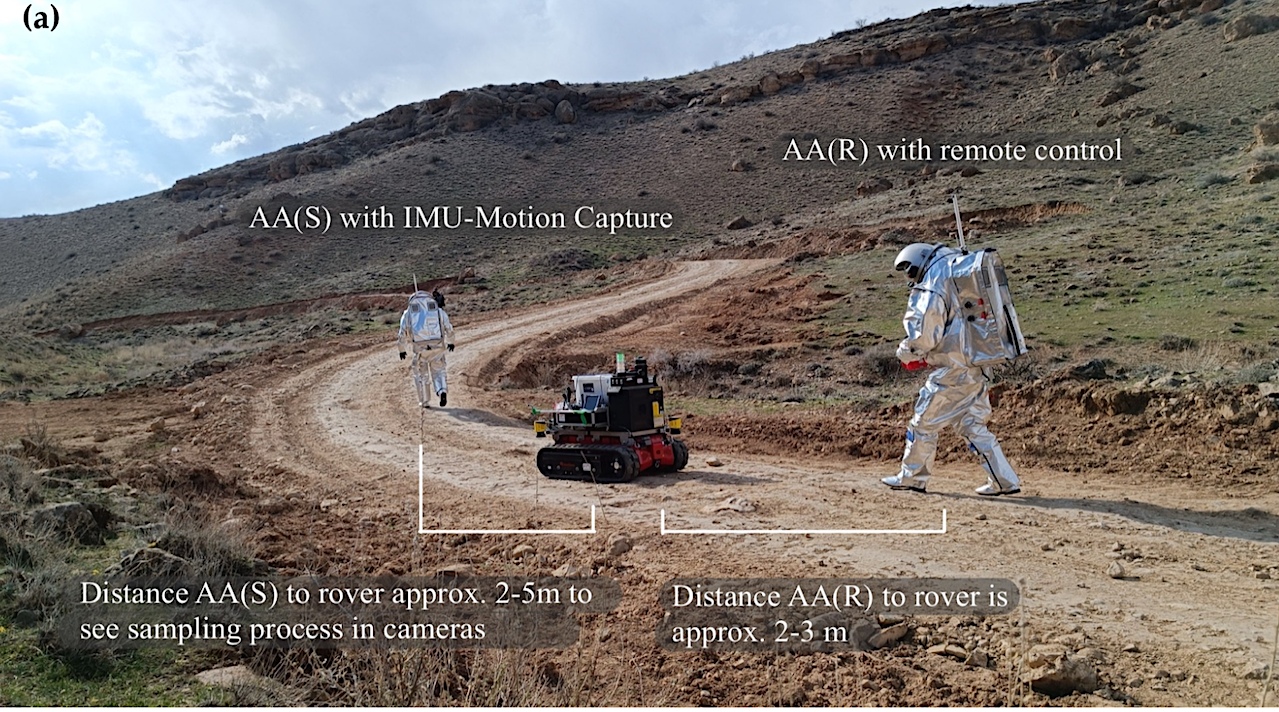
Experimental design and instructions for testing alternative localization methods. — Sensors 2025 Future planetary exploration missions will rely heavily on efficient human–robot interaction to ensure astronaut safety and maximize scientific
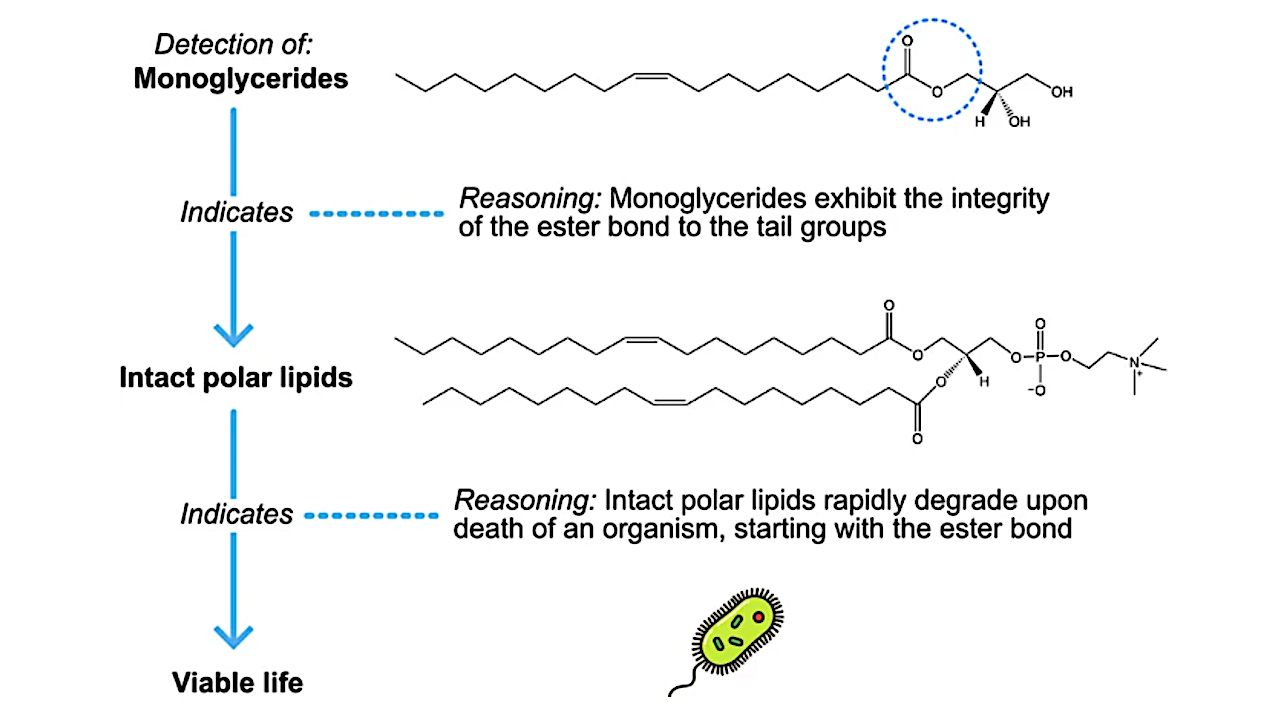
The generalised reasoning for the detection of a monoglyceride in the pyrolysis of a sample as evidence for the presence of viable life. — NPJ Space Exploration The detection of
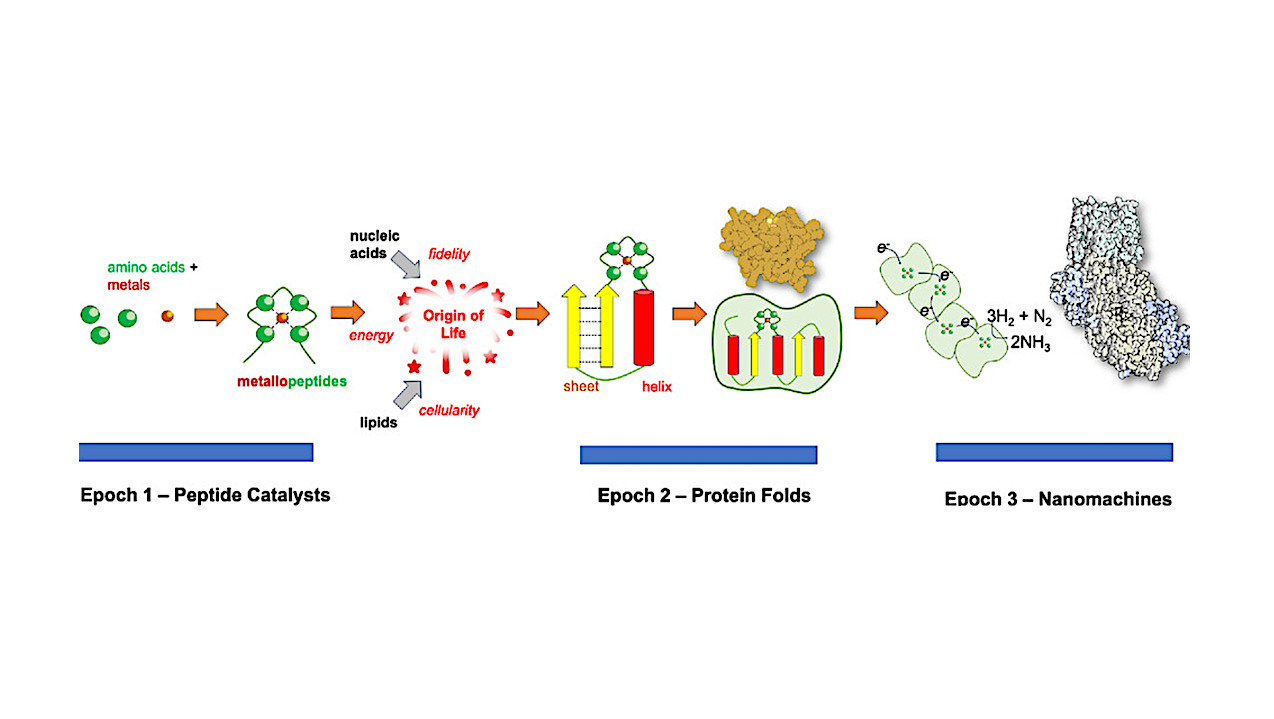
Emergence and complexification of metabolic proteins in three epochs. The foundations of metabolism started when a set of metallopeptides emerged through the spontaneous, thermodynamically driven selection of polymerizing amino acids
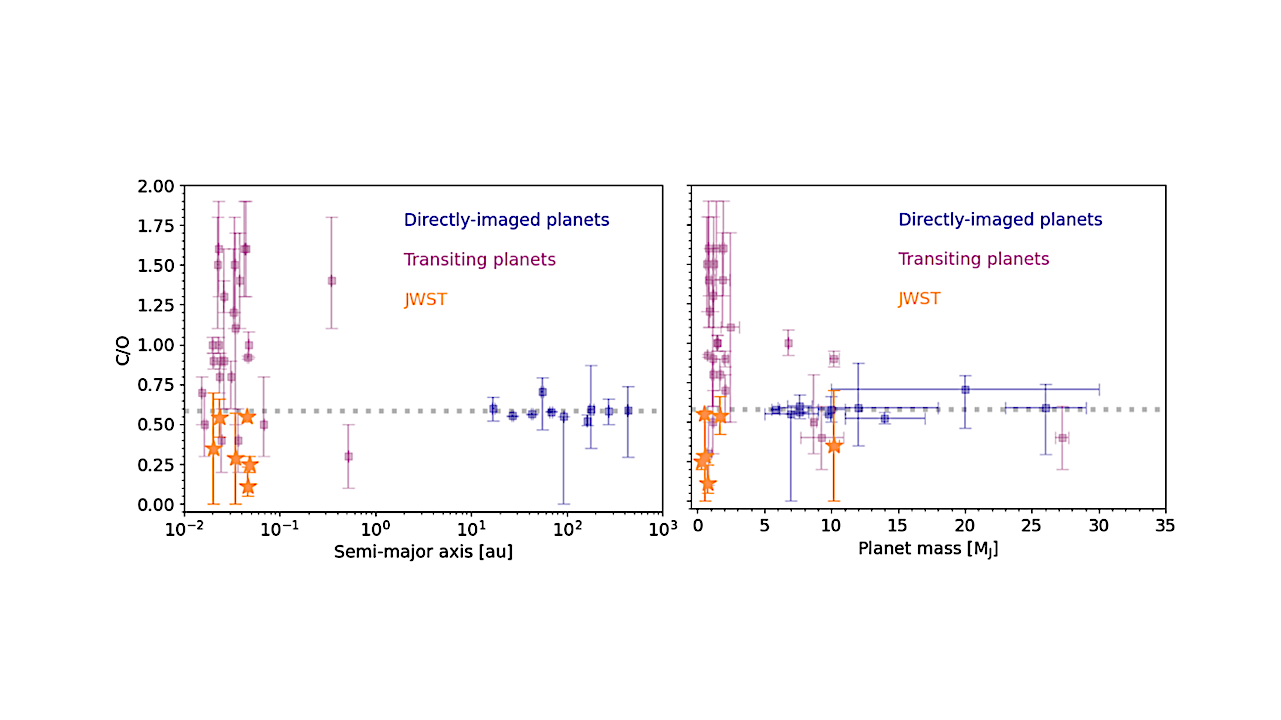
Global atmospheric C/O values for directly-imaged (blue) and transiting (purple) planets as a function of semi-major axis (left) and planet mass (right). This plot is reproduced using the data compiled
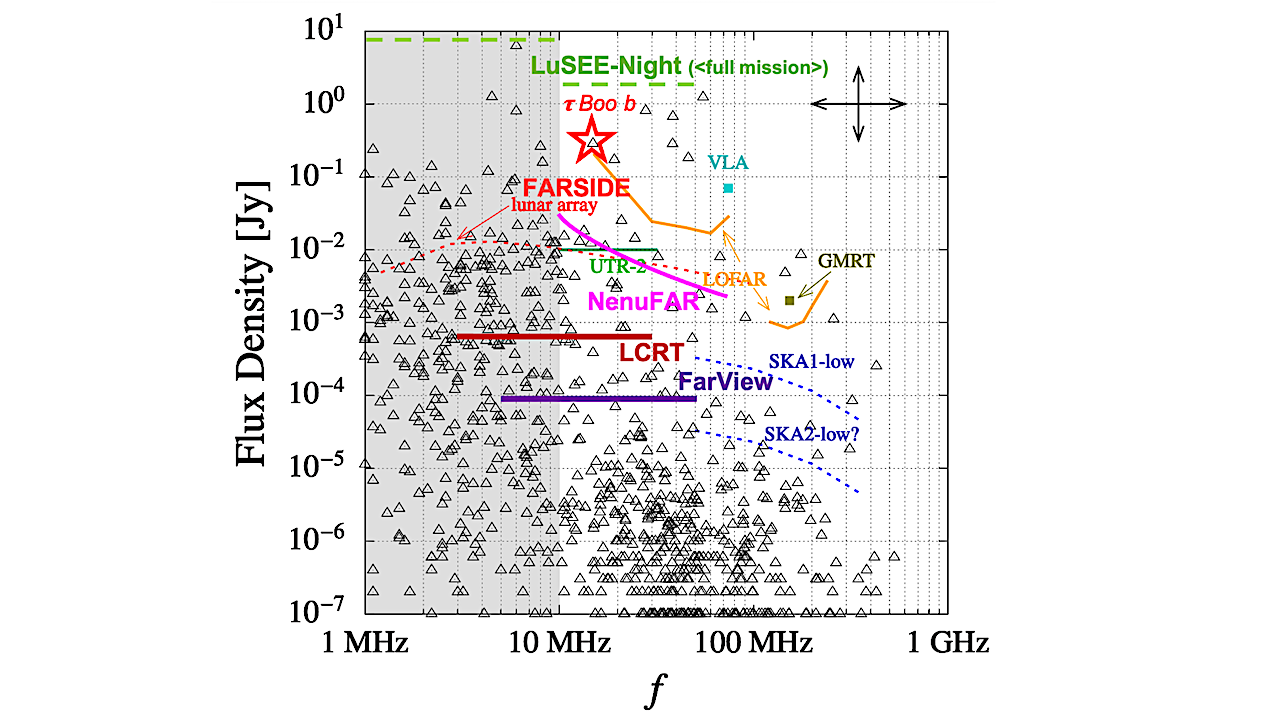
Maximum predicted emission frequency and radio flux density for known exoplanets (triangle symbols; data from ). The uncertainties on the predictions are estimated to one order of magnitude for the
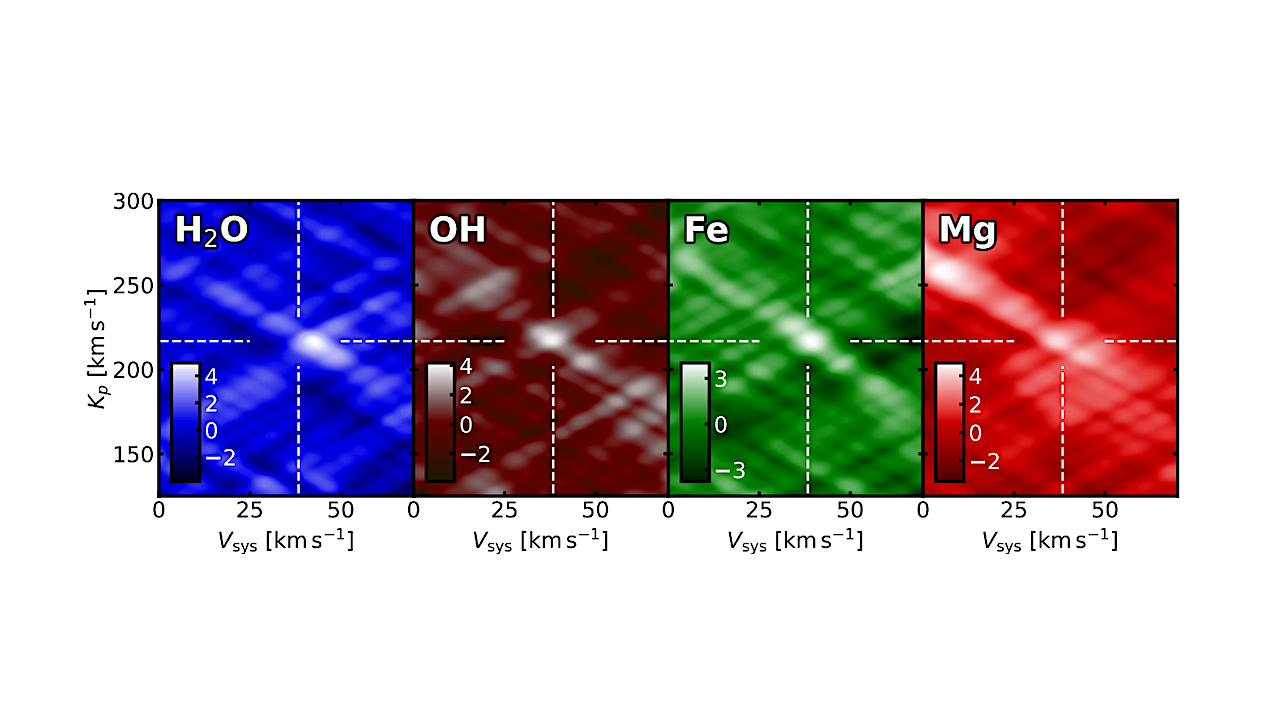
Cross-correlation signal-to-noise maps of H2O, CO, Fe, and Mg in the atmosphere of WASP-121 b. The dashed vertical and horizontal white lines represent the stellar Vsys (38.12 km s−1, from