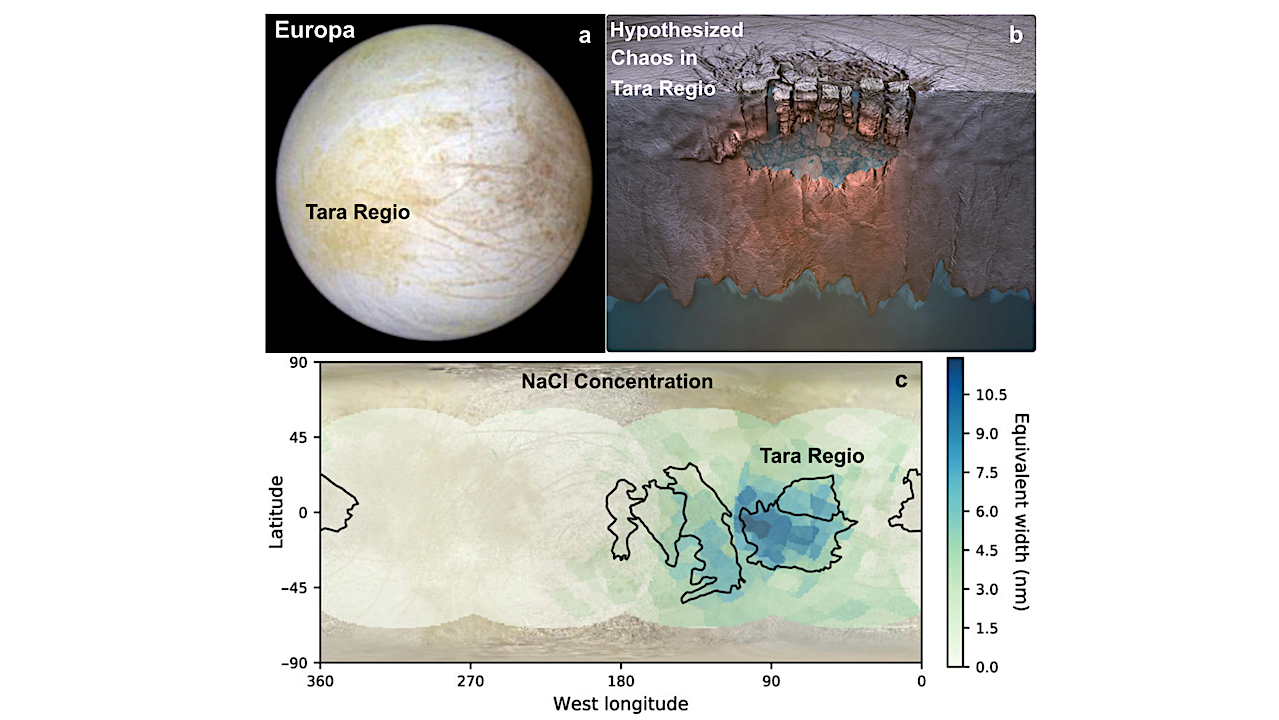
(a) Galileo Solid State Imaging (SSI) false color data of Europa’s leading hemisphere and Tara Regio (credit: NASA, JPL/Caltech, PIA01295). (b) Illustration of chaos on Europa (credit: NASA, GSFC, PIA00840),

(a) Galileo Solid State Imaging (SSI) false color data of Europa’s leading hemisphere and Tara Regio (credit: NASA, JPL/Caltech, PIA01295). (b) Illustration of chaos on Europa (credit: NASA, GSFC, PIA00840),

Left: Eccentricity posterior generated by fitting the first nine chronological transits of TOI 555.01. Right: Eccentricity posterior generated by fitting the first nine chronological long-cadence transits of KOI 247.01. —
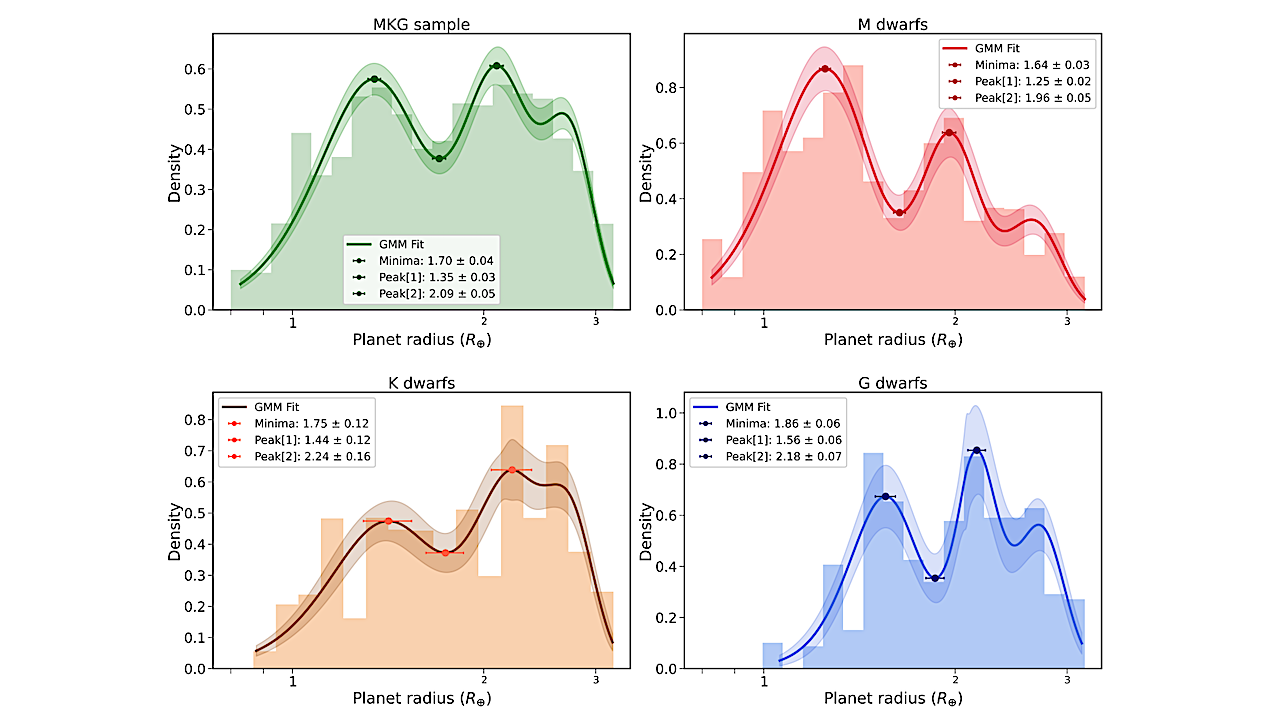
GMM fits to the unbinned radius data, along with corresponding histograms, are presented for the entire low-mass star sample and for M, K, and G stellar types. The Super-Earth and

ℓ1 periodogram for the stars HD 10700 (left), HD 102365 (centre), and HD 304636 (right). The ten strongest peaks periods are identified in the image; the associated FAP is listed
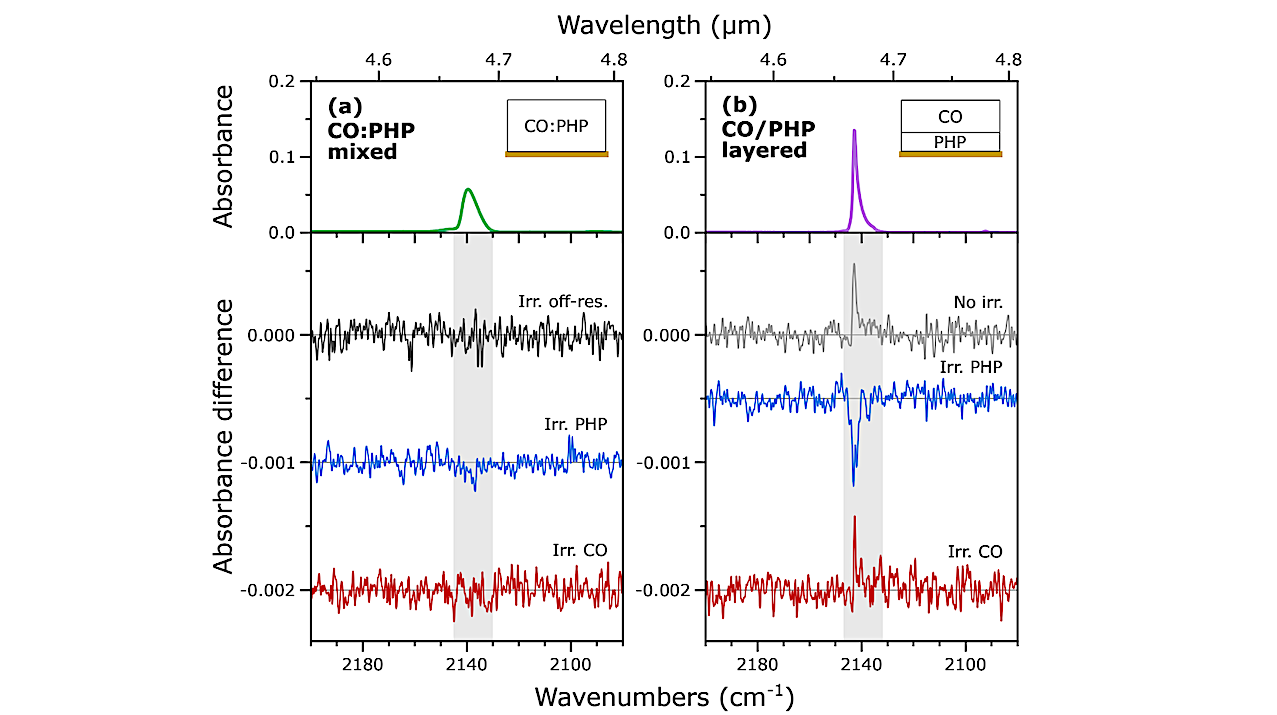
RAIR spectra (top) and difference spectra (bottom) for irradiation of the (a) CO:PHP mixed ice and (b) CO/PHP layered ice, focusing on the region around the CO stretching mode. The

NASA Science Mission Directorate NASA’s Science Mission Directorate (SMD) announces the release of its annual omnibus solicitation for basic and applied research, Research Opportunities in Space and Earth Science (ROSES)

Astrobiology.com editor Keith Cowing on CNN Editor’s note: this web reel was just posted by CNN from the end of my interview this morning.I have just about run out of

An artist’s impression of the proposed VERVE mission to Venus the answer whether tiny bacterial lifeforms really do exist in the planet’s clouds. Credit Danielle Futselaar Licence type Attribution (CC
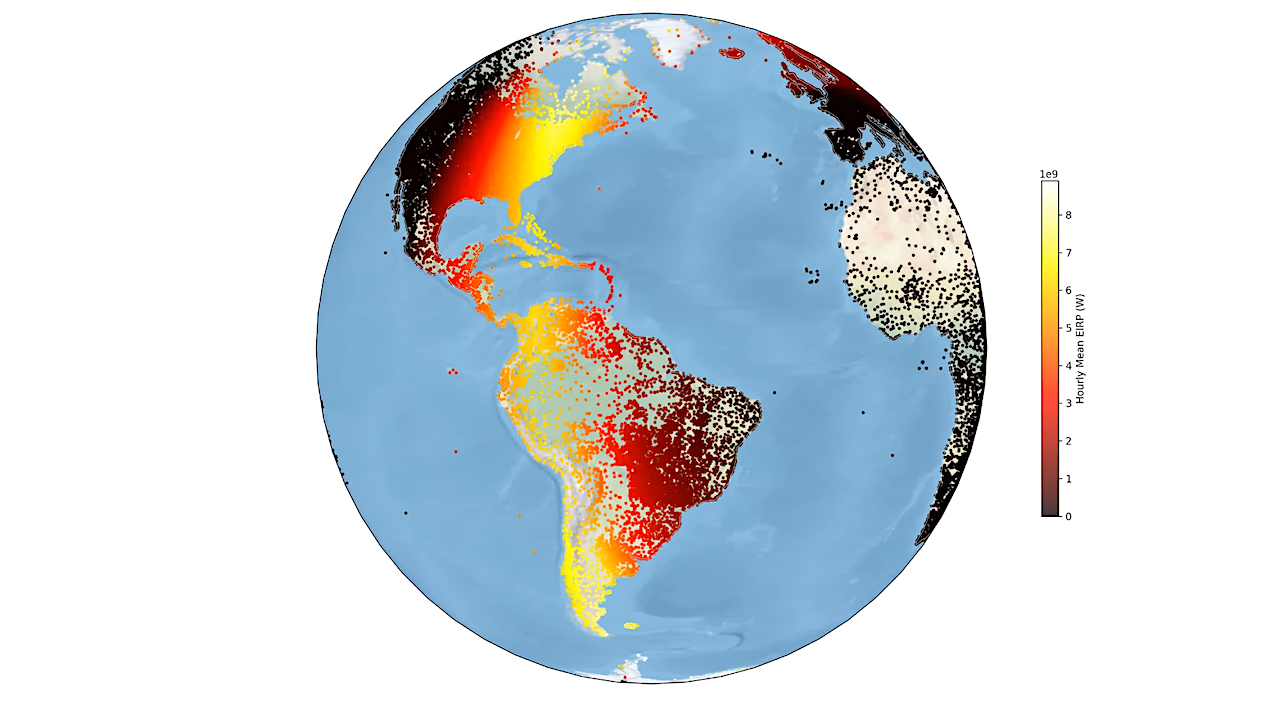
The average total power of individual airport radar systems, averaged over one-hour intervals as seen from Barnard’s Star. — Royal Astronomical Society Radar systems used by civilian airports and military
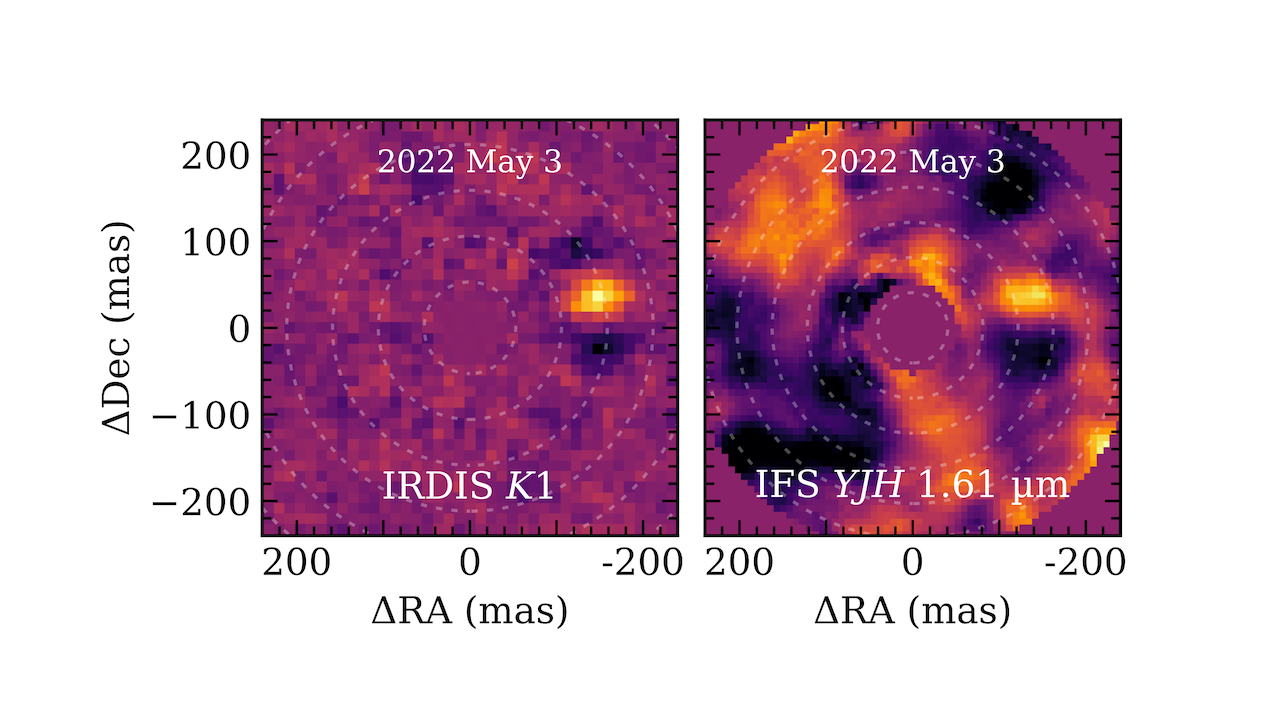
Detection of HD 135344 Ab with VLT/SPHERE. — astro-ph.EP HD 135344 AB is a young visual binary system that is best known for the protoplanetary disk around the secondary star.