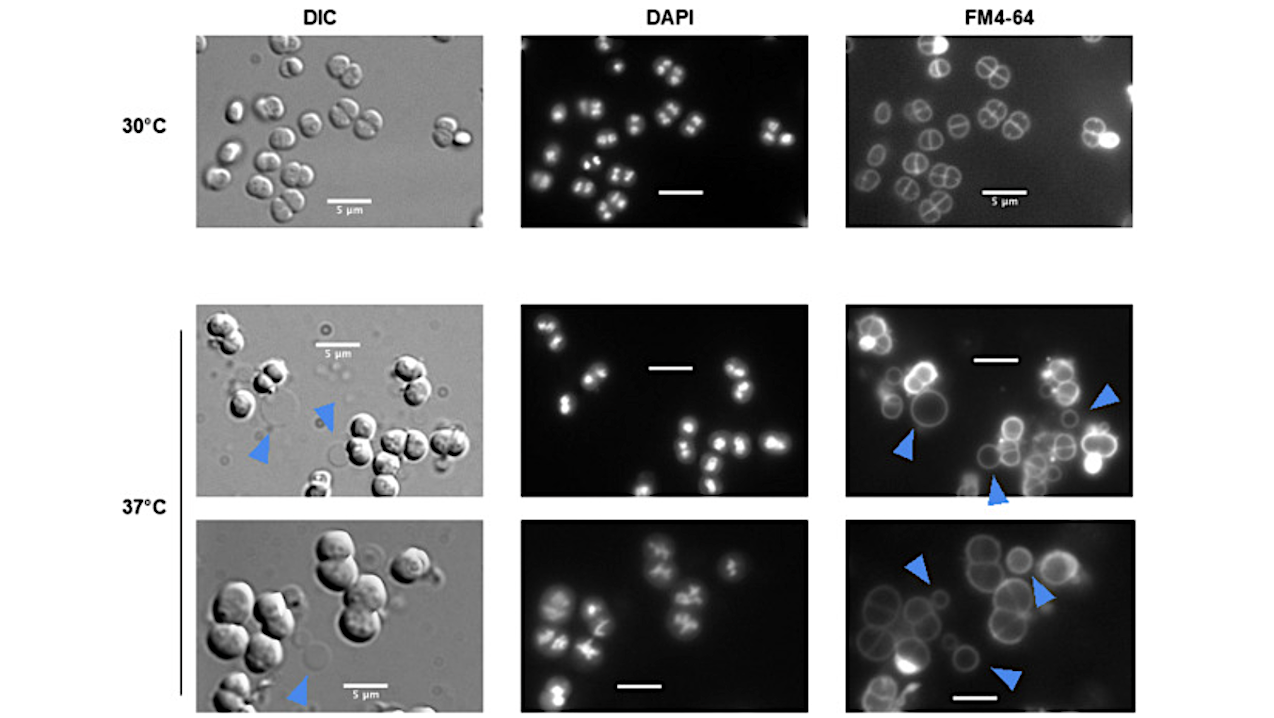
Formation of membrane vesicles following depletion of CwlA. Cells (∆cwlA/prepUTS::cwlA+) in exponential growth phase cultivated at 30 °C in medium supplemented with spectinomycin were harvested by centrifugation, diluted in antibiotic-free

Formation of membrane vesicles following depletion of CwlA. Cells (∆cwlA/prepUTS::cwlA+) in exponential growth phase cultivated at 30 °C in medium supplemented with spectinomycin were harvested by centrifugation, diluted in antibiotic-free
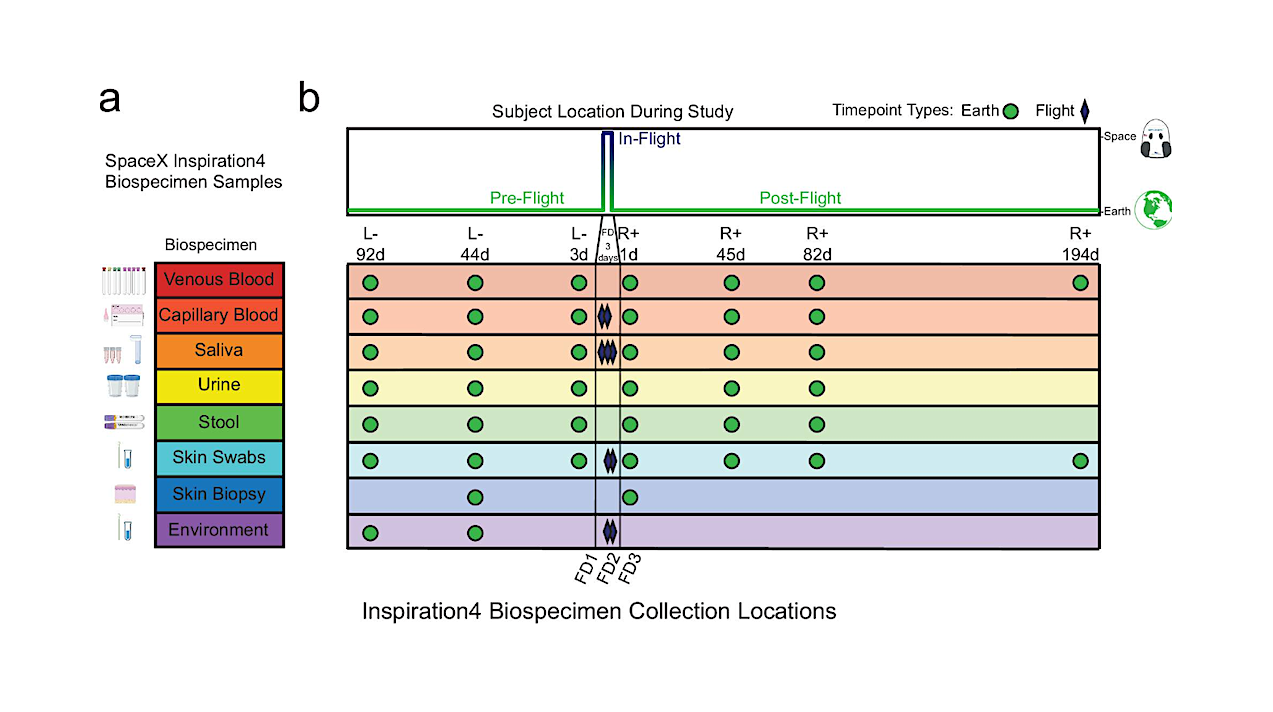
a List of biospecimen samples collected over the course of the study. b Timepoints for each biospecimen sample collection. “L-” denotes the number of days prior to launch. “R + ” denotes
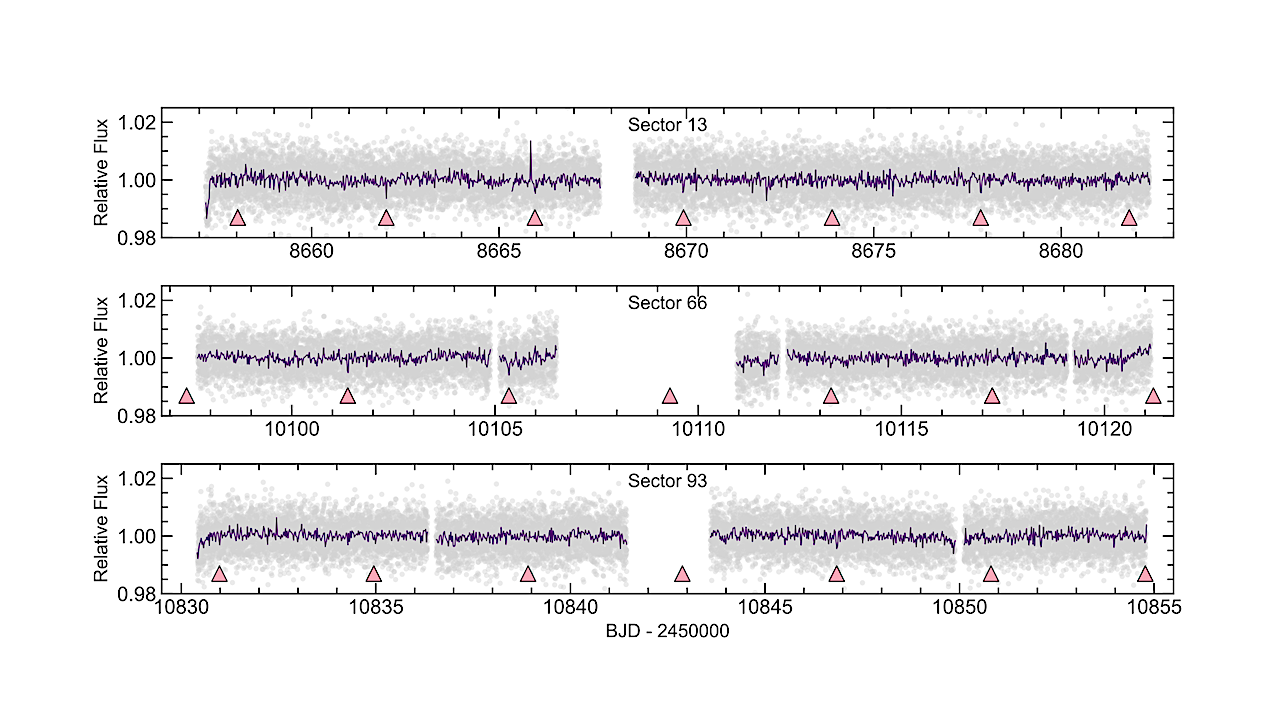
Normalized TESS light curve. The 45 967 individual photometric points are shown in grey. The purple line shows the 30 minute binned flux. The transits of TOI-1080 b are marked
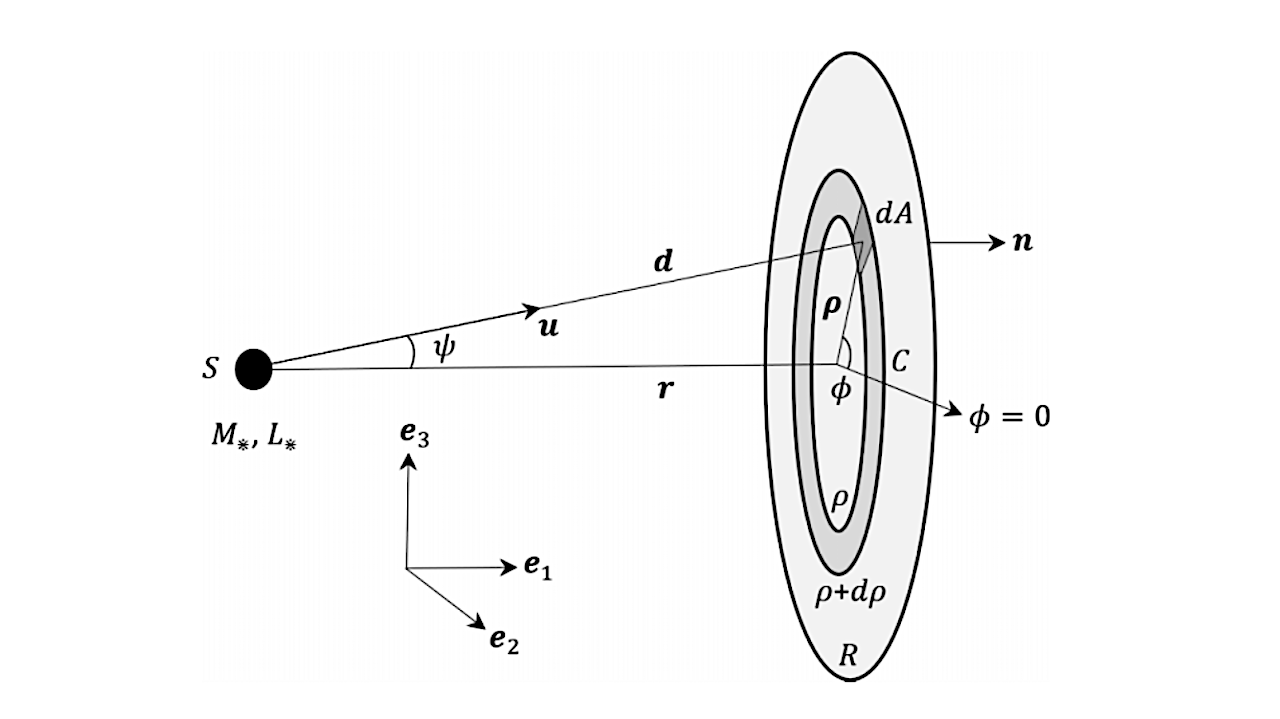
Reflecting disc of radius R at distance r from a body of mass M and luminosity L. — astro-ph.SR A range of speculative space ventures envisage the use of ultra-large
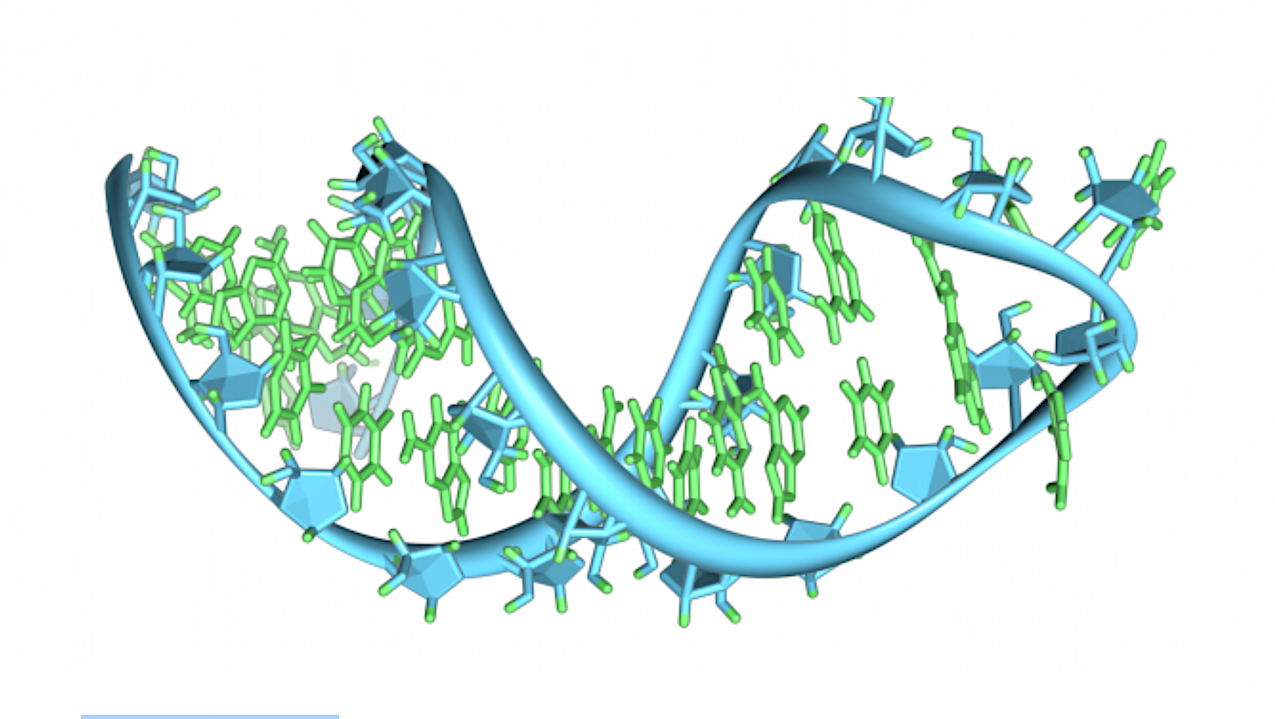
Artist’s impression of RNA. Image credit: Vossman/Wikipedia Commons via NASA The origin of life is a complex scientific problem demanding interdisciplinary approaches. We propose a Linear Logic (LL)-based computational framework
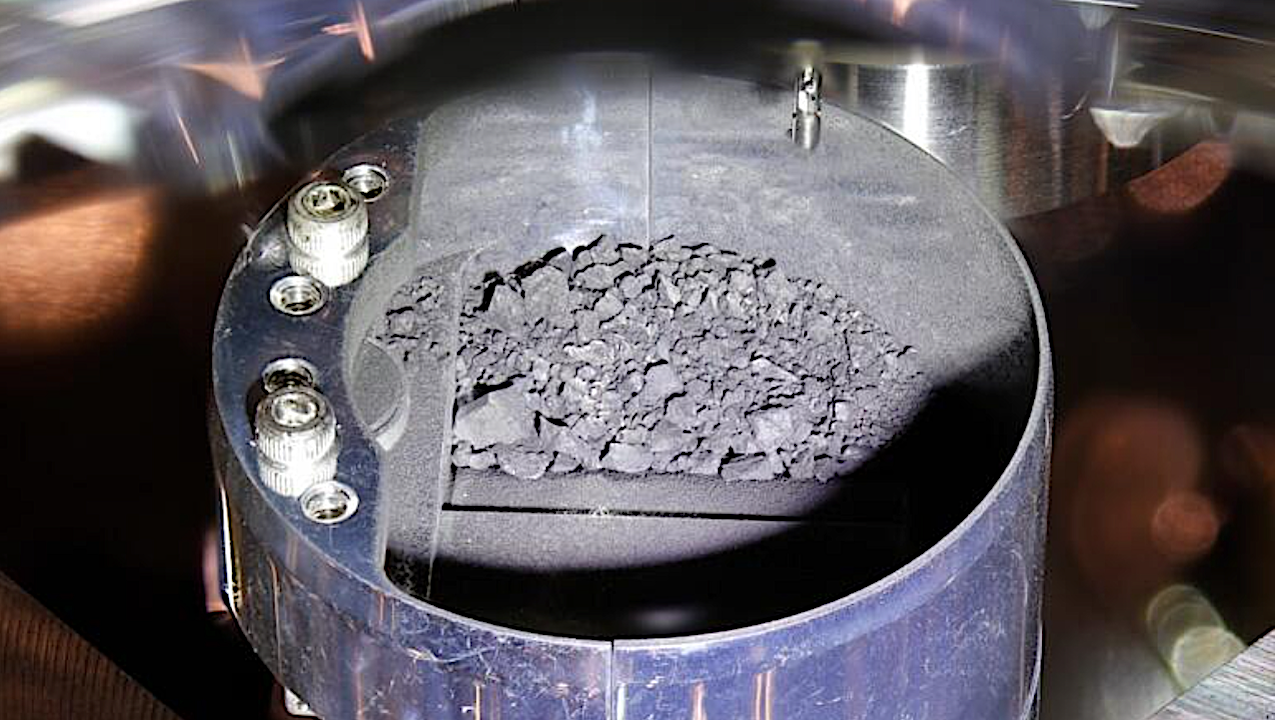
Hayabusa2 Asteroid samples — JAXA To uncover the history of our solar system, it is necessary to study the dynamic evolution of the ancient solar nebula materials. These materials interacted
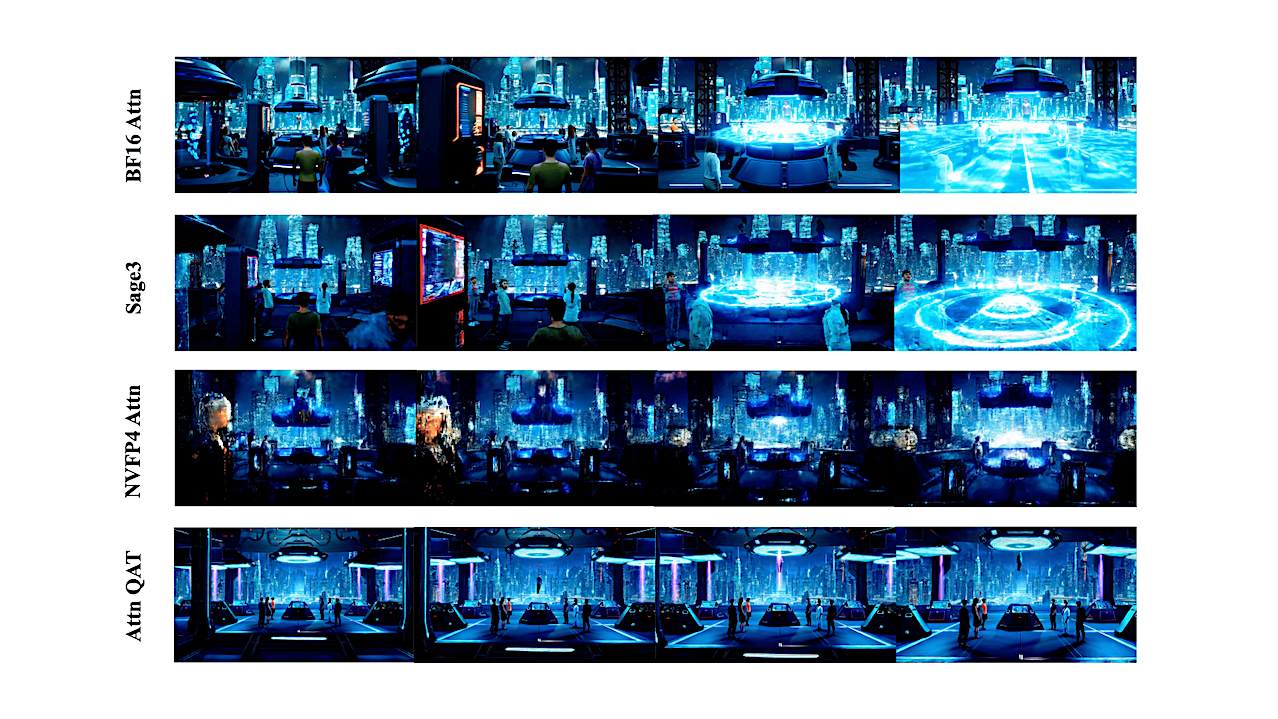
In a futuristic world where teleportation technology has become a reality, a bustling cityscape filled with towering skyscrapers and advanced architecture stands in the background. Amidst this backdrop, a group
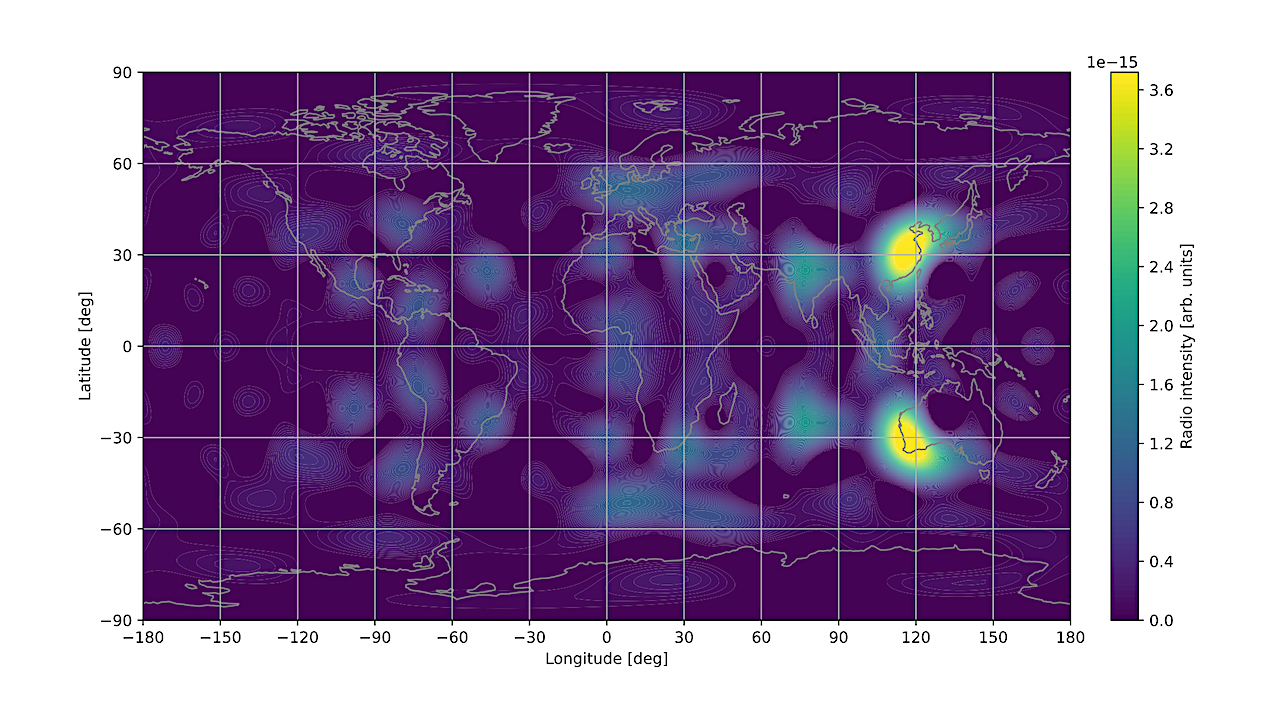
Reconstructed distribution of radio sources on Earth with noise (SNR of 5). Here Earth’s rotation axis is perpendicular to the line of sight as in Fig. 3. Comparing this reconstruction

The search for both extant and extinct life within our Solar System and beyond has been a primary motivation for space exploration since its inception. Mars has long been a
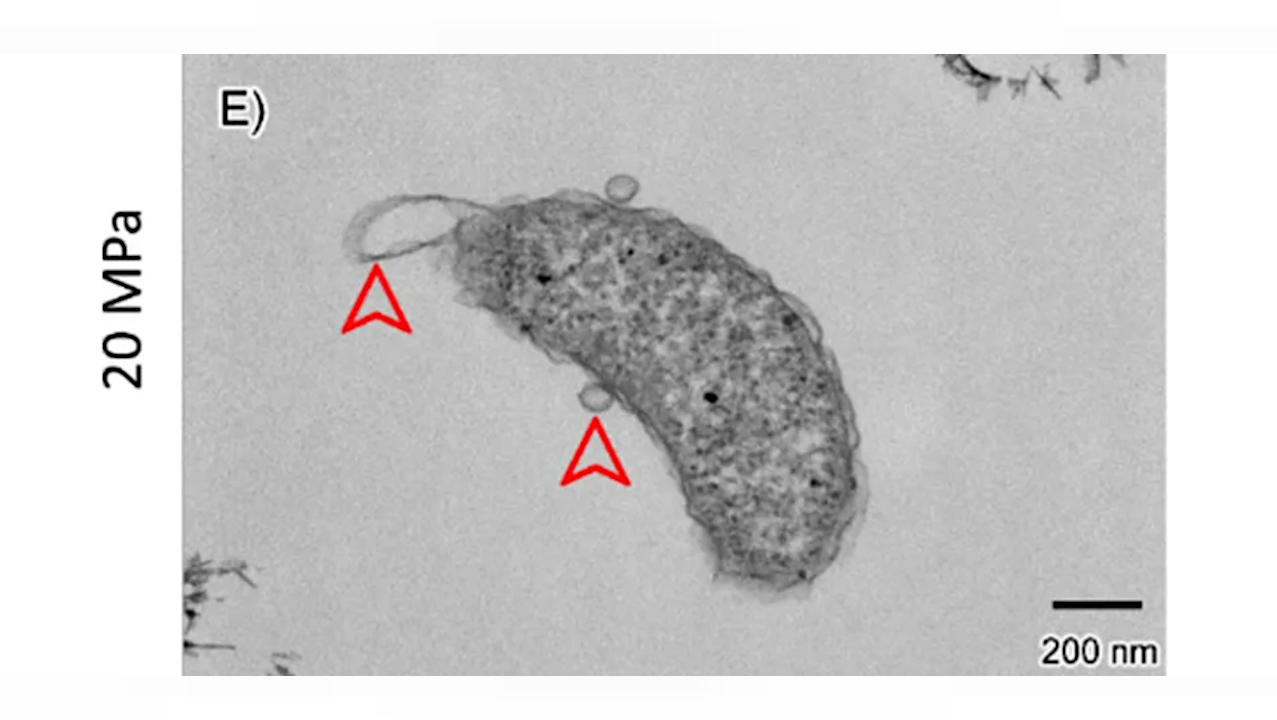
Transmission electron microscope image at low and high magnifications of a cell grown under 20 MP — Frontiers Under its thick ice layer, Europa contains a shielded liquid water ocean where