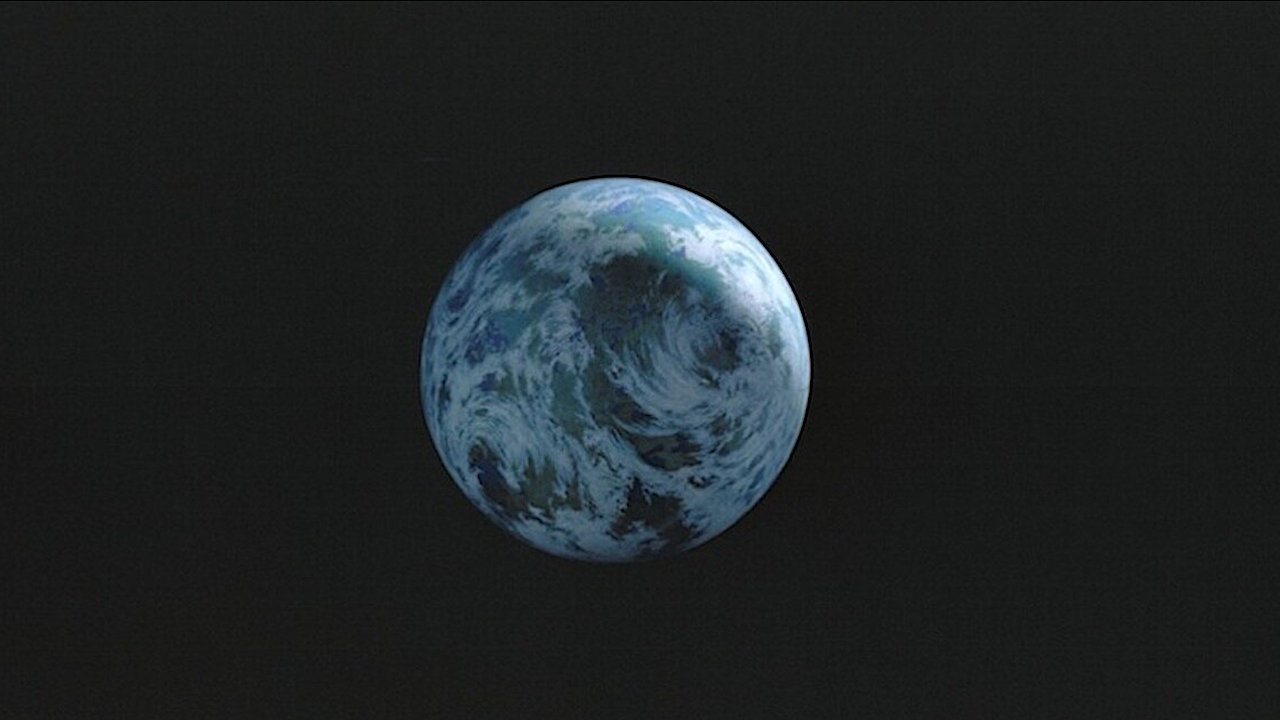
Endor (source) – Starwars.com Giant planets in the habitable zone may host exomoons with conditions conducive to life. In this paper we describe a method by which the Habitable Worlds

Endor (source) – Starwars.com Giant planets in the habitable zone may host exomoons with conditions conducive to life. In this paper we describe a method by which the Habitable Worlds
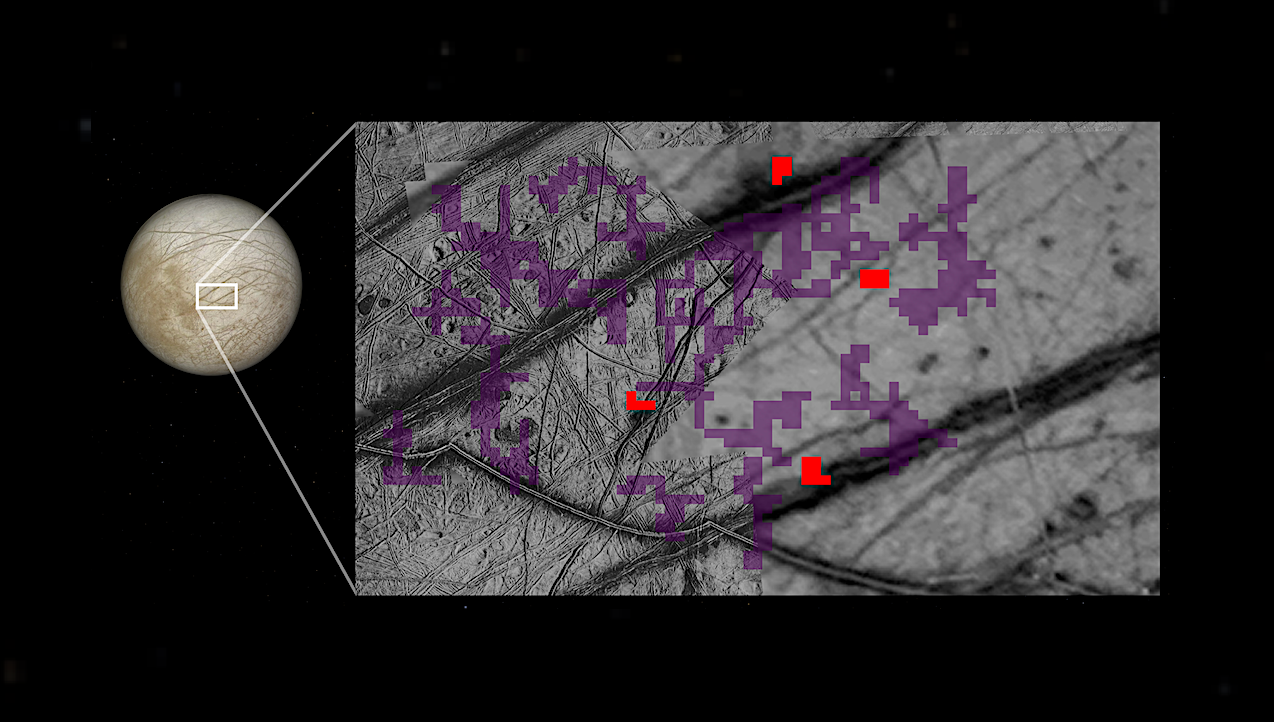
Press Release January 29, 2026 In this composite image, red pixels mark locations on Europa’s surface where ammonia-bearing compounds were detected; purple indicates no such detection. Captured by NASA’s Galileo
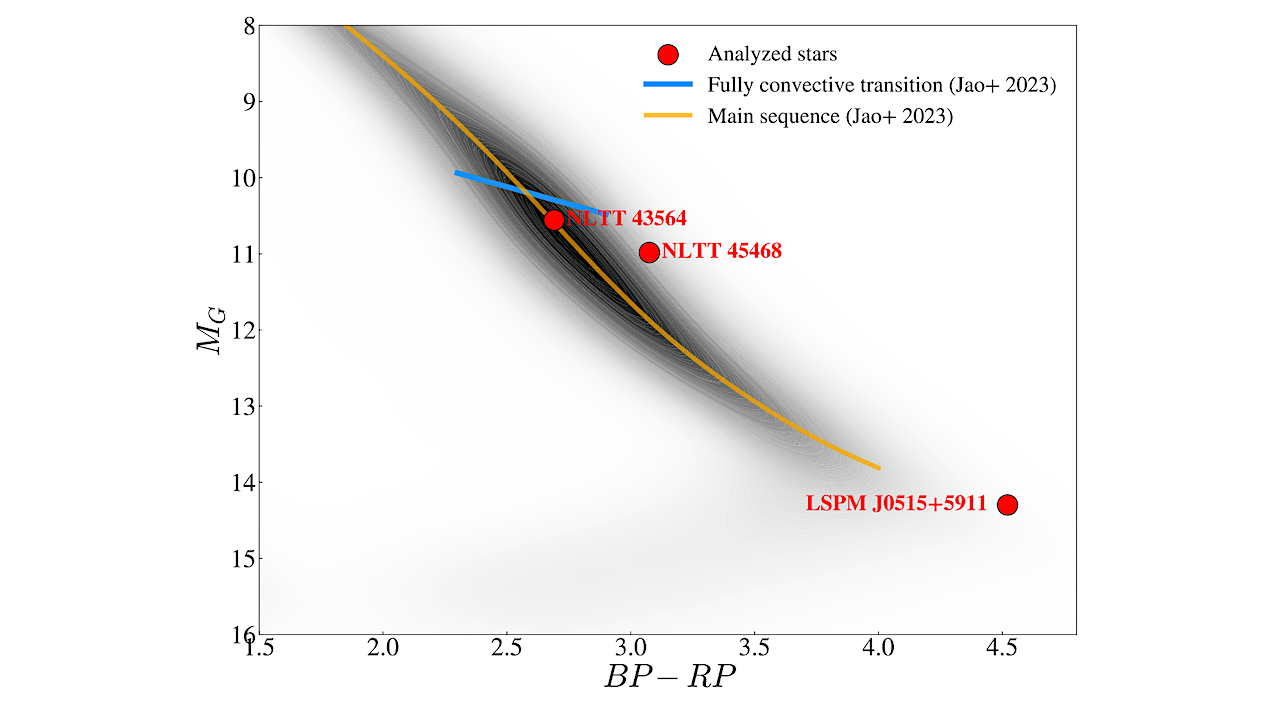
Color-magnitude diagram for nearby stars (within 100 pc) showing the local main sequence in MG vs BP − RP. The background density map is constructed from the Gaia Catalogue of
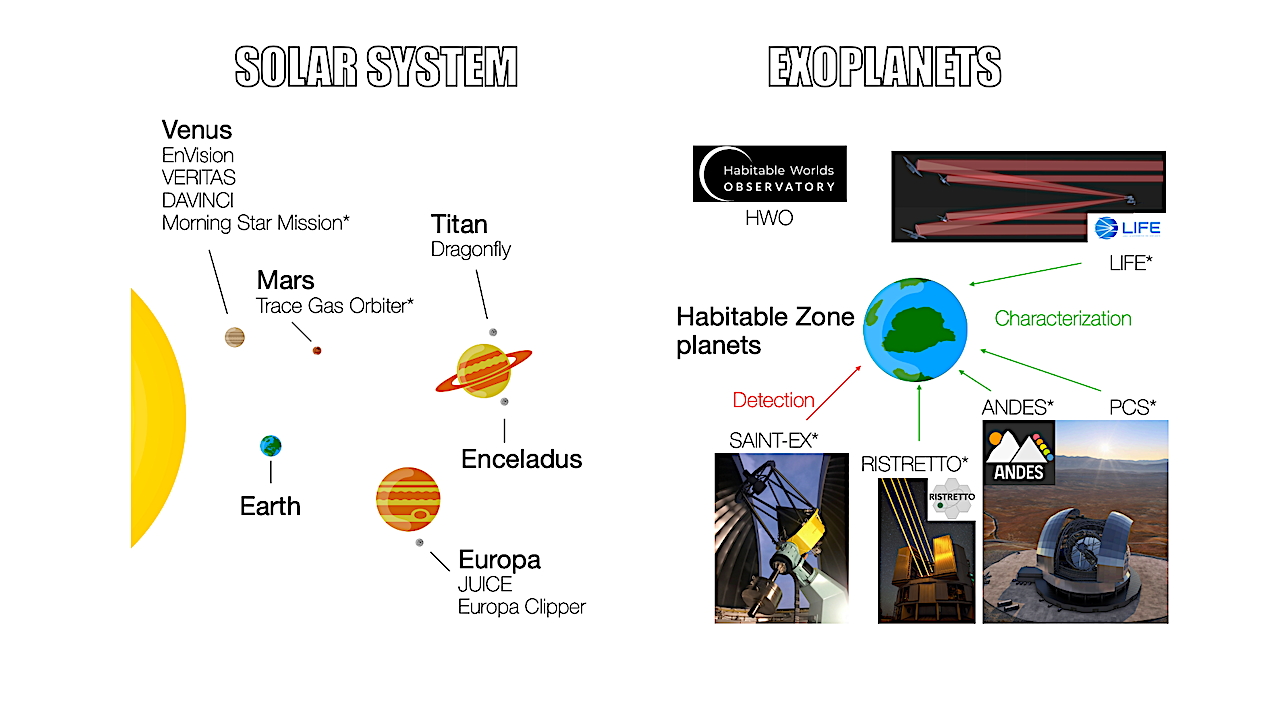
The different Solar System bodies and exoplanets this chapter focuses on, and associated missions. Those with a strong PlanetS involvement are shown with an asterisk. — astro-ph.EP Understanding the climates
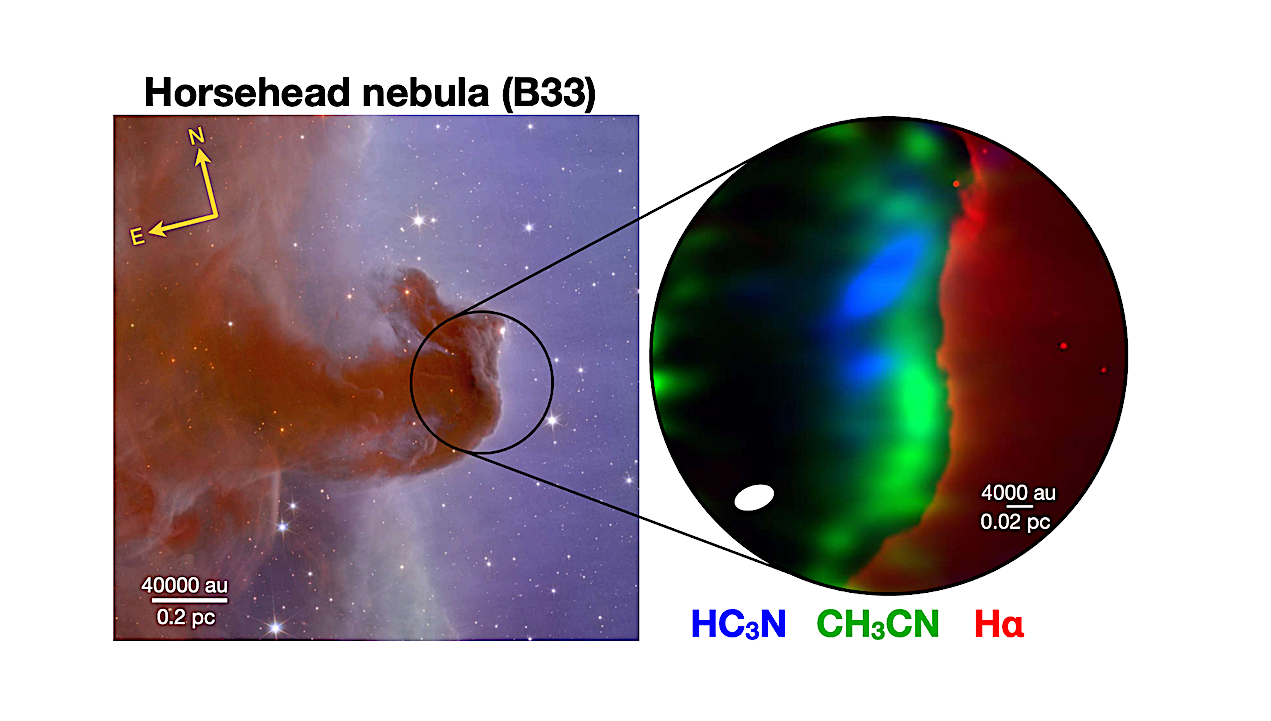
Composite image of the field-of-view mapped in the Horsehead nebula (Barnard 33). Left: The Horsehead nebula and the adjacent H II region IC 434 imaged by Euclid Early Release Observations
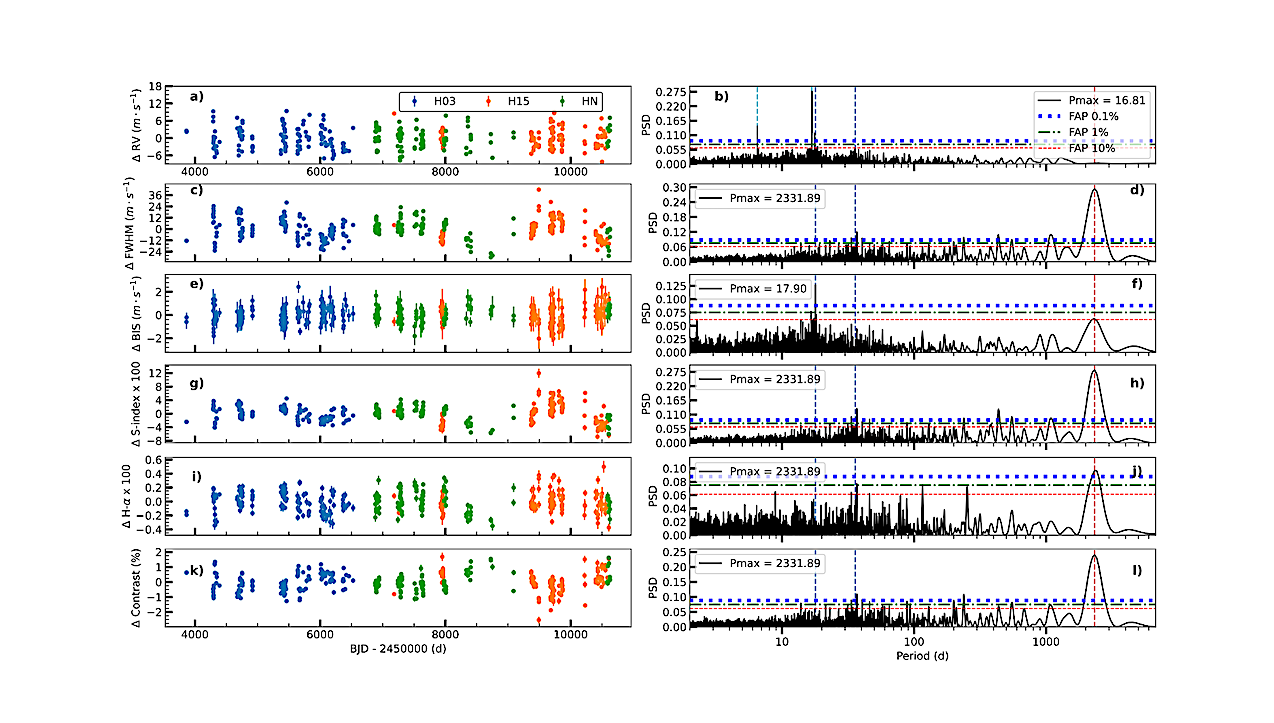
Time series of RV and activity indicators. Panel (a): RV time series. Panel (b): GLS periodogram related to the RV time series. We see two prominent peaks in correspondence with
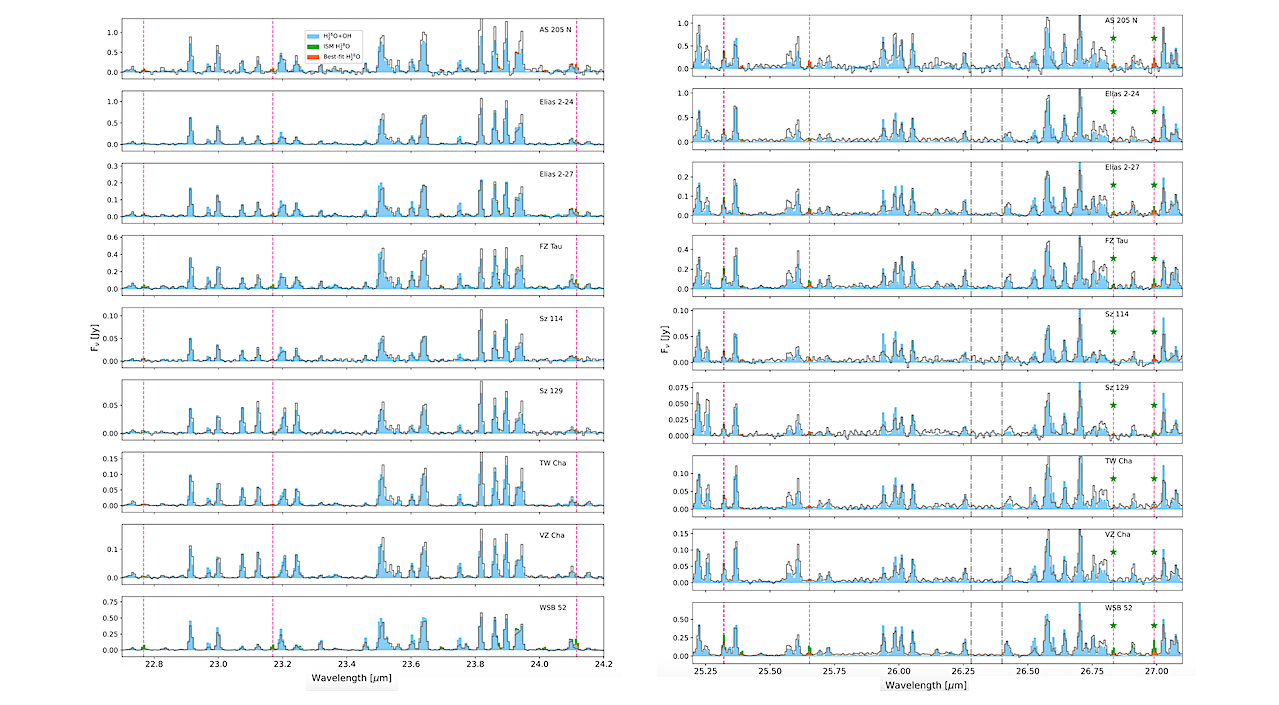
Spectra of targets meeting our selection criteria for further analysis (P/C>0.2 and H218O SNR>2), between 22.7 and 24.2 µm, along with best-fit 3-component water models (blue; see Table 1),
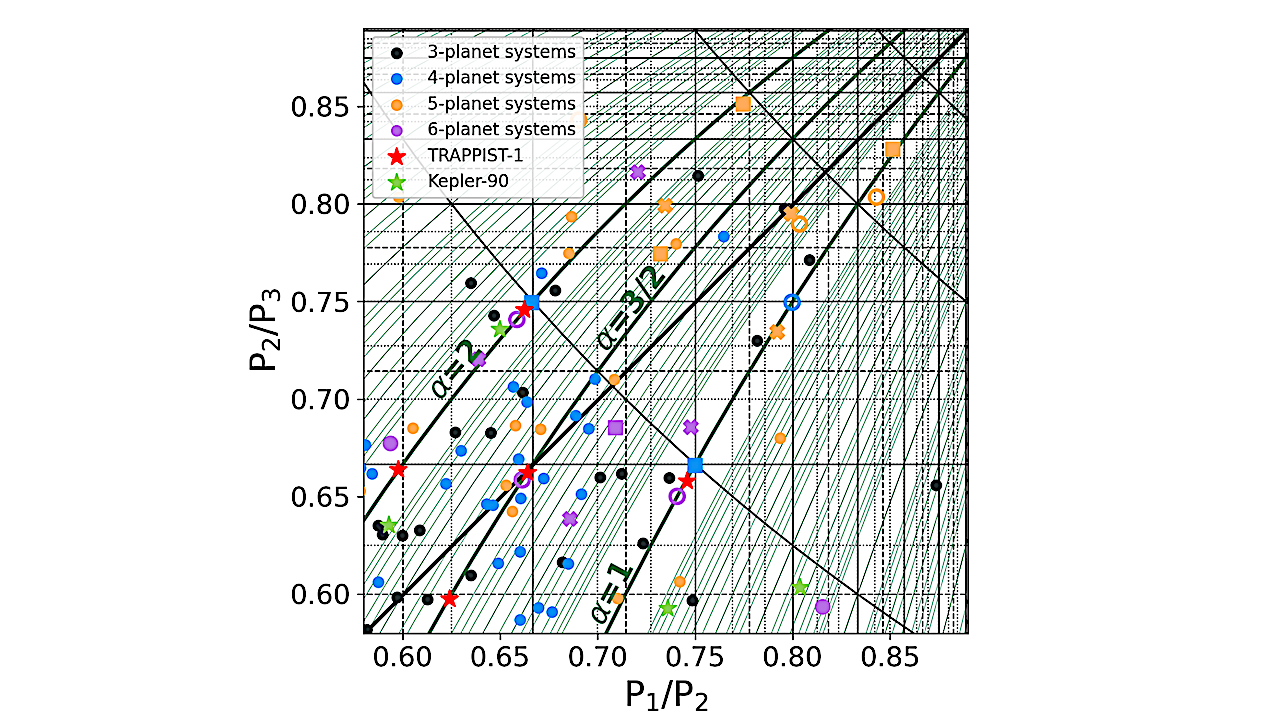
Period-ratio plane with triplets of adjacent planets in Kepler systems in the region 0.58 Pj/Pj+1 0.90 (Lissauer et al. 2024). The black markers show the position of triplets of planets
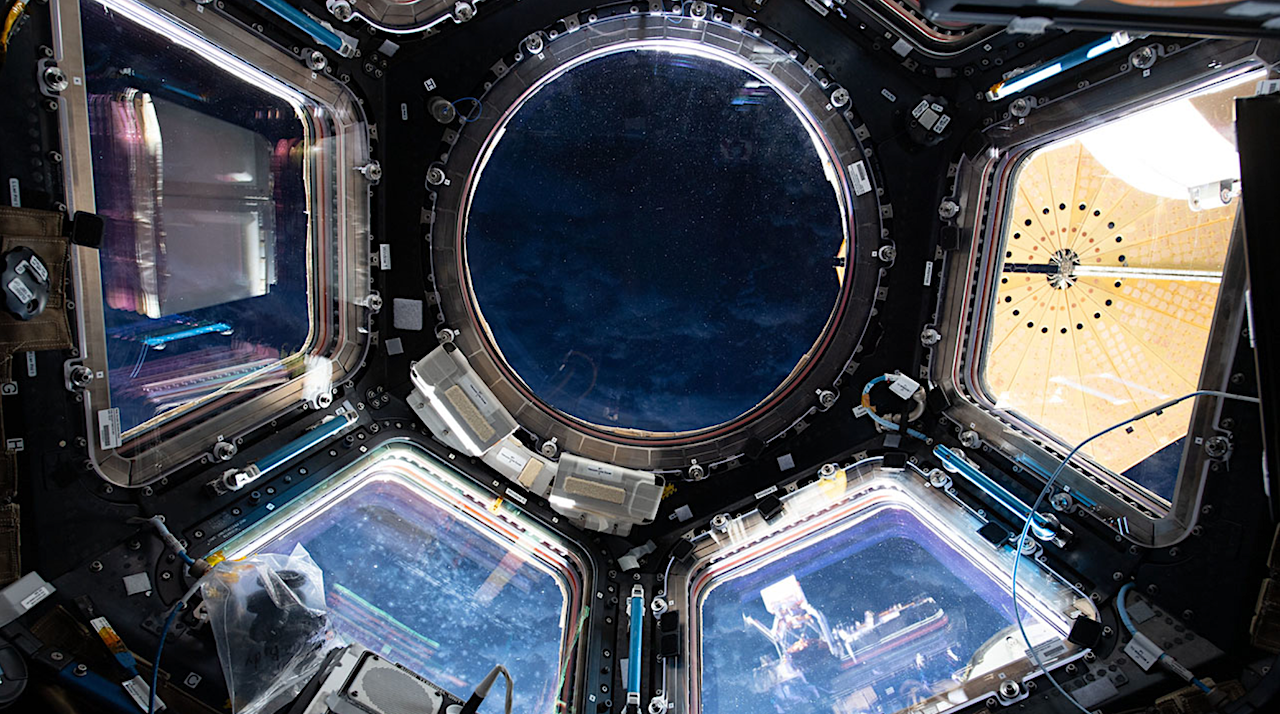
iss070e014729 (Oct. 29, 2023) — Orbital nighttime peeks through the International Space Station’s cupola, or “window to the world,” nearly 270 miles above the Indian Ocean. In the right window,
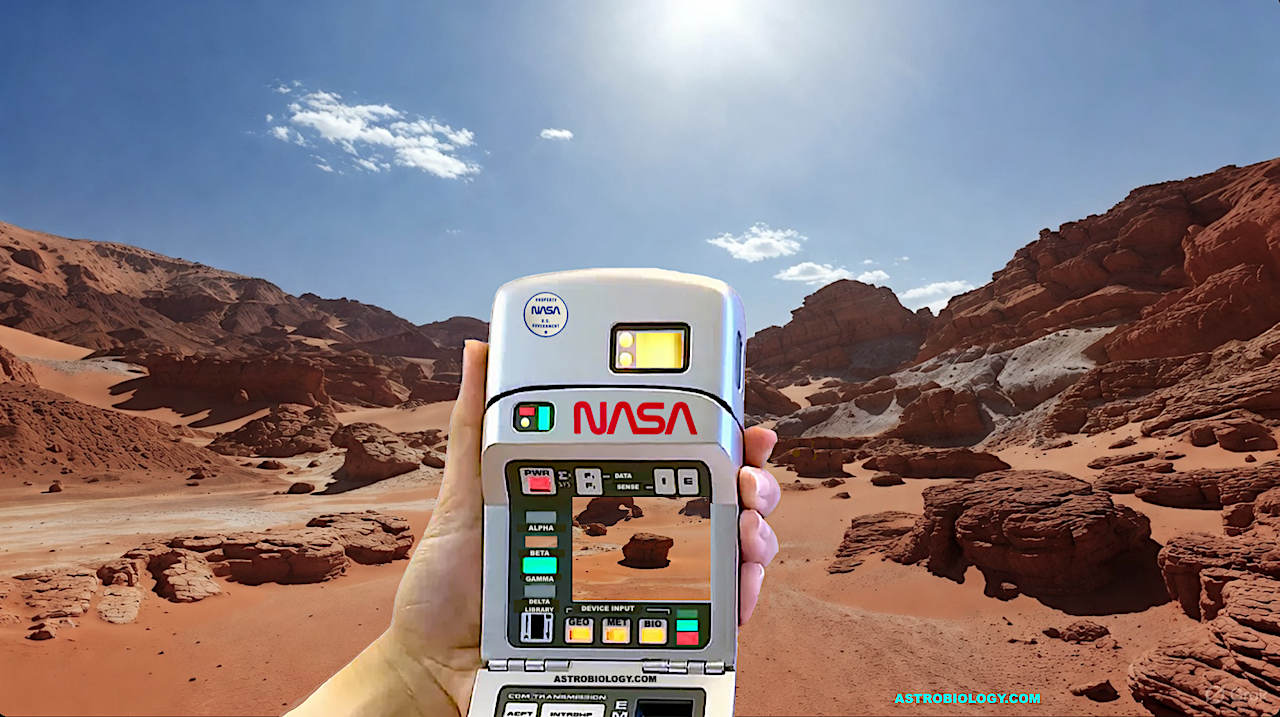
Using a NASA Tricorder to scan for life signs aka biosignatures – Astrobiology.com and Grok The “NASA definition” enjoys broad popularity among scientists, particularly in the astrobiology community: life is