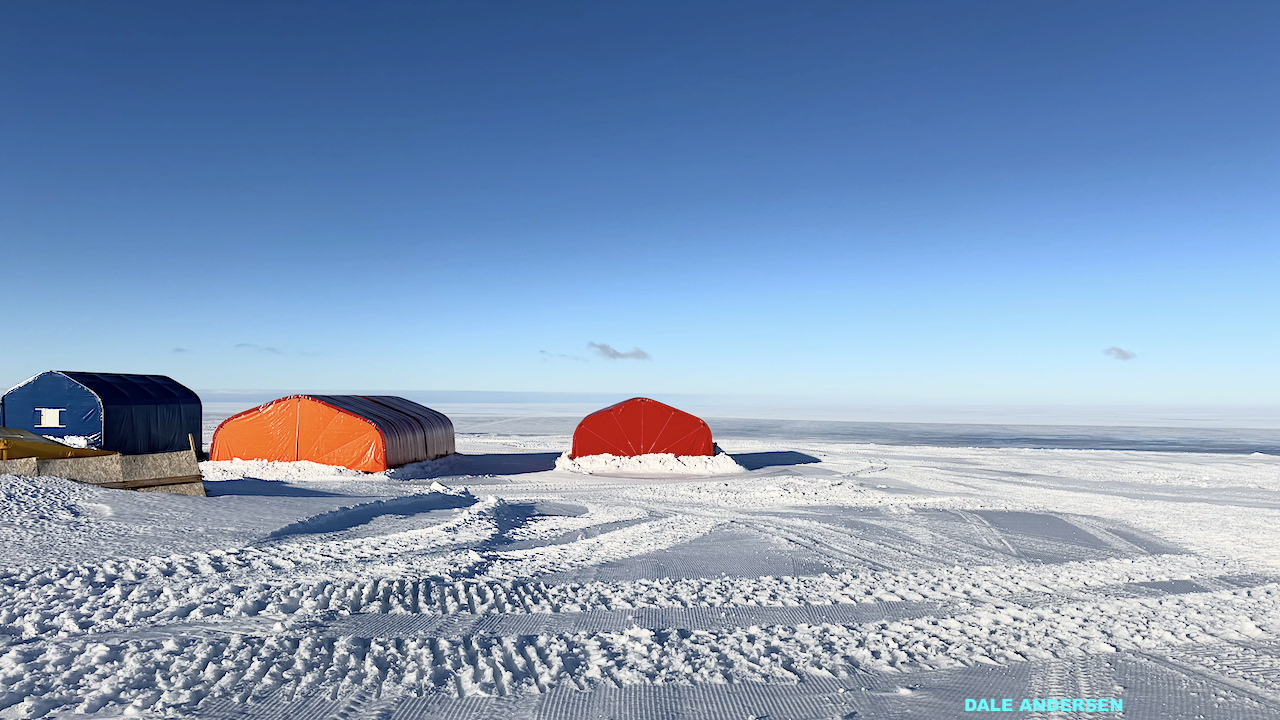
Our new storage facility at Ultima airbase adjacent to Novolazarevskaya Station is the smaller structure on the right — Dale Andersen Hi Keith, we had another busy day moving and

Our new storage facility at Ultima airbase adjacent to Novolazarevskaya Station is the smaller structure on the right — Dale Andersen Hi Keith, we had another busy day moving and
The abstract in PubMed or at the publisher’s site is linked when available and will open in a new window. Kumar K, Angdisen J, Fornace AJ Jr, Suman S.Elevated SASP
Hunting for “Oddballs” — Grok via Astrobiology.com This study explores the application of autoencoder-based machine learning techniques for anomaly detection to identify exoplanet atmospheres with unconventional chemical signatures using a
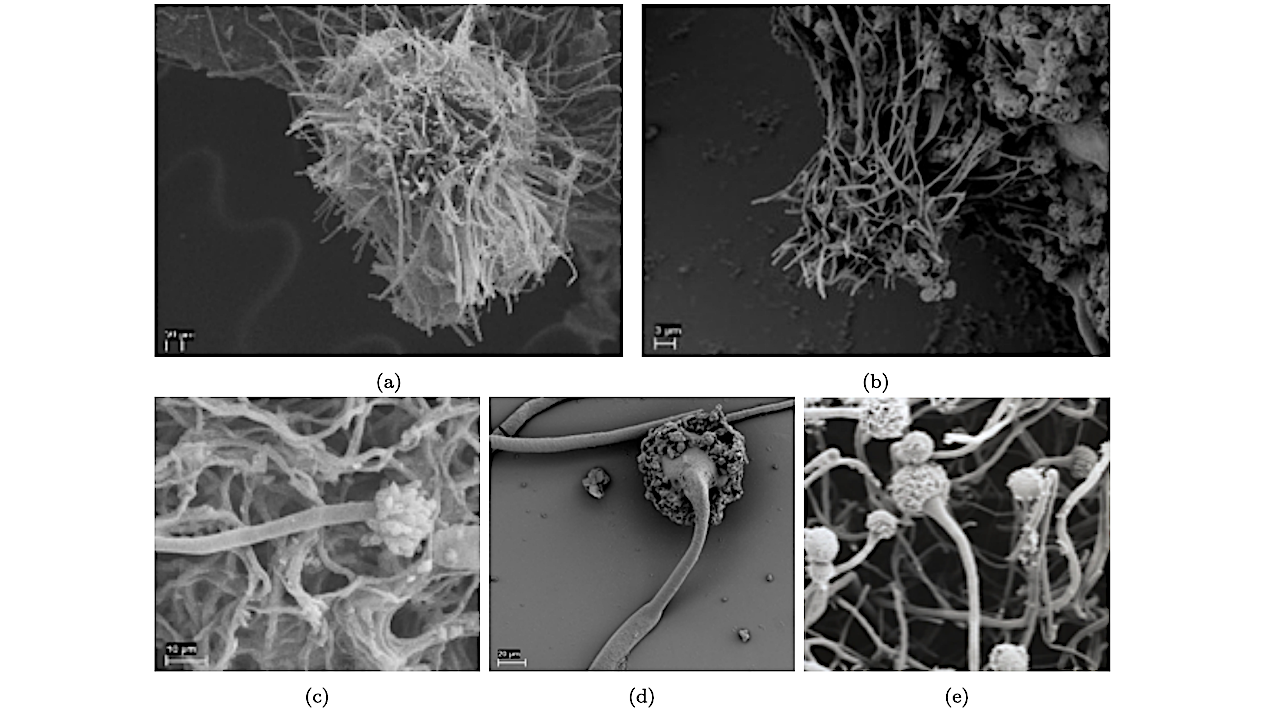
Biological and abiotic tubes. SEM images of tubular colonies of a) Aspergillus niger feeding on straw (image: Anna Neubeck) and b) manganese oxide chemical gardens (image: Huld et al., 2023).
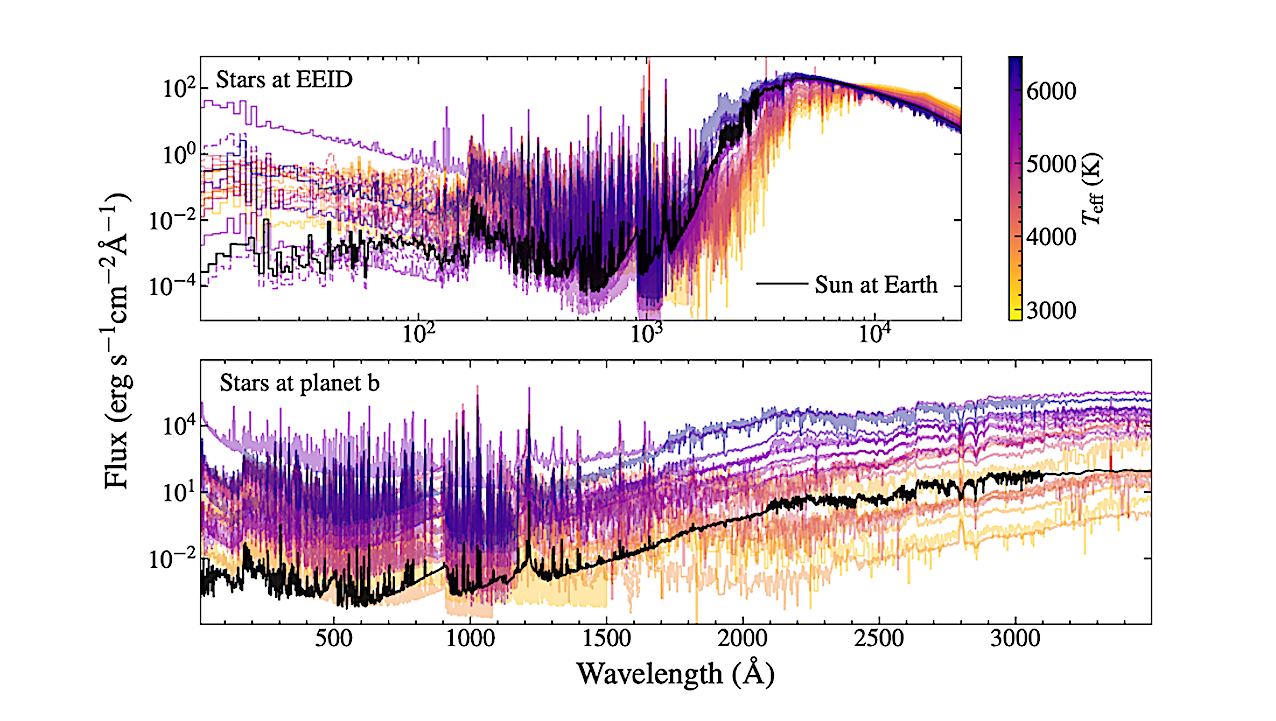
SEDs scaled to the EEID (top panel) and to the semi-major axis of each planet b (bottom panel). In the bottom panel the wavelength range is changed to expand the
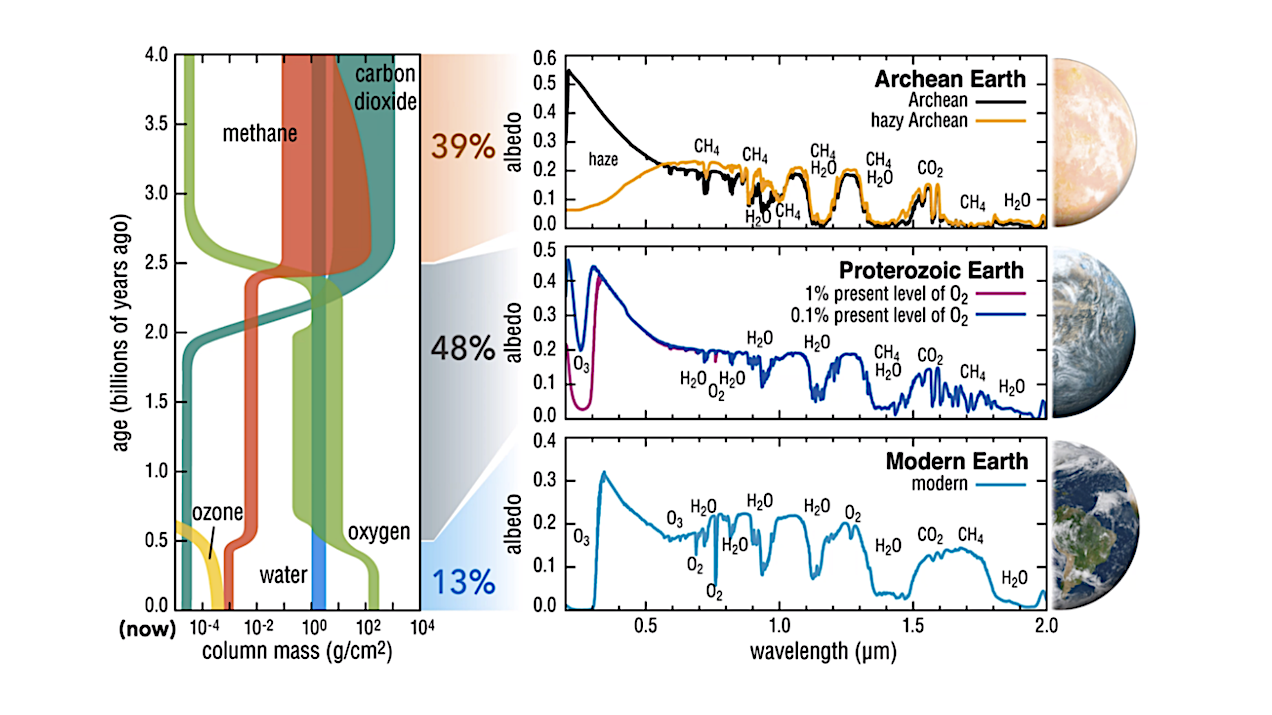
Earth’s planetary spectra through time as seen with the LUVOIR concept mission (LUVOIR Team, 2019). Credit: G. Arney, S. Domagal-Goldman, T. B. Griswold (NASA GSFC) — astro-ph.EP This article reviews
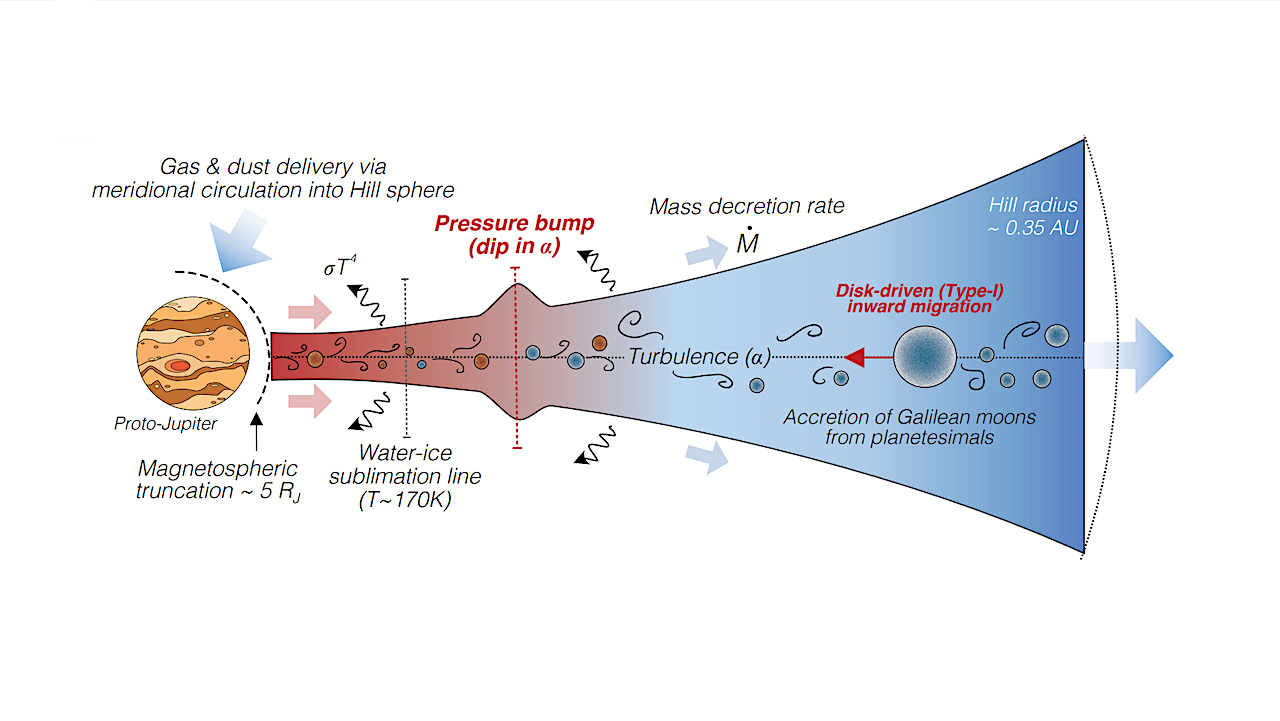
Schematic of the circum-Jovian decretion disk. Gas and dust from the circumsolar accretion disk are subsumed into the Jovian disk from approximately one hydrostatic scale height via meridional flows, and
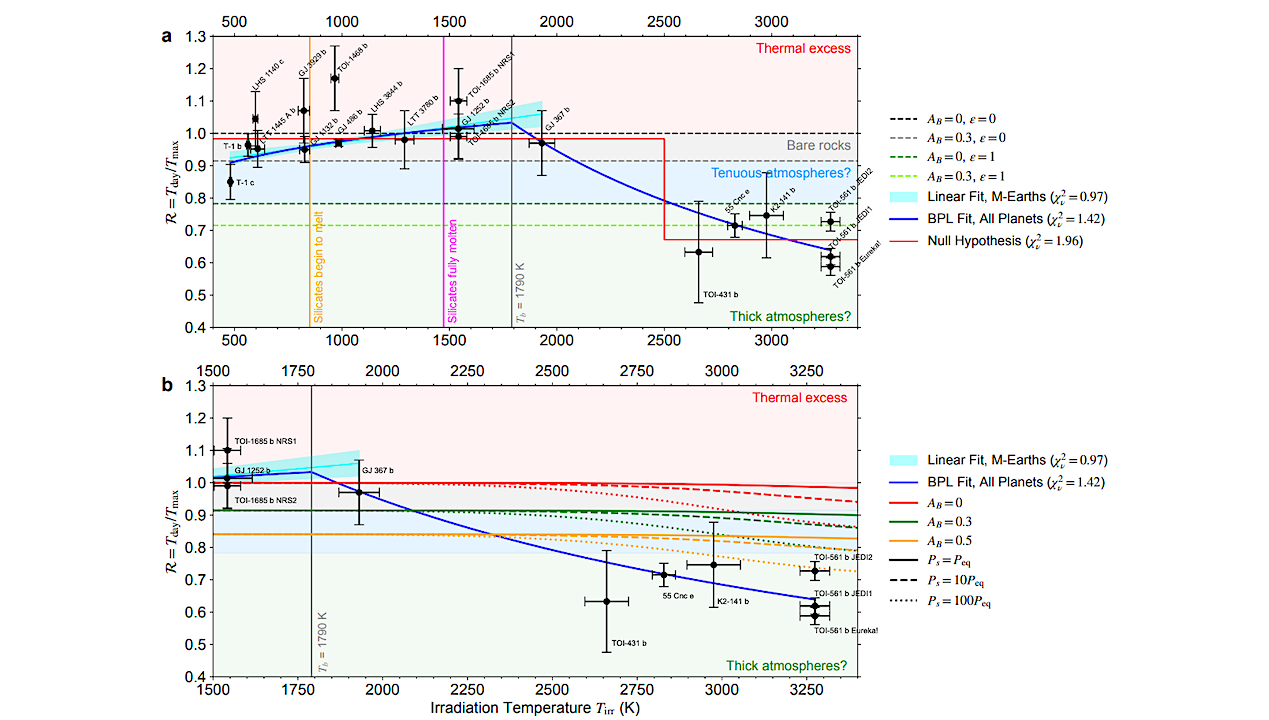
Dayside temperature scaling factor, R = Tday/Tday,max, as a function of irradiation temperature, Tirr, for (a) all observed rocky exoplanets and (b) planets with Tirr > 1500 K, which may
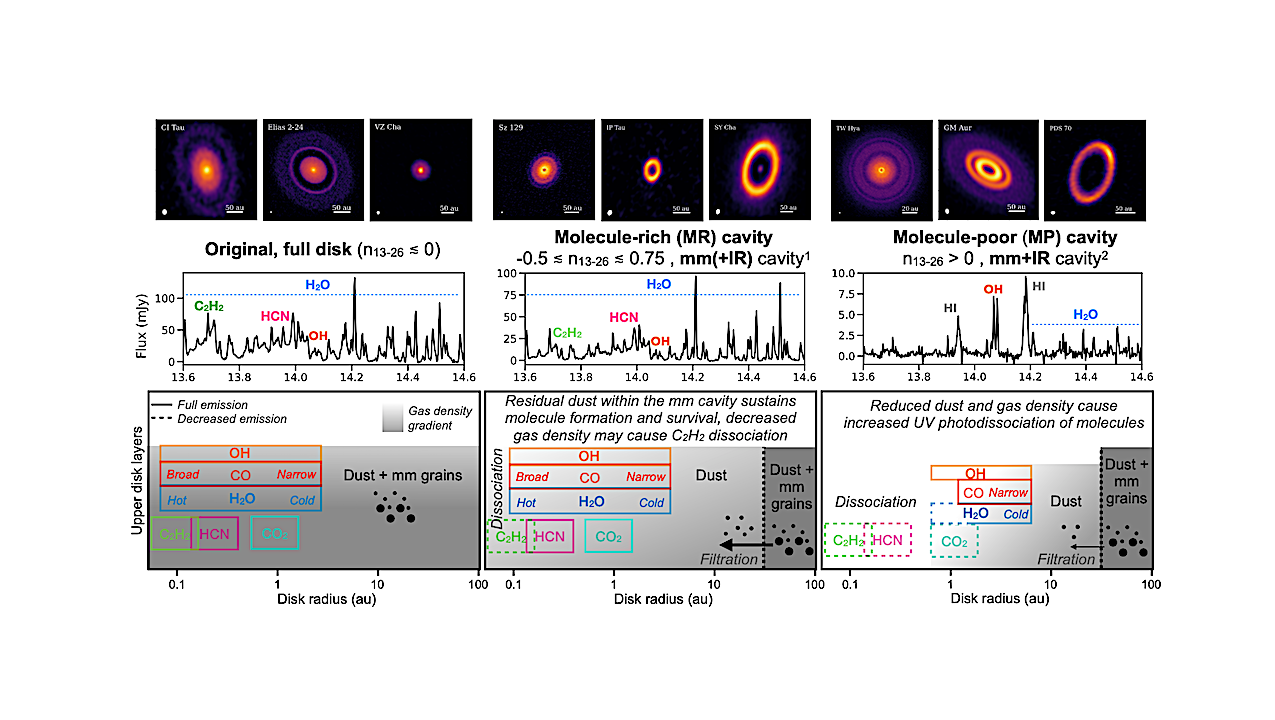
Schematic illustration of the properties and relative distribution of µm-size dust, mm grains, and molecular gas in the two cavity types presented in this work in comparison to a full
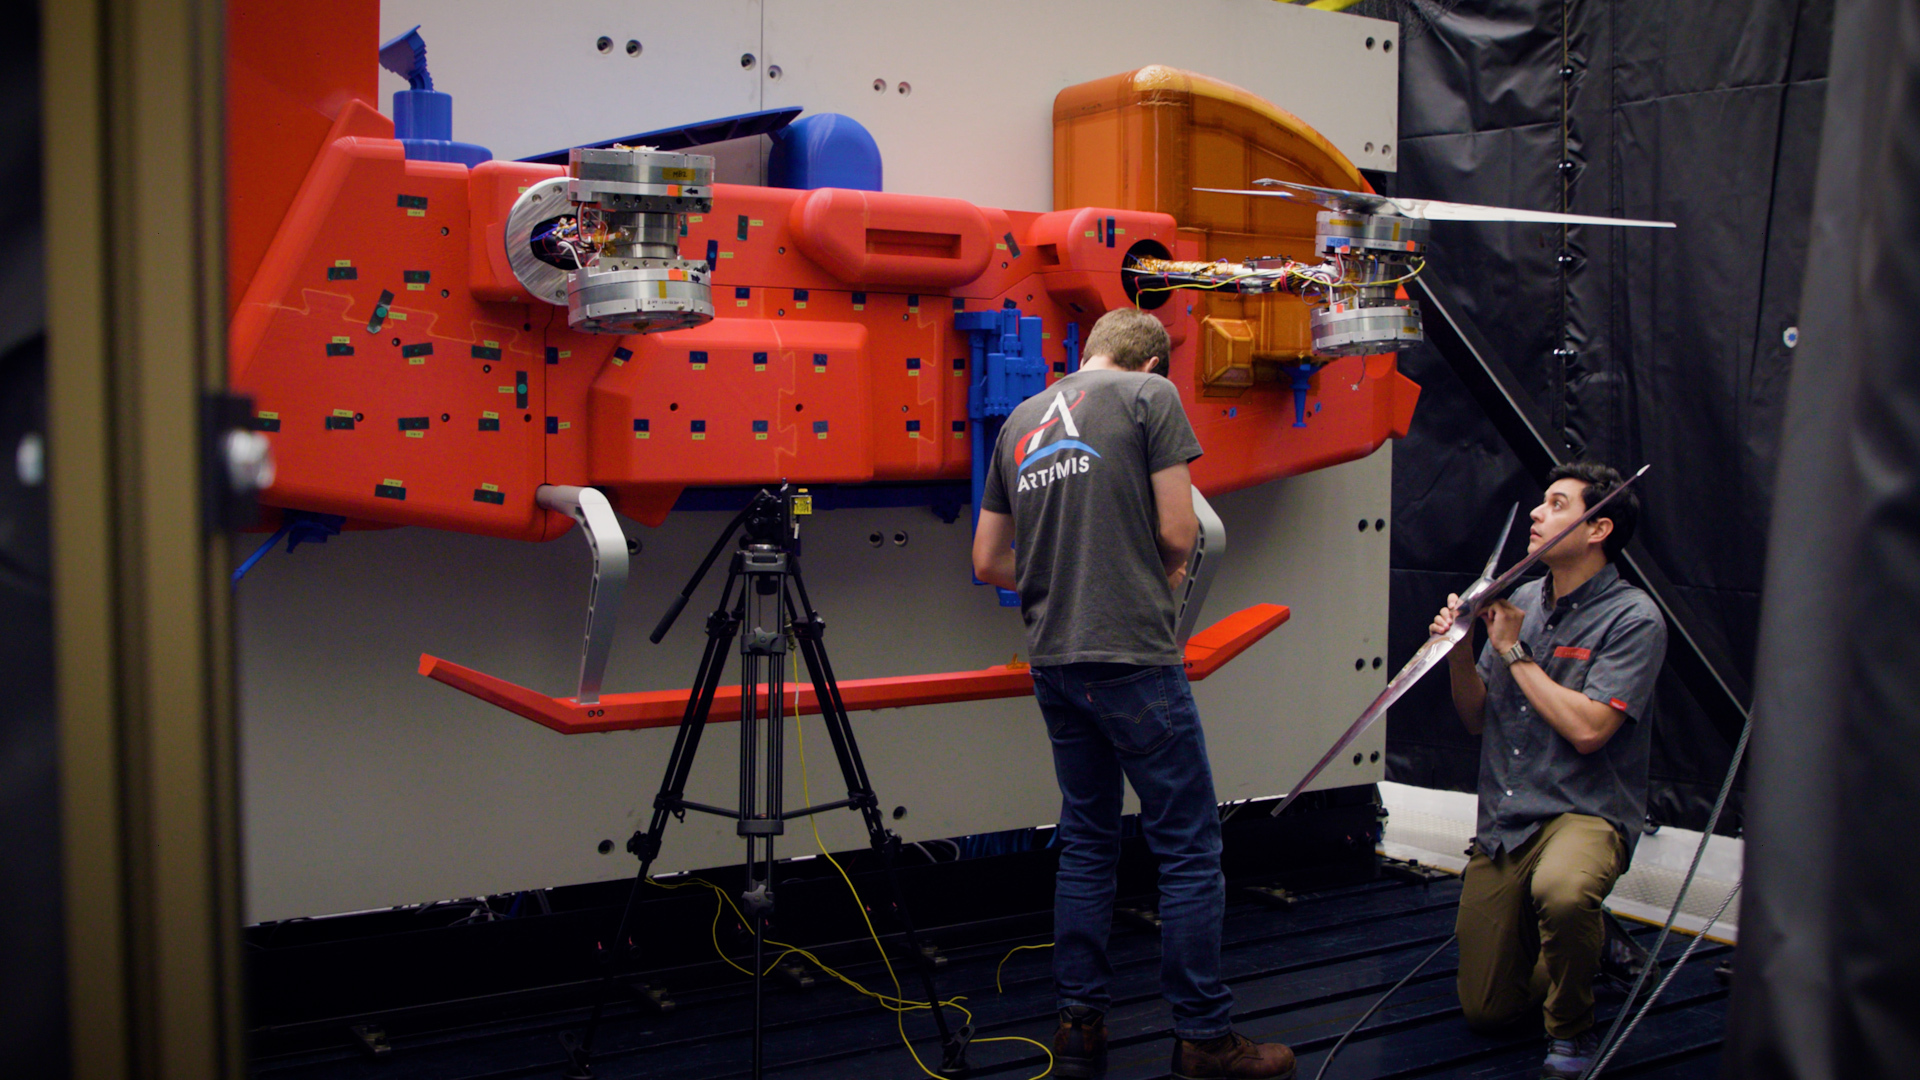
In sending a car-sized rotorcraft to explore Saturn’s moon Titan, NASA’s Dragonfly mission will undertake an unprecedented voyage of scientific discovery. And the work to ensure that this first-of-its-kind project