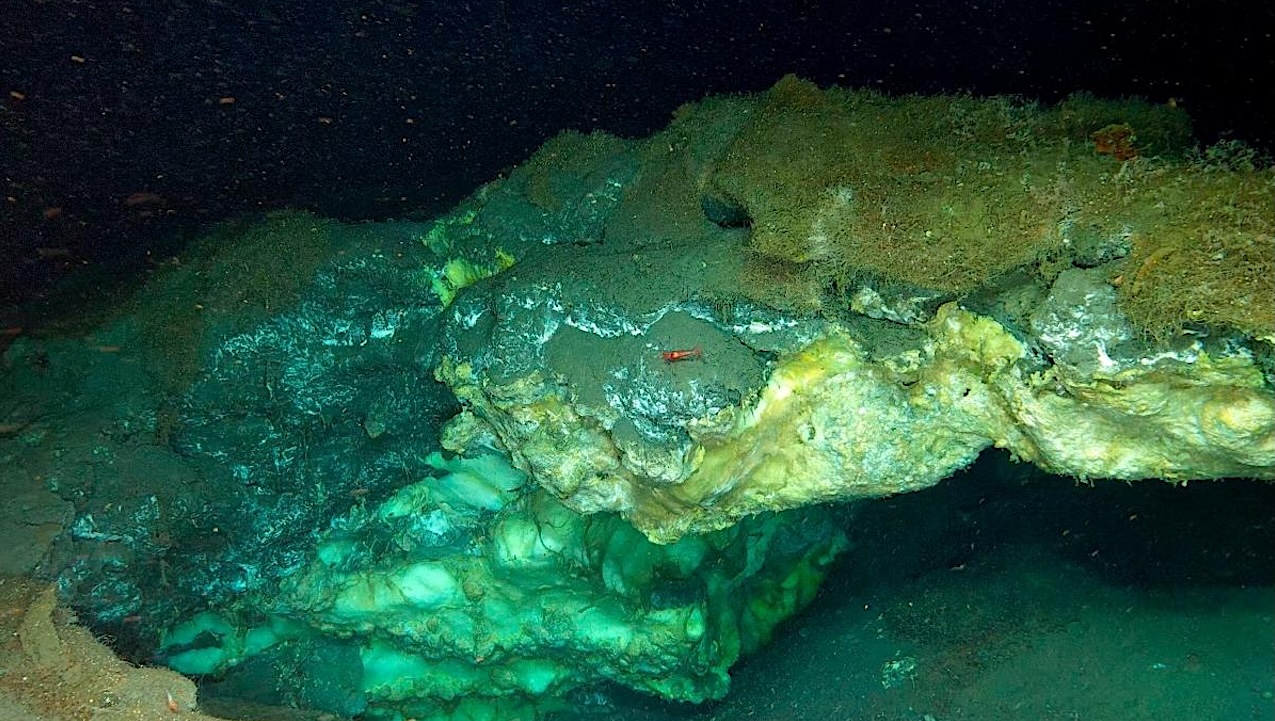
ROV image of a partially collapsed gas hydrate mound in the Molloy Deep (Freya mounds). The mound hosts frenulate worms and crustaceans. Photo: UiT / Ocean Census / REV Ocean

ROV image of a partially collapsed gas hydrate mound in the Molloy Deep (Freya mounds). The mound hosts frenulate worms and crustaceans. Photo: UiT / Ocean Census / REV Ocean
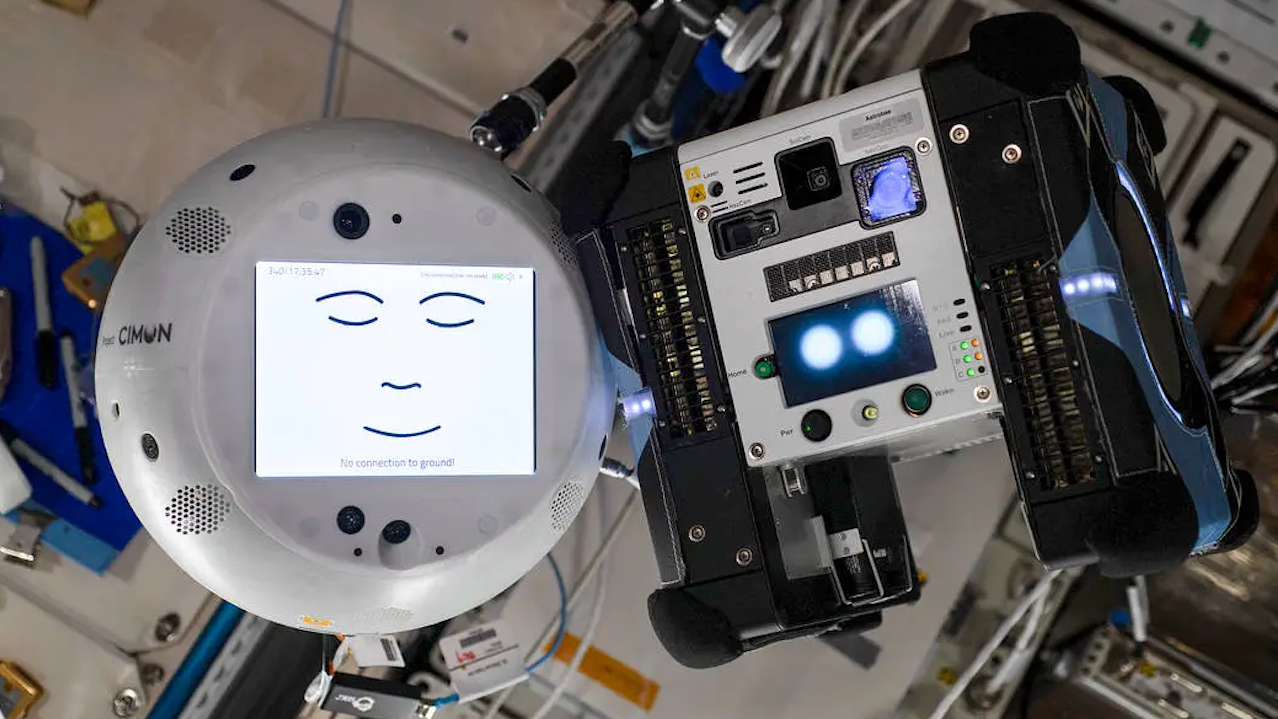
The Astrobee and Project CIMON (Crew Interactive MObile companioN) robots had their first photo shoot in space after more than two years of working separately aboard the International Space Station.

Distribution of hits (circles) and events (stars) over frequency and drift rate. The marker size gives the S/N. The gray-shaded regions show ranges not sampled, including narrow notch filter regions

Surviving rapid inward orbital migration is a crucial aspect of formation models for the Jupiter’s Galilean moons. (Source) The primary aim of this study is to investigate the orbital migration

H–R diagrams for the binary systems HD 130669, HD 184467, HD 191854, and HD 214222. The positions of the individual stellar components (A and B) are plotted with their respective
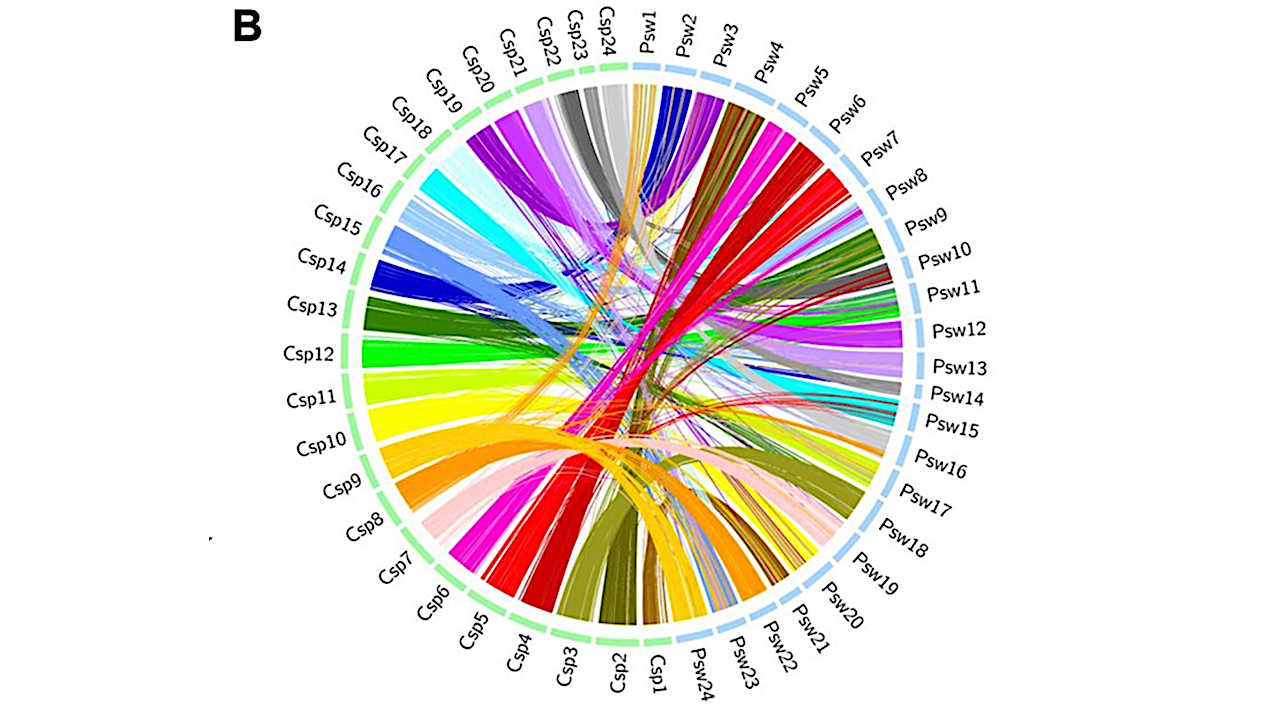
Pan-evolutionary analysis for identifying conserved gene clusters and karyotypes. (A–C) Microsynteny analysis among deep ocean organisms. Circos plot for distribution and visualization of microsynteny blocks between two deep ocean organisms.
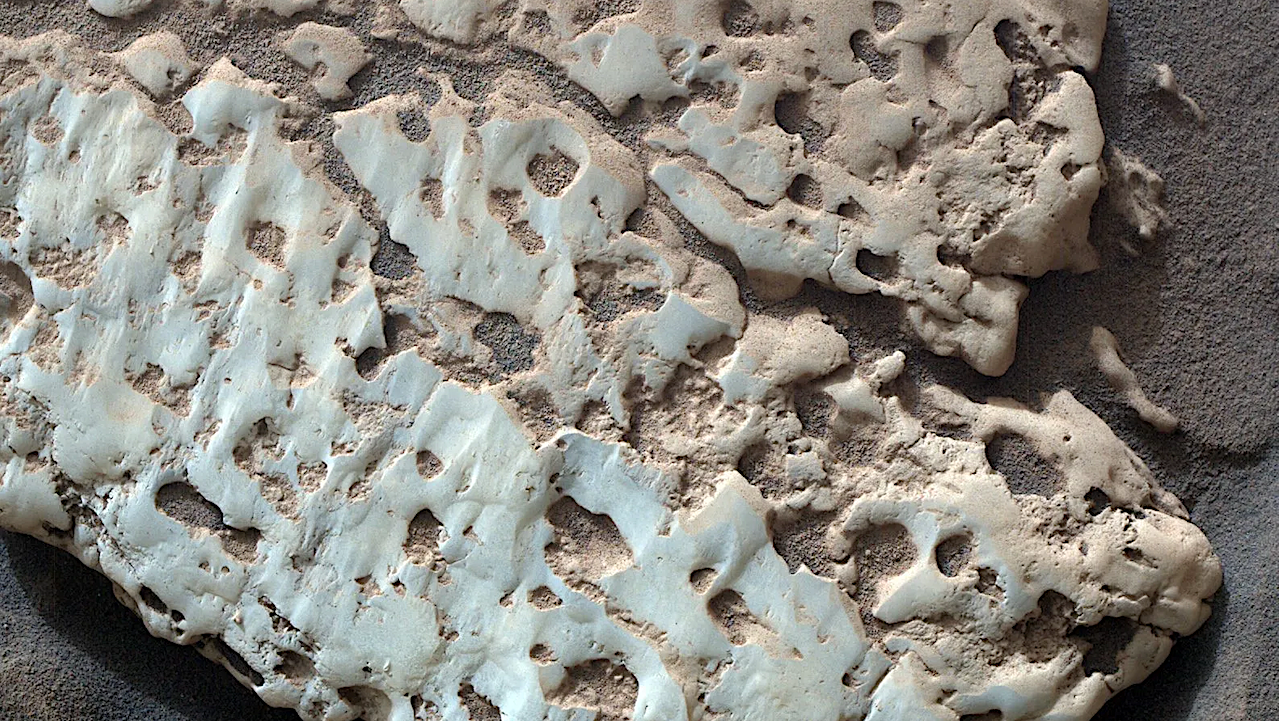
NASA’s Curiosity captured this close-up image of a rock nicknamed “Snow Lake” on June 8, 2024, the 4,209th Martian day, or sol, of the mission. Nine days earlier, the rover
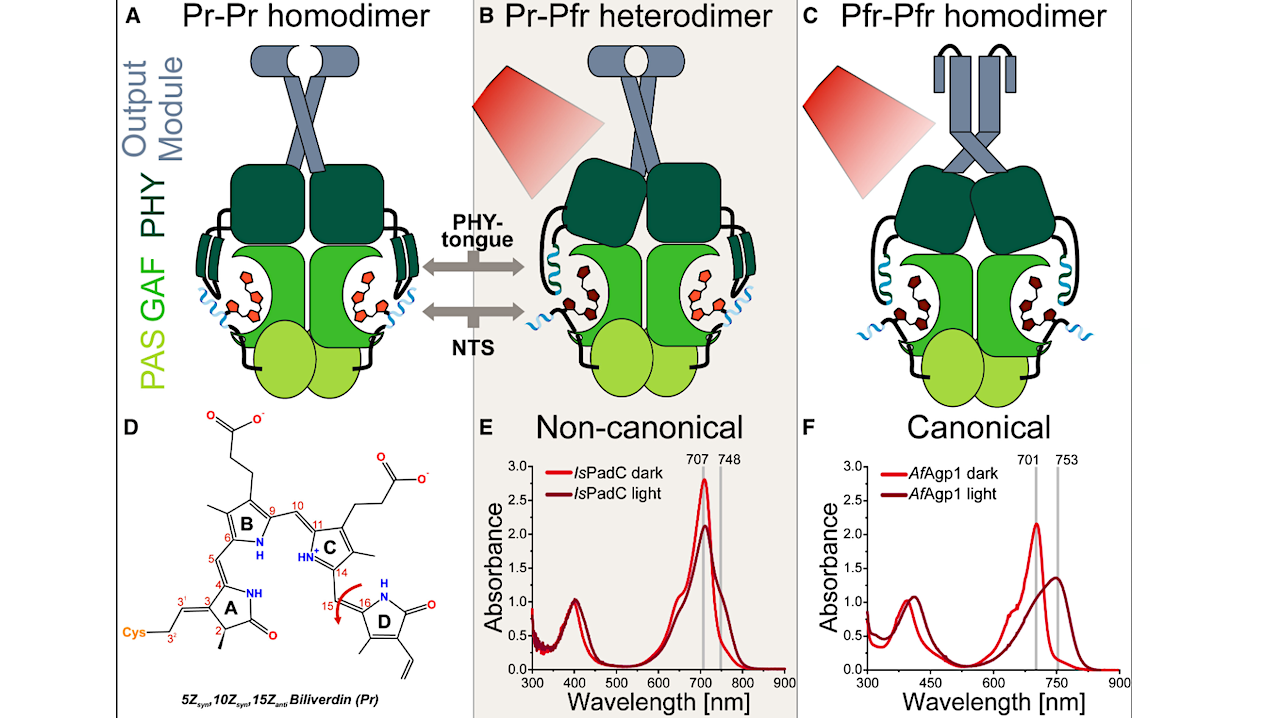
The prototypical PAS (grass green)-GAF (green)-PHY (dark green)-output module (grey-blue) arrangement of bacteriophytochromes is depicted. The N-terminal segment (NTS, blue) and the PHY tongue (dark green β sheets or blue-green
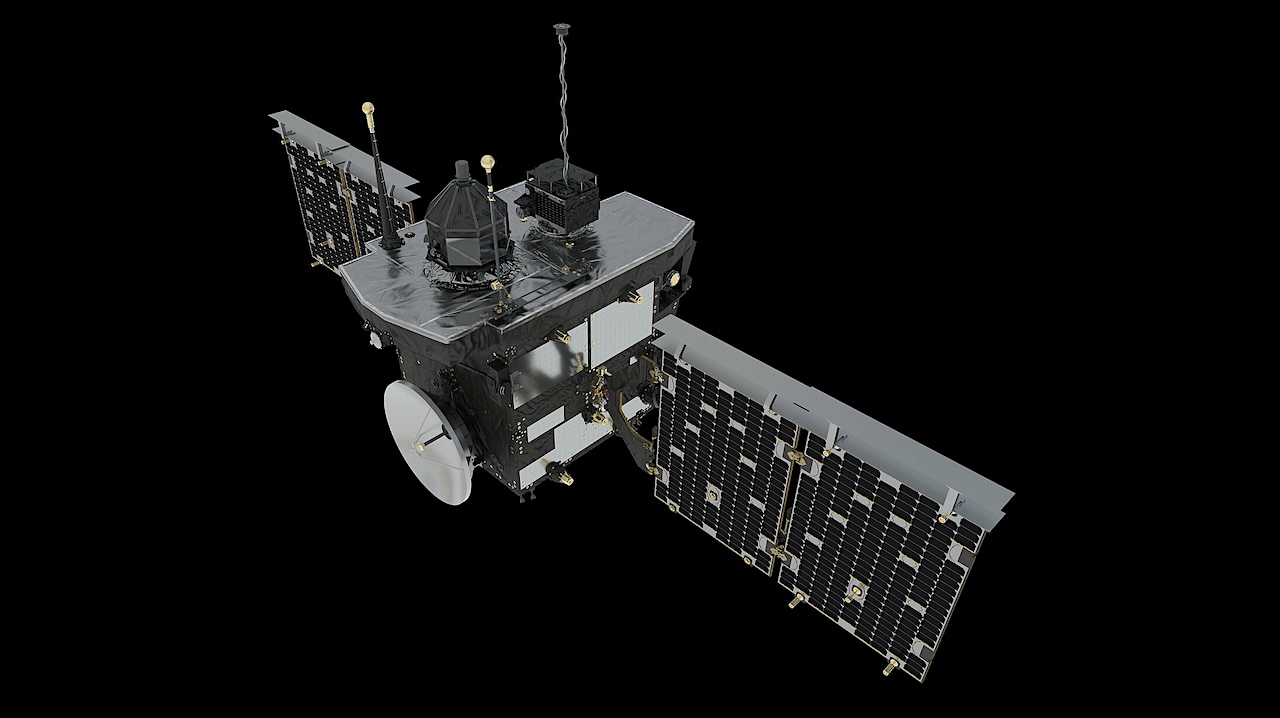
Comet Interceptor — ESA Comet Interceptor is an ESA science mission with payload contributions from ESA Member States and with an international participation by JAXA. It is the first mission
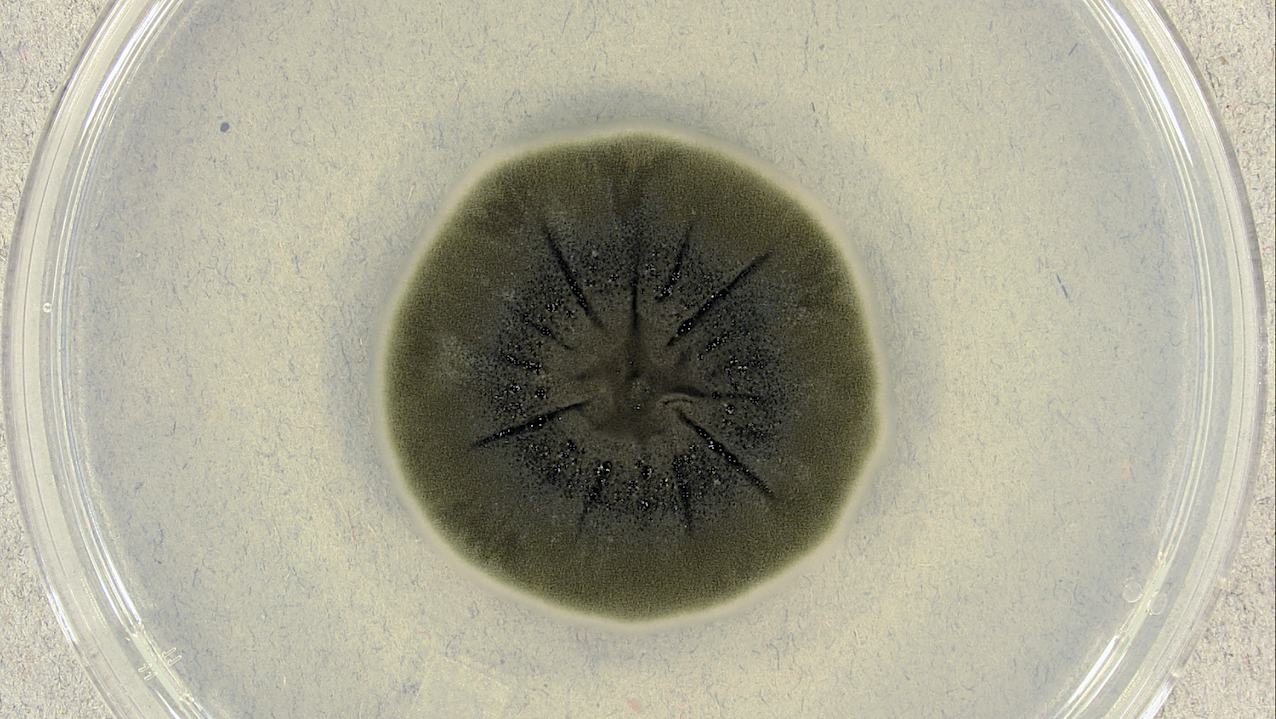
Cladosporium sphaerospermum (UAMH 4745) on potato dextrose agar after incubation for 14 days at 25°C. — Wikipedia Extensive fungal growth has been detected on the walls and other building constructions