Graphic of the proposed scenario of sublimation in a disk with a warm dust trap, viewed from the side, based on van der Marel et al. (2021b). If the bulk

Graphic of the proposed scenario of sublimation in a disk with a warm dust trap, viewed from the side, based on van der Marel et al. (2021b). If the bulk

This NASA/ESA Hubble Space Telescope image features a section of the Tarantula Nebula in the Large Magellanic Cloud. ESA/Hubble, NASA, and C. Murray larger image Comparative analysis of redox properties

LIFE RCN Workshop Join the 2026 LIFE NASA RCN Seminar Series! This month’s speakers are Dr. Ilya Bobrovskiy and Dr. Tharika Liyanage. Time: January 6th, 8AM PDT/11AM EDTJOIN Title: Unmixing
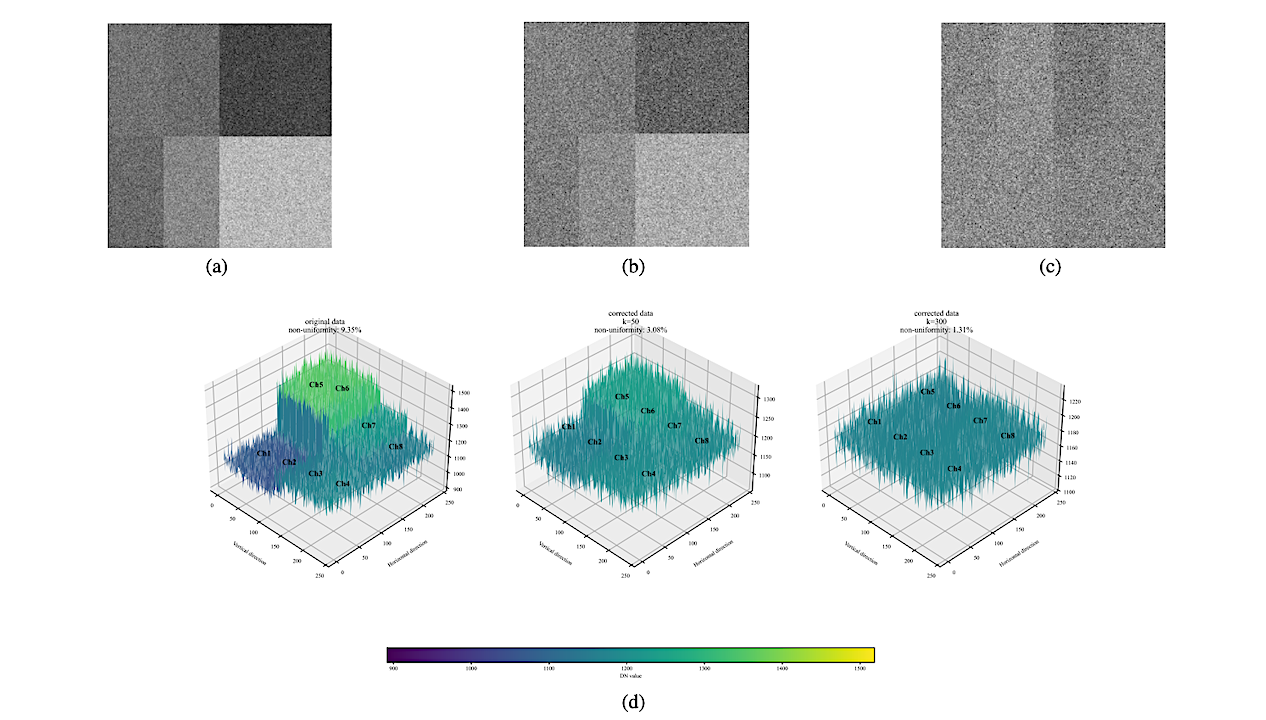
The systematic evaluation of algorithm effectiveness. (a) displays the original flat-field response distributions following background correction. Panels (b,c) illustrate the corrected results after algorithm processing, while (d) presents the distribution
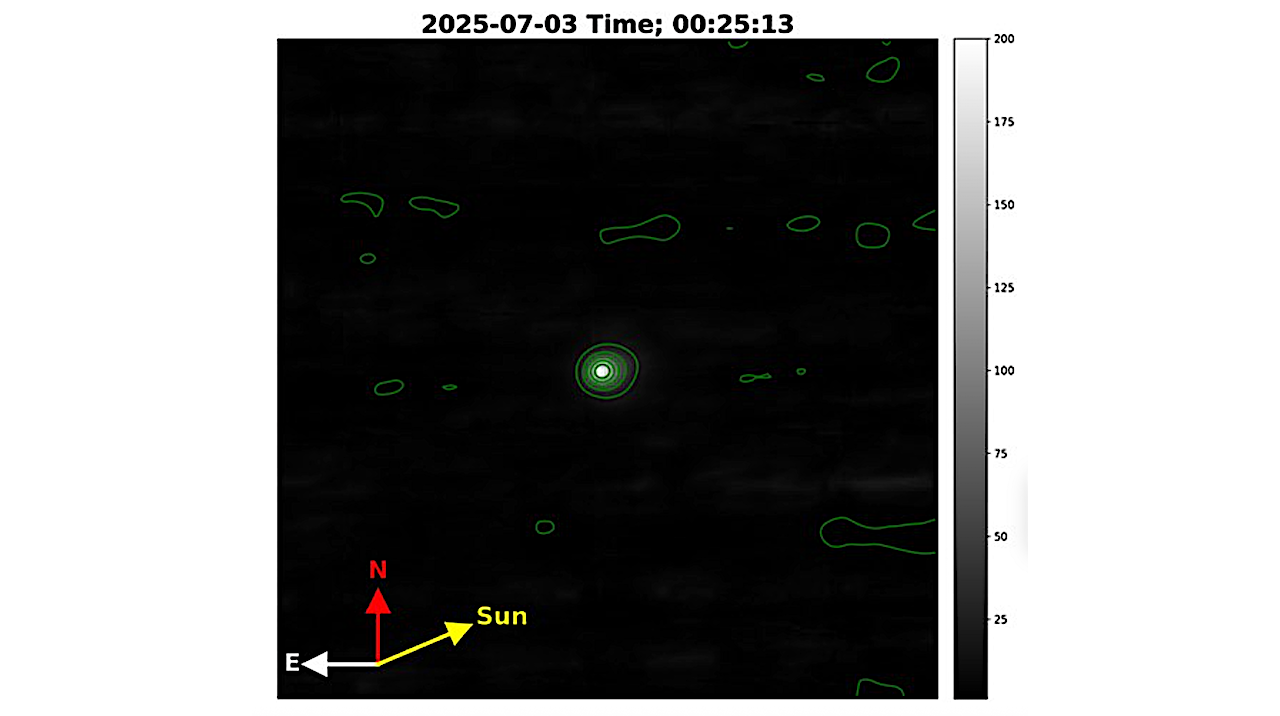
The comet 3I/ATLAS, discovered by an international team in July this year, is only the third interstellar object ever found in the history of astronomy. It is the first that

Dust clouds reflect starlight around the star R Doradus. As it nears the end of its life, the star is shedding its outer layers, forming clouds of gas and dust
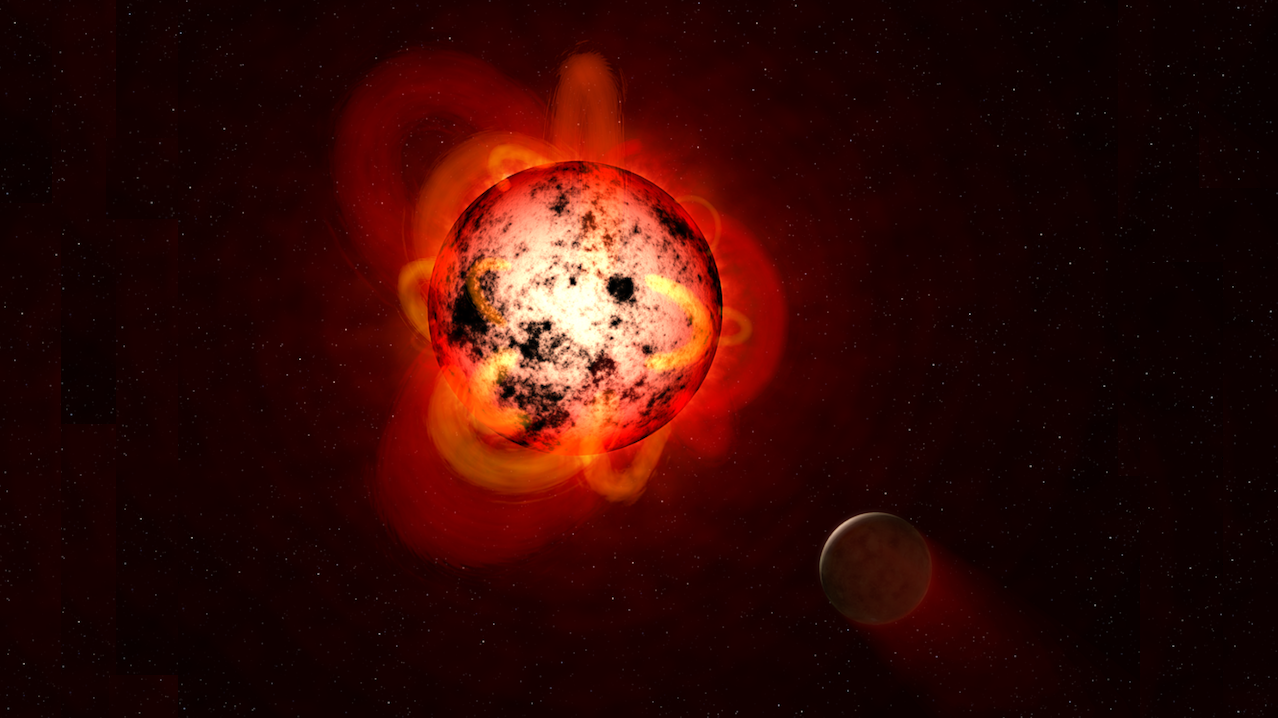
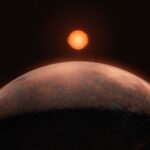
This illustration shows a red dwarf star orbited by a hypothetical exoplanet. — NASA source As of late 2025 there are about 70 exoplanets that meet the formal criterion of
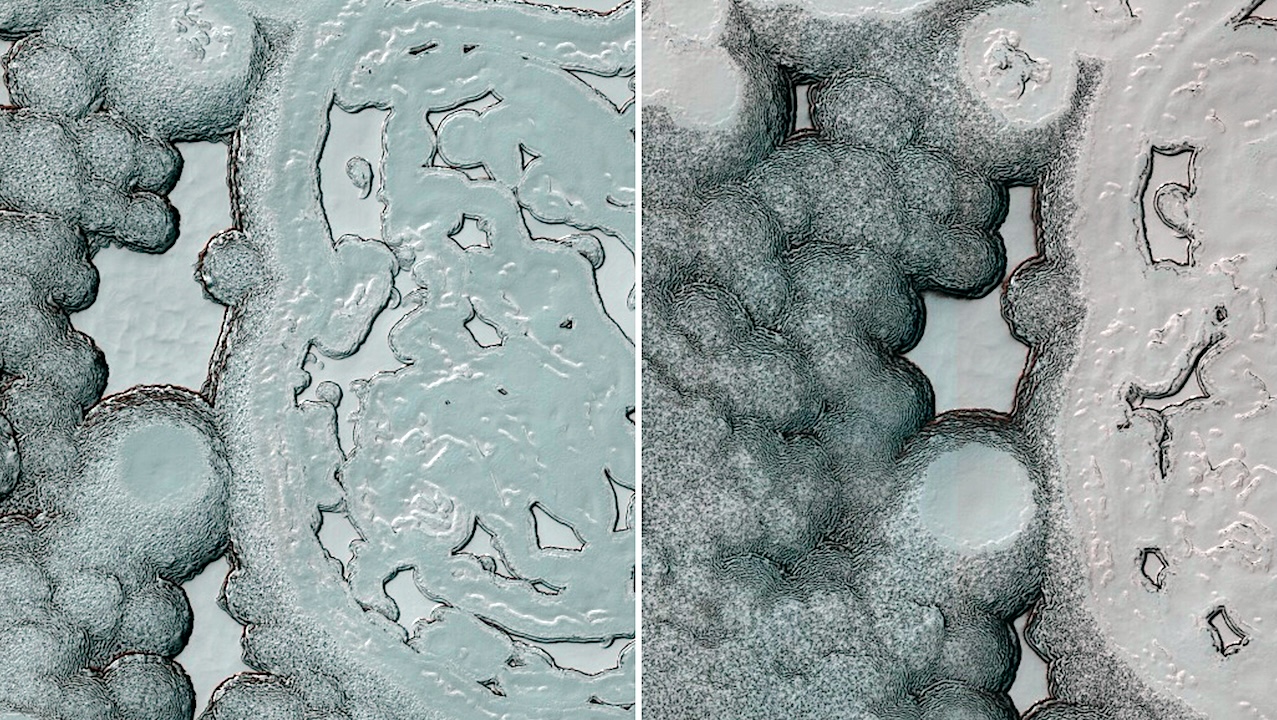
ID: ESP_040566_0935 date: 23 March 2015 altitude: 245 km larger image NASA/JPL-Caltech/University of Arizona The South Polar residual cap (the part that lasts through the summer) is composed of carbon
Keith Cowing Explorers Club Fellow, ex-NASA Space Station Payload manager/space biologist, Away Teams, Journalist, Lapsed climber, Synaesthete, Na’Vi-Jedi-Freman-Buddhist-mix, ASL, Devon Island and Everest Base Camp veteran, (he/him) 🖖🏻 Follow on
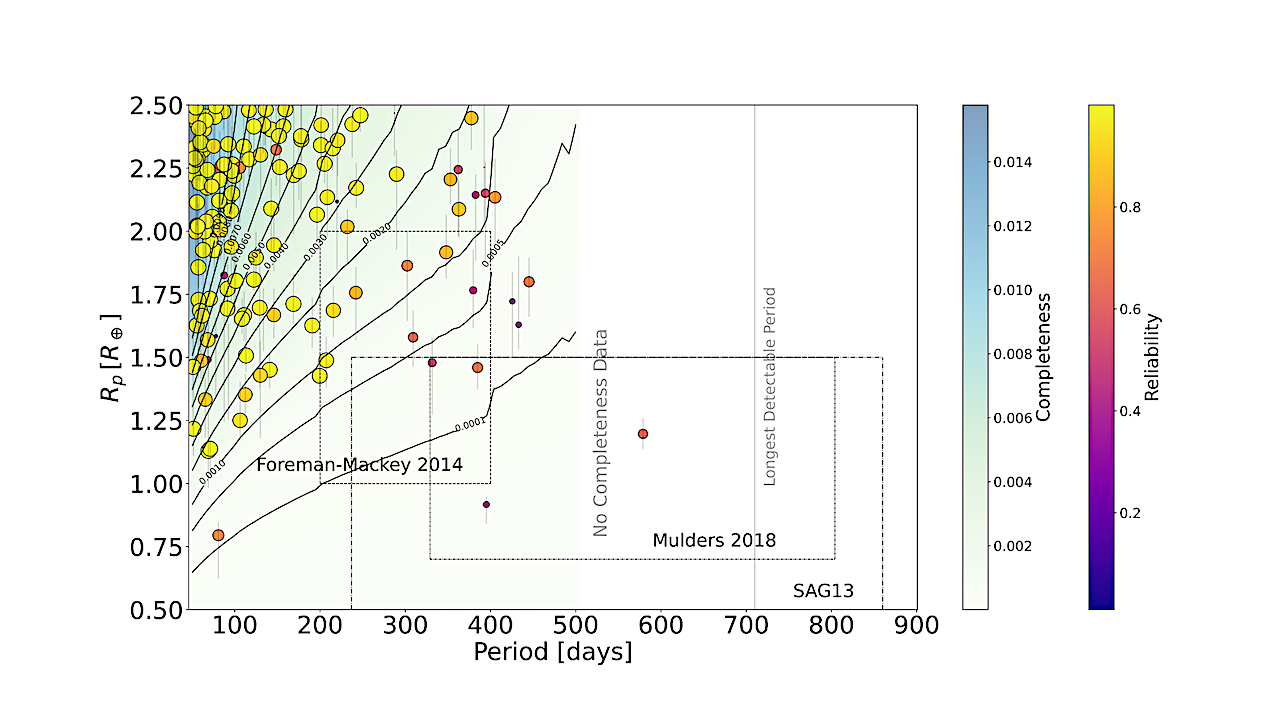
The Kepler exoplanet candidate population around FGK stars used in the analysis of S. Bryson et al. (2021), shown in period and radius, both colored and sized by catalog reliability