Using a NASA Tricorder to scan for life signs aka biosignatures – Astrobiology.com and Grok A machine learning framework can distinguish molecules made by biological processes from those formed through

Using a NASA Tricorder to scan for life signs aka biosignatures – Astrobiology.com and Grok A machine learning framework can distinguish molecules made by biological processes from those formed through
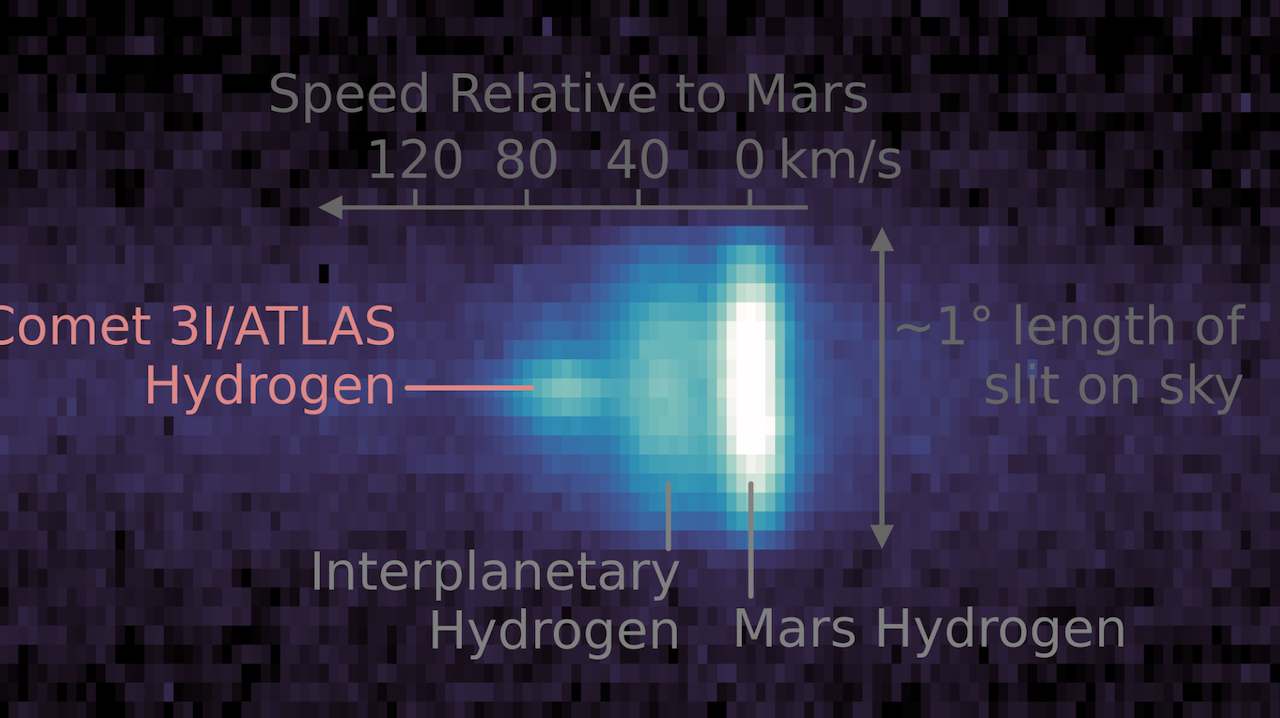
Interstellar Comet 3I/ATLAS As Seen By NASA’s MAVEN Mission Larger imagery An ultraviolet image composite of the hydrogen atoms surrounding comet 3I/ATLAS, the third interstellar object ever detected by astronomers,
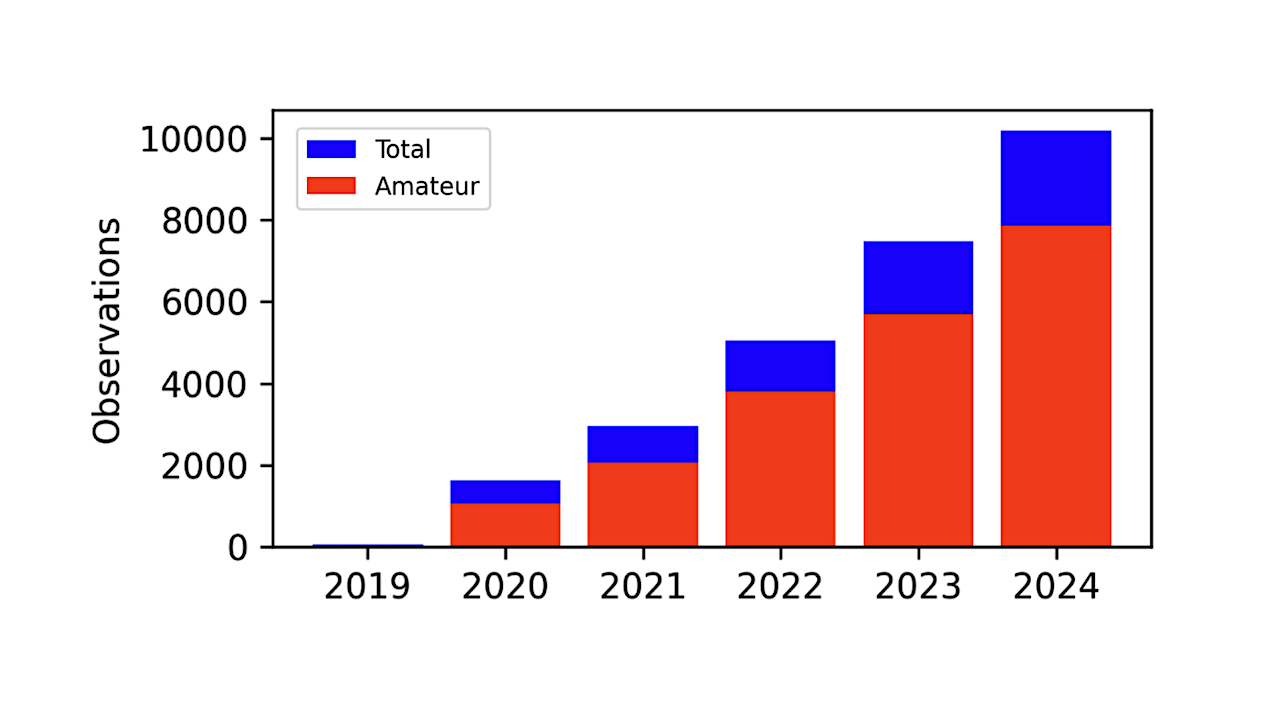
Cumulative distribution of observations published by the ExoClock network. –astro-ph.EP The ExoClock project is an open platform aiming to monitor exoplanets by integrating observations from space and ground based telescopes.
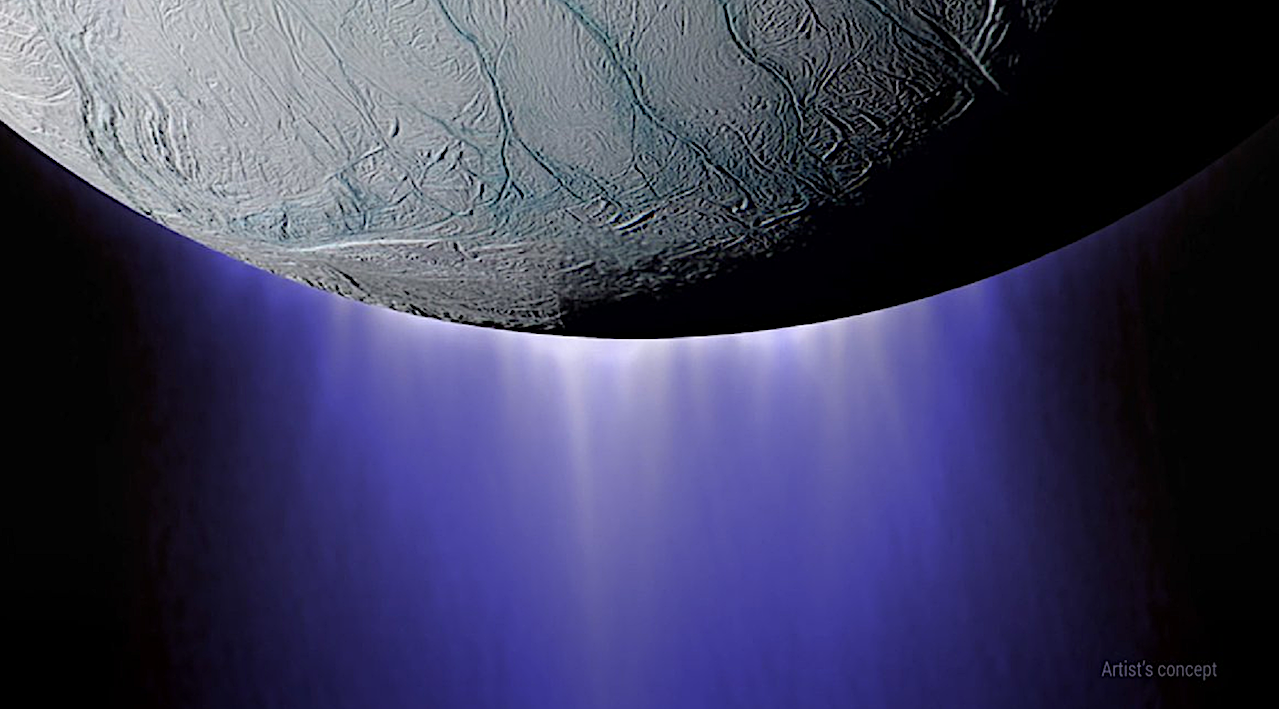
Plumes on Enceladus (artist concept)– NASA JPL NASA’s Cassini spacecraft captured dramatic plumes, both large and small, spray water ice out from many locations along the famed ‘tiger stripes’ near
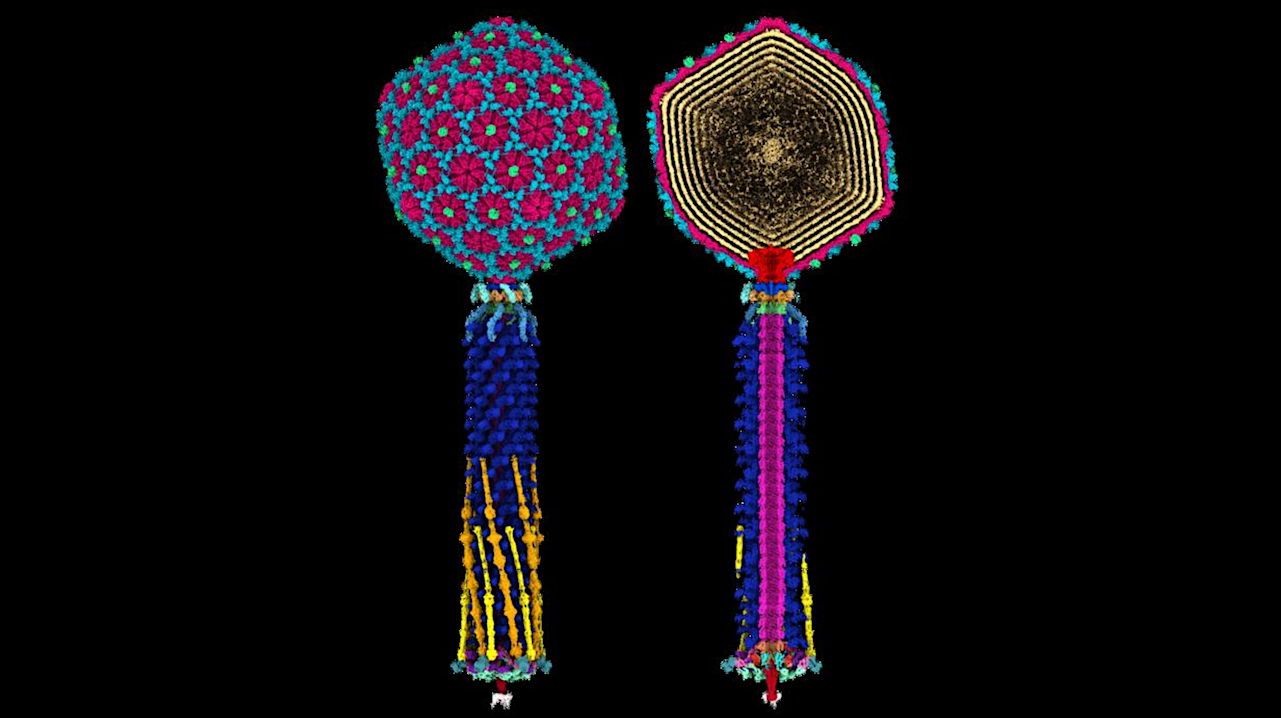
Structure of Bas63, a virus which targets E. coli, in molecular detail. Credit University of Otago A University of Otago – Ōtākou Whakaihu Waka-led study has produced a detailed blueprint
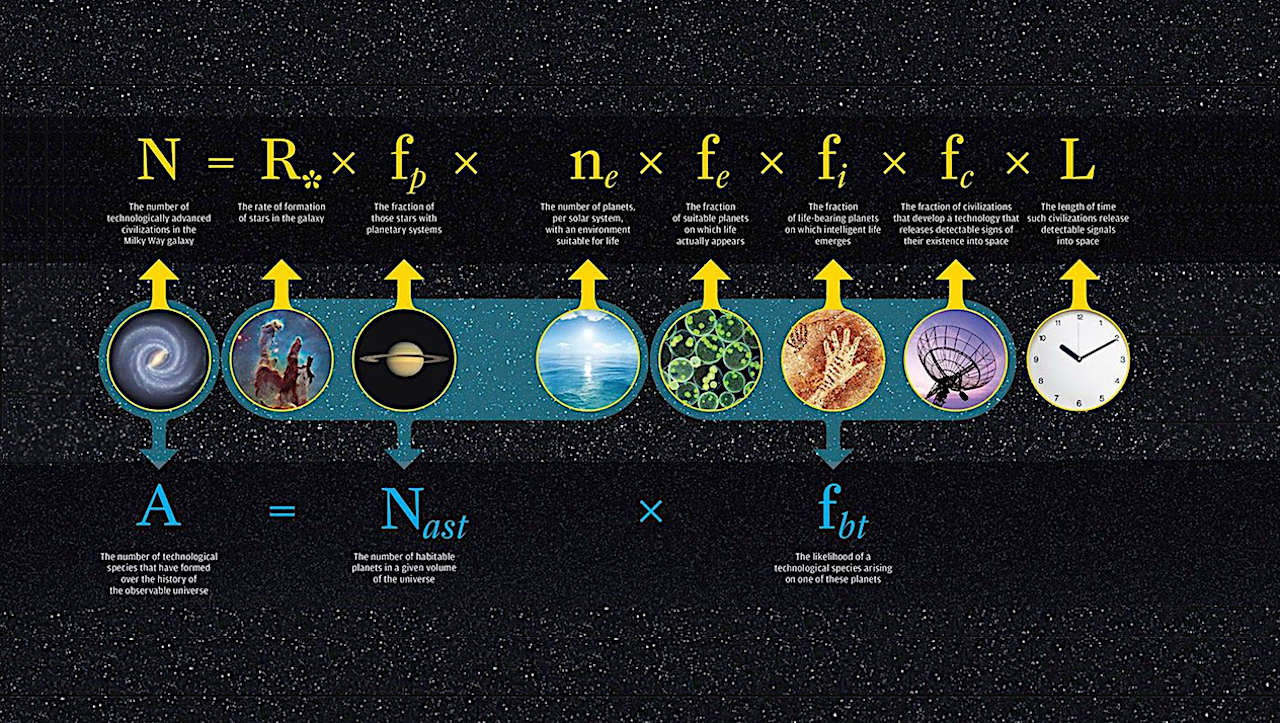
Drake equation — NASA Speculation about the existence of advanced forms of life in the Universe and in our galaxy, has been since ever a subject of fascination and discussion
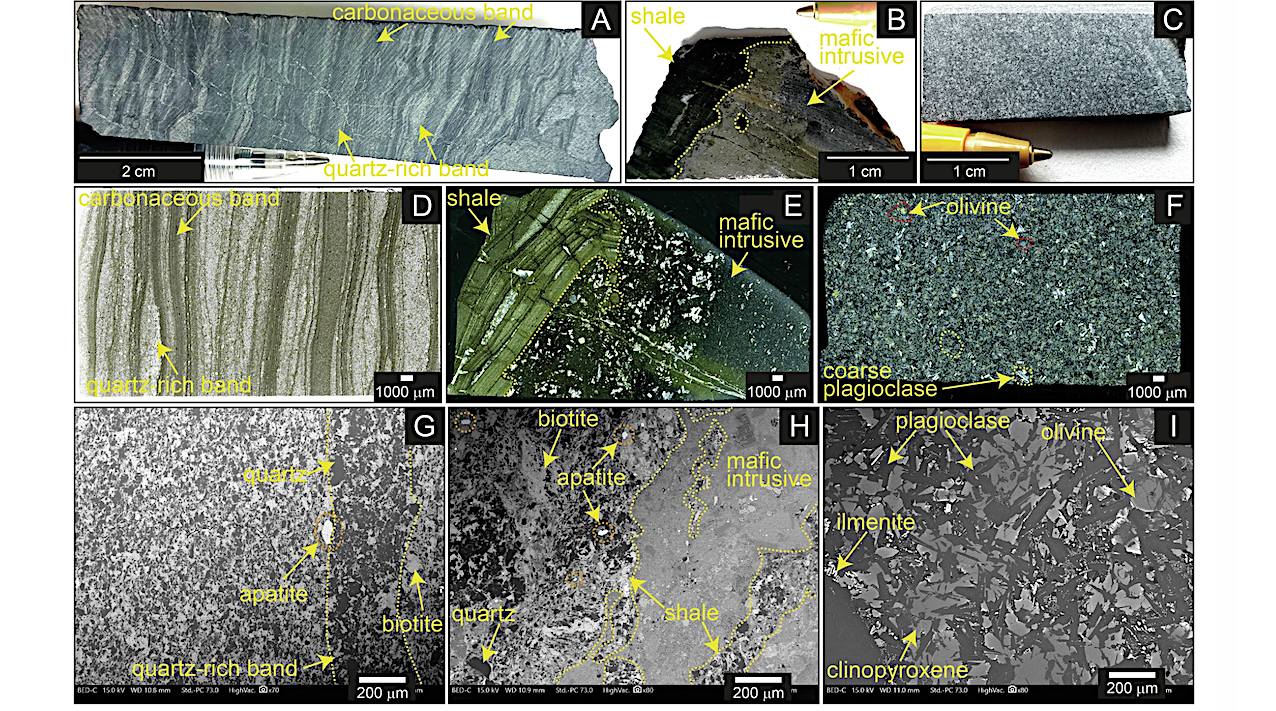
A–C, D–F, and G–I are hand specimen, optical microscopic, and back-scattered electron images, respectively. A, D, and G (sample no. B20) show textures in metasedimentary strata. They contain apatite and

Keith Cowing Explorers Club Fellow, ex-NASA Space Station Payload manager/space biologist, Away Teams, Journalist, Lapsed climber, Synaesthete, Na’Vi-Jedi-Freman-Buddhist-mix, ASL, Devon Island and Everest Base Camp veteran, (he/him) 🖖🏻 Follow on
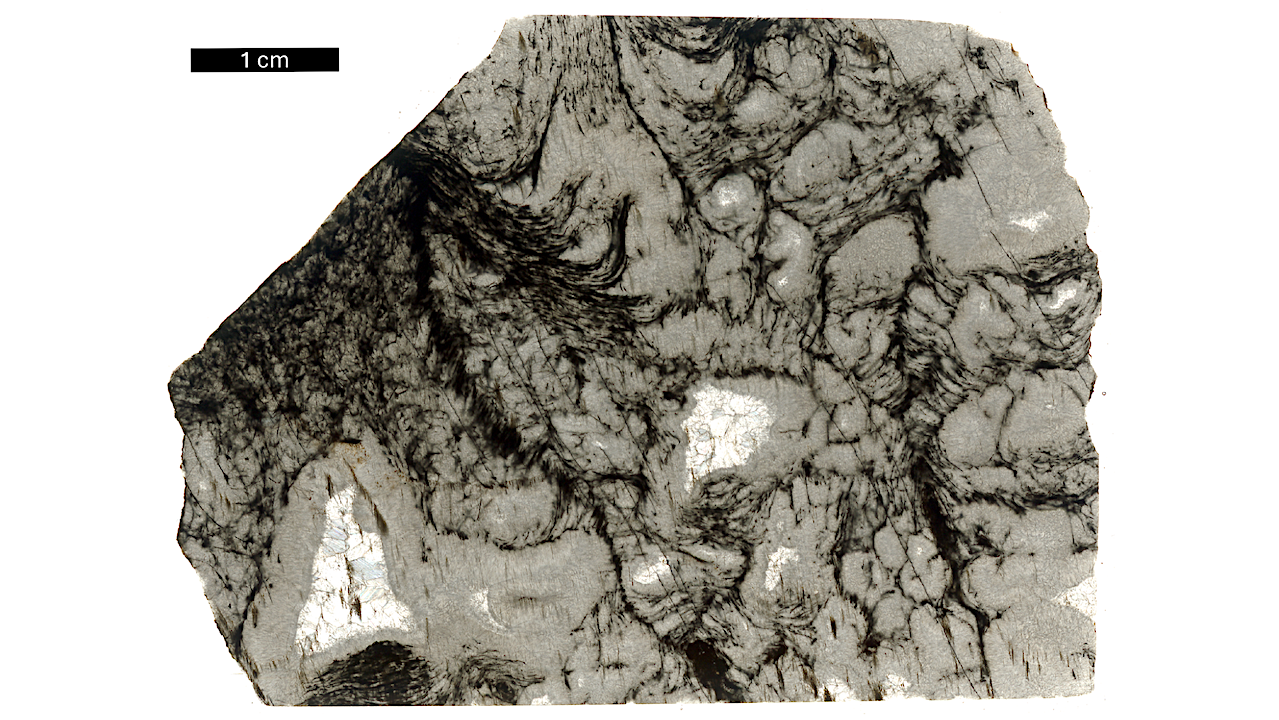
2.5 billion year old microbial structures — The black features within this thin slice of rock are 2.5-billion-year-old microbial structures. This study suggests that the organic matter preserved within this
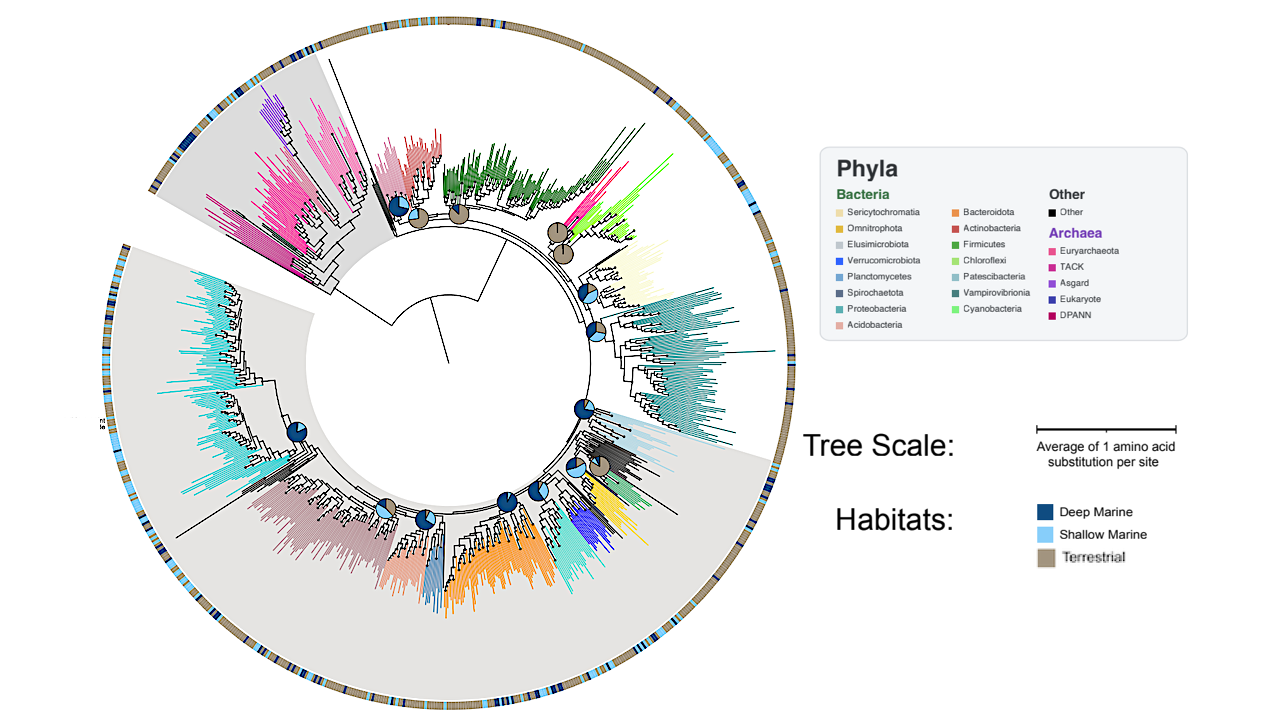
Tree of life (“species tree”) used for gene reconciliation analyses, showing reconstructed habitats for specific phyla over time. Phyla are color-coded and grouped to match to the larger phylum groups