
Now Reading: ESA data records help underpin climate change report
-
01
ESA data records help underpin climate change report

25/08/2025
177 views
11 likes
According to the newly released 35th State of the Climate report, 2024 saw record highs in greenhouse gas concentrations, global land and ocean temperatures, sea levels, and ocean heat content. Glaciers also suffered their largest annual ice loss on record. Data records from ESA’s Climate Change Initiative helped underpin these findings.
Published annually since 2011 as a supplement to the Bulletin of the American Meteorological Society (BAMS), the State of the Climate report is widely regarded as the most authoritative assessment of Earth’s climate. Drawing on observations from satellites, weather stations, ocean buoys and field research, it offers a comprehensive overview of the planet’s vital signs, providing a trusted record of ongoing climate change.
ESA’s Climate Change Initiative plays a significant role in this effort by turning decades of satellite observations into consistent, long-term datasets of essential climate variables – such as sea level, sea ice, glaciers, permafrost and soil moisture. These records not only feed into the State of the Climate but also provide critical evidence for international climate assessments and action.
Clement Albergel, Head of ESA’s Actionable Climate Information Section, said, “For more than a decade, our climate data records have contributed to the BAMS State of the Climate report, reflecting the commitment and expertise of our teams in delivering high-quality, robust Earth observation datasets.
“These long-term records are essential for providing clear evidence of how our planet’s climate is changing.
“ESA’s contribution to this year’s report again spans multiple components of the Earth’s system. The essential satellite data and insights provided by the Climate Change Initiative projects helped to document global climate conditions, with respect to long-term trends, and changes observed in 2024.”
In particular, records of soil moisture, lake-surface temperature, permafrost, land-surface temperature and stratospheric ozone were used in the State of the Climate report.
Soil moisture: satellite microwave data expose regional variability
Global data revealed significant contrasts in soil moisture. Regions like the Sahel saw levels twice as high as normal, while much of the Americas faced severe drought conditions, including record-breaking drought coverage in the United States that affected nearly half the country.
The animation above shows 2024 monthly anomalies of soil water content compared to the reference period 1991–2020.
These insights come from the Climate Change Initiative Soil Moisture Project, which uses microwave satellite sensors, including ESA’s heritage ERS and current SMOS Earth Explorer missions, to track water content in soils worldwide. The project delivers crucial information for assessing the risks of drought and flooding, as soil moisture affects everything from crop growth to the wildfire danger.


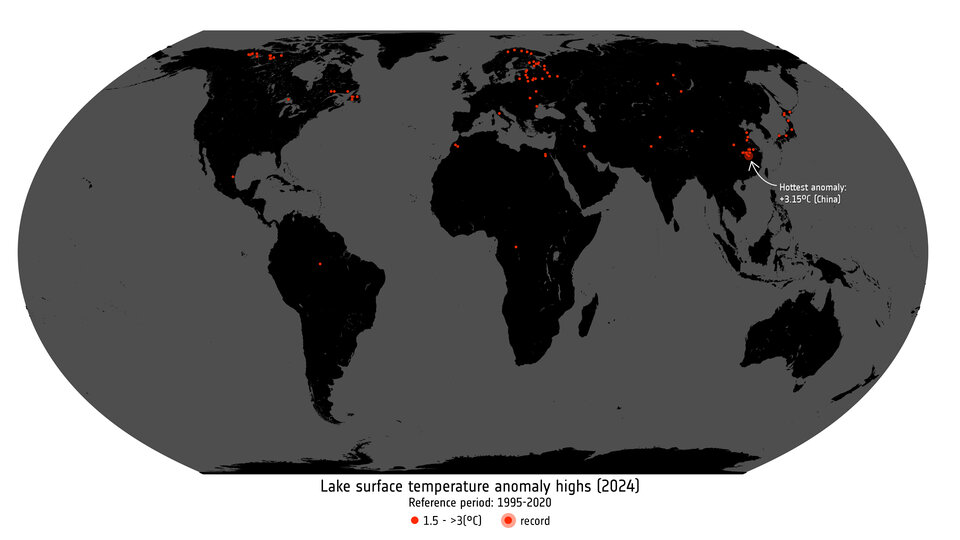
Lake-surface temperature: record highs and irregularities
Satellite measurements from the Climate Change Initiative Lakes Project revealed the highest recorded global lake surface temperature anomalies, with more than half of the observed lakes showing anomalies greater than +0.5 °C compared to the 1995–2020 baseline.
The project uses satellite observations to monitor the impact of warming on freshwater lakes worldwide, tracking water temperatures across almost 2000 lakes. This provides scientists with vital information on the effects of climate change on freshwater ecosystems and water resources.
The global maps above show lake temperature anomaly highs and lows in 2024 compared to 1995–2020. It is clear that there were a lot more high anomalies than lows.
Permafrost: rock glacier movement accelerates as permafrost thaws
Rock glacier velocities in Central Asia have shown a consistent increase since the 1950s, with a notable acceleration between 2010 and 2020, according to new data delivered by the ESA Climate Change Initiative Permafrost Project. This trend mirrors patterns seen in mountain ranges worldwide and is consistent with rising air temperatures in the region, providing further evidence that permafrost is responding rapidly to climate change.
Rock glaciers – moving ice that is covered in rocks and debris – serve as important indicators of permafrost thermal conditions, with their velocity changes reflecting shifts in ground temperature and hydrology. The project’s monitoring efforts highlight the value of rock glaciers as sensitive early warning indicators of environmental change in climatically sensitive regions.
The animation above shows the difference in the extent of Arctic permafrost in 1997 compared to 2021. Arctic permafrost stores nearly 1700 billion tonnes of frozen and thawing carbon. Anthropogenic warming threatens to release an unknown quantity of this carbon to the atmosphere, influencing the climate in processes collectively known as the permafrost–carbon feedback. Sometimes permafrost can thaw rapidly, but scientists are unsure why and what these abrupt thaws mean in terms of feedback loops.
The report also drew on results from the Climate Change Initiative Land Surface Temperature Project, which identified extreme hotspots with land temperatures above 60 °C on several continents. Using data from Copernicus Sentinel-3 at 1 km resolution, the project provides crucial measurements in remote regions where weather stations are rare. These records help scientists map areas where conditions may be nearing the limits of human habitability.
In addition, the report used records from the Climate Change Initiative Ozone Project, highlighting some good news. In 2024, stratospheric ozone levels in the northern hemisphere reached their highest since satellite monitoring began in 1979, with some regions showing concentrations not seen since the 1960s. The southern hemisphere also improved, recovering from the low ozone levels recorded between 2020 and 2022 owing to pollution from major Australian wildfires and volcanic eruptions.


Related Posts
Stay Informed With the Latest & Most Important News
Previous Post
Next Post


Advertisement
-
 01Two Black Holes Observed Circling Each Other for the First Time
 -
 02From Polymerization-Enabled Folding and Assembly to Chemical Evolution: Key Processes for Emergence of Functional Polymers in the Origin of Life
 -
 03Astronomy 101: From the Sun and Moon to Wormholes and Warp Drive, Key Theories, Discoveries, and Facts about the Universe (The Adams 101 Series)
 -
 04True Anomaly hires former York Space executive as chief operating officer
 -
 05Φsat-2 begins science phase for AI Earth images
 -
 06Hurricane forecasters are losing 3 key satellites ahead of peak storm season − a meteorologist explains why it matters
 -
 07Binary star systems are complex astronomical objects − a new AI approach could pin down their properties quickly