
Now Reading: NASA’s PACE Mission Reveals a Year of Terrestrial Data on Plant Health
-
01
NASA’s PACE Mission Reveals a Year of Terrestrial Data on Plant Health


4 min read
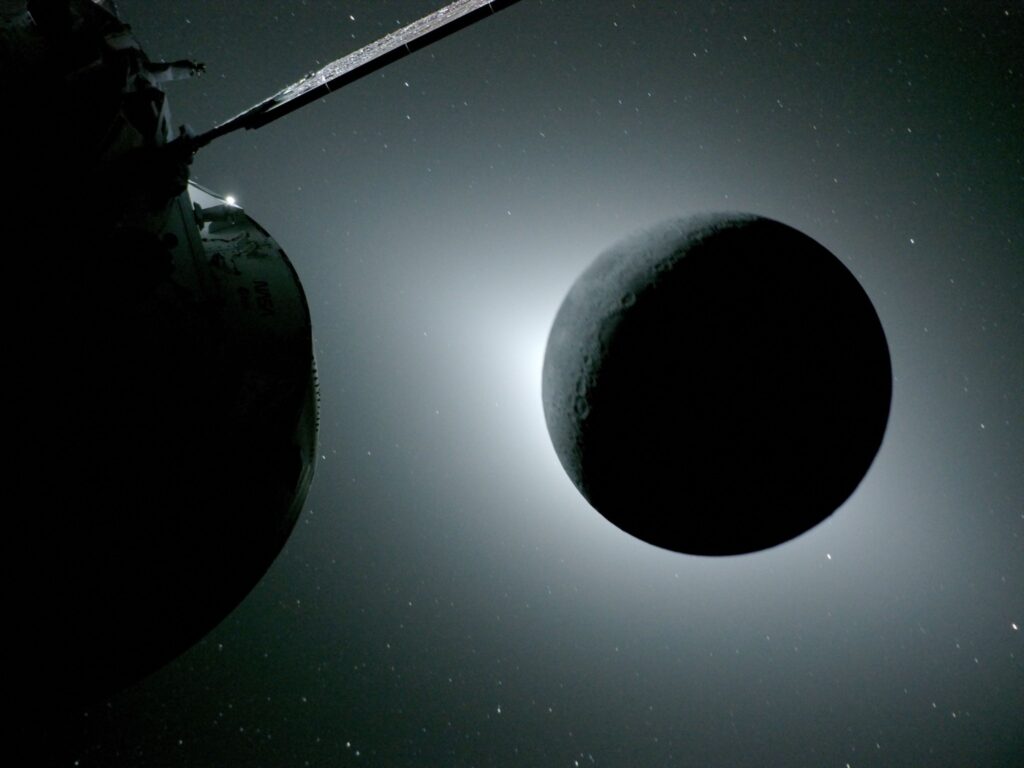
Preparations for Next Moonwalk Simulations Underway (and Underwater)
A lot can change in a year for Earth’s forests and vegetation, as springtime and rainy seasons can bring new growth, while cooling temperatures and dry weather can bring a dieback of those green colors. And now, a novel type of NASA visualization illustrates those changes in a full complement of colors as seen from space.
NASA’s Plankton, Aerosol, Cloud, ocean Ecosystem (PACE) satellite is designed to view Earth’s microscopic ocean plants in a new lens, but researchers have proved its hyperspectral use over land, as well.
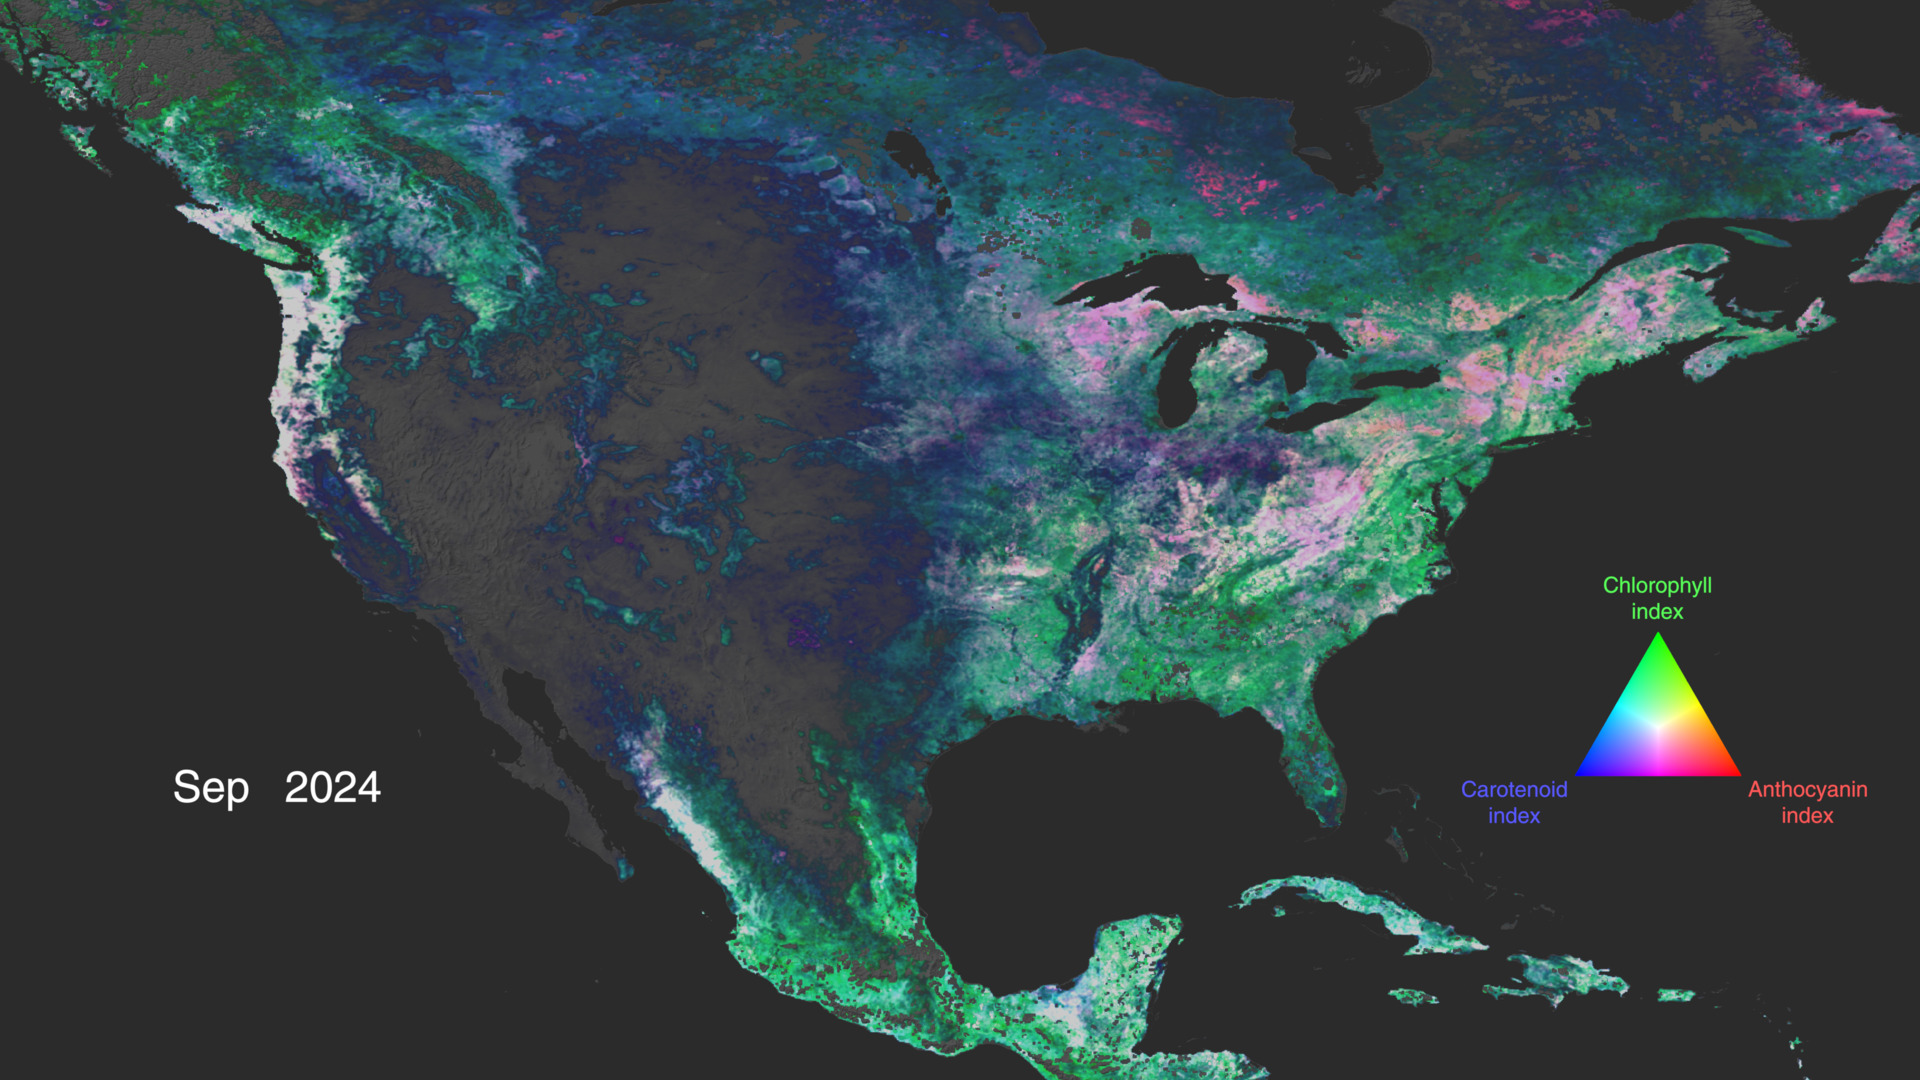
Previous missions measured broad changes in chlorophyll, the pigment that gives plants their green color and also allows them to perform photosynthesis. Now, for the first time, PACE measurements have allowed NASA scientists and visualizers to show a complete year of global vegetation data using three pigments: chlorophyll, anthocyanins, and carotenoids. That multicolor imagery tells a clearer story about the health of land vegetation by detecting the smallest of variations in leaf colors.
“Earth is amazing. It’s humbling, being able to see life pulsing in colors across the whole globe,” said Morgaine McKibben, PACE applications lead at NASA’s Goddard Space Flight Center in Greenbelt, Maryland. “It’s like the overview effect that astronauts describe when they look down at Earth, except we are looking through our technology and data.”
Anthocyanins are the red pigments in leaves, while carotenoids are the yellow pigments – both of which we see when autumn changes the colors of trees. Plants use these pigments to protect themselves from fluctuations in the weather, adapting to the environment through chemical changes in their leaves. For example, leaves can turn more yellow when they have too much sunlight but not enough of the other necessities, like water and nutrients. If they didn’t adjust their color, it would damage the mechanisms they have to perform photosynthesis.
In the visualization, the data is highlighted in bright colors: magenta represents anthocyanins, green represents chlorophyll, and cyan represents carotenoids. The brighter the colors are, the more leaves there are in that area. The movement of these colors across the land areas show the seasonal changes over time.
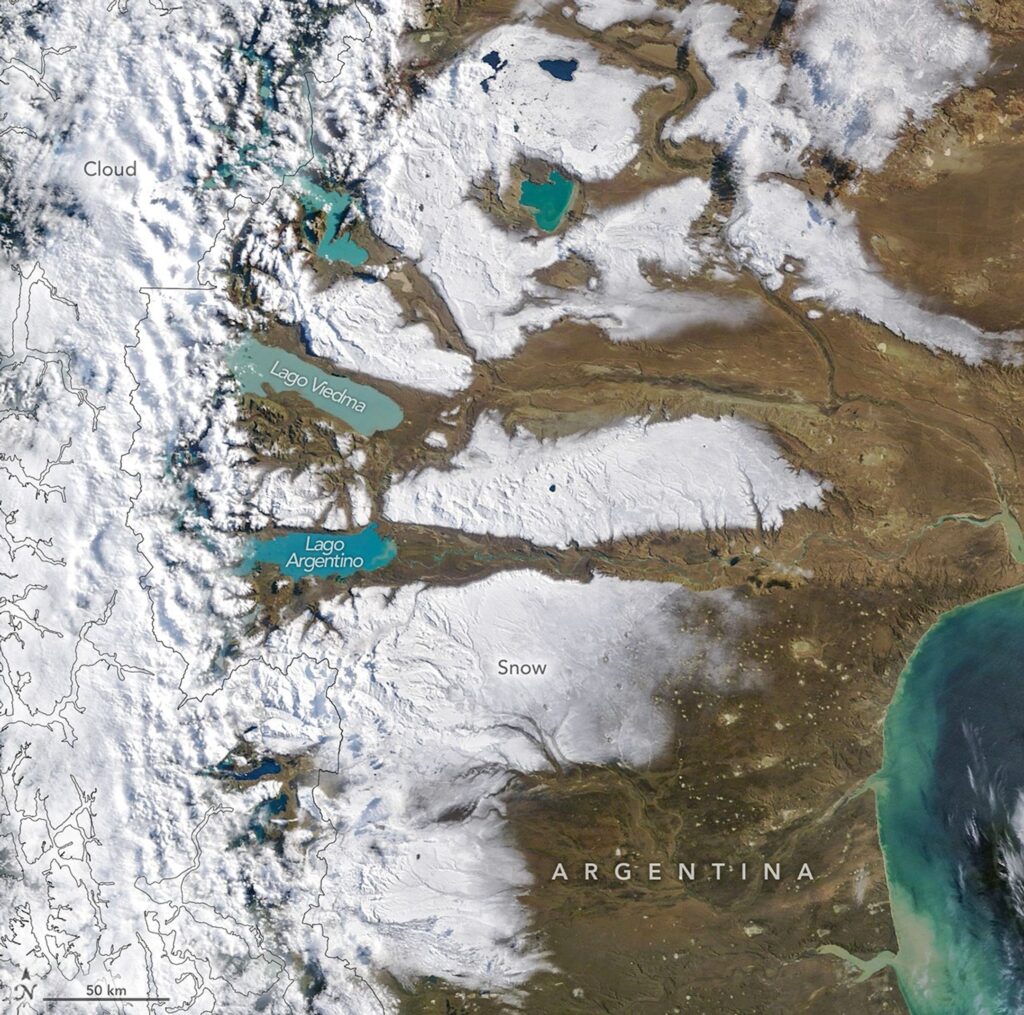
In areas like the evergreen forests of the Pacific Northwest, plants undergo less seasonal change. The data highlights this, showing comparatively steadier colors as the year progresses.
The combination of these three pigments helps scientists pinpoint even more information about plant health.
“Shifts in these pigments, as detected by PACE, give novel information that may better describe vegetation growth, or when vegetation changes from flourishing to stressed,” said McKibben. “It’s just one of many ways the mission will drive increased understanding of our home planet and enable innovative, practical solutions that serve society.”
The Ocean Color Instrument on PACE collects hyperspectral data, which means it observes the planet in 100 different wavelengths of visible and near infrared light. It is the only instrument – in space or elsewhere – that provides hyperspectral coverage around the globe every one to two days. The PACE mission builds on the legacy of earlier missions, such as Landsat, which gathers higher resolution data but observes a fraction of those wavelengths.
In a paper recently published in Remote Sensing Letters, scientists introduced the mission’s first terrestrial data products.
“This PACE data provides a new view of Earth that will improve our understanding of ecosystem dynamics and function,” said Fred Huemmrich, research professor at the University of Maryland, Baltimore County, member of the PACE science and applications team, and first author of the paper. “With the PACE data, it’s like we’re looking at a whole new world of color. It allows us to describe pigment characteristics at the leaf level that we weren’t able to do before.”
As scientists continue to work with these new data, available on the PACE website, they’ll be able to incorporate it into future science applications, which may include forest monitoring or early detection of drought effects.
NASA’s Goddard Space Flight Center, Greenbelt, Md.
Share
Details
Related Terms
Explore More


Related Posts

Stay Informed With the Latest & Most Important News


Advertisement
-
 01Two Black Holes Observed Circling Each Other for the First Time
 -
 02From Polymerization-Enabled Folding and Assembly to Chemical Evolution: Key Processes for Emergence of Functional Polymers in the Origin of Life
 -
 03Astronomy 101: From the Sun and Moon to Wormholes and Warp Drive, Key Theories, Discoveries, and Facts about the Universe (The Adams 101 Series)
 -
 04True Anomaly hires former York Space executive as chief operating officer
 -
 05Φsat-2 begins science phase for AI Earth images
 -
 06Hurricane forecasters are losing 3 key satellites ahead of peak storm season − a meteorologist explains why it matters
 -
 07Binary star systems are complex astronomical objects − a new AI approach could pin down their properties quickly