
Now Reading: Sentinel-1 captures ground shift from Myanmar earthquake
-
01
Sentinel-1 captures ground shift from Myanmar earthquake

24/04/2025
266 views
4 likes
On 28 March 2025, a powerful magnitude 7.7 earthquake struck central Myanmar, sending shockwaves through the region. While the country is still dealing with the devasting aftermath, scientists have used radar images from the Copernicus Sentinel-1 satellites to reveal a detailed picture of how the ground shifted as a result of the quake – offering new insights into the mechanics of the tectonic Sagaing Fault and the scale of the seismic rupture.
Just one day before the earthquake struck, the Sentinel-1A satellite, as part of its routine global monitoring plan, captured a radar image of Myanmar. Then a few days after the quake, Sentinel-1C revisited the site, and was tasked to acquire an additional image. Both images were combined to form an interferogram of the Sagaing Fault.
The Sentinel-1 mission comprises two satellites that orbit 180 degrees apart so that together they cover the globe every six days.
The mission provides high-resolution radar imagery of Earth, regardless of weather conditions or if it is day or night to support a wide range of Copernicus services and applications. These include Arctic sea-ice monitoring, iceberg tracking and routine sea-ice mapping, as well as the detection of ground deformation caused by subsidence, uplift, landslides, and, as in this case, earthquakes.
Sentinel-1A has been in service since 2014, but Sentinel-1C has only been in orbit since December 2024 and is still in its commissioning phase – nevertheless it is already delivering on its promise.
While the immediate priority is to support recovery efforts and mourn the lives lost in this devastating disaster, understanding how the ground shifted is also crucial. Using satellite radar images, scientists can map the extent of ruptures and identify areas of increased seismic risk.
This information is vital for improving earthquake models and for developing effective disaster response strategies, including guiding safe and informed reconstruction, helping communities rebuild with greater resilience.
Thanks to the Sentinel-1 mission, the changing shape of Earth’s land surface can be mapped with millimetre precision, but it relies on a complex data processing method called synthetic aperture radar interferometry.
This involves combining two radar images, one from just before and one from just after the quake to produce an interferogram. By using tiny differences in the radar signal phase to detect ground shifts with incredible precision, the result is a colourful fringed pattern that reveals how the land moved during the earthquake.
What’s more, the Sentinel-1 satellites’ advanced radar imaging mode, known as Terrain Observation with Progressive Scans, allows scientists to measure ground motion in both east–west and north–south directions – a unique capability. Most satellite imaging radars can only see across their flight path, but thanks to a technique called ‘burst overlap interferometry’, the Sentinel-1 mission offers a full view of the ground deformation.


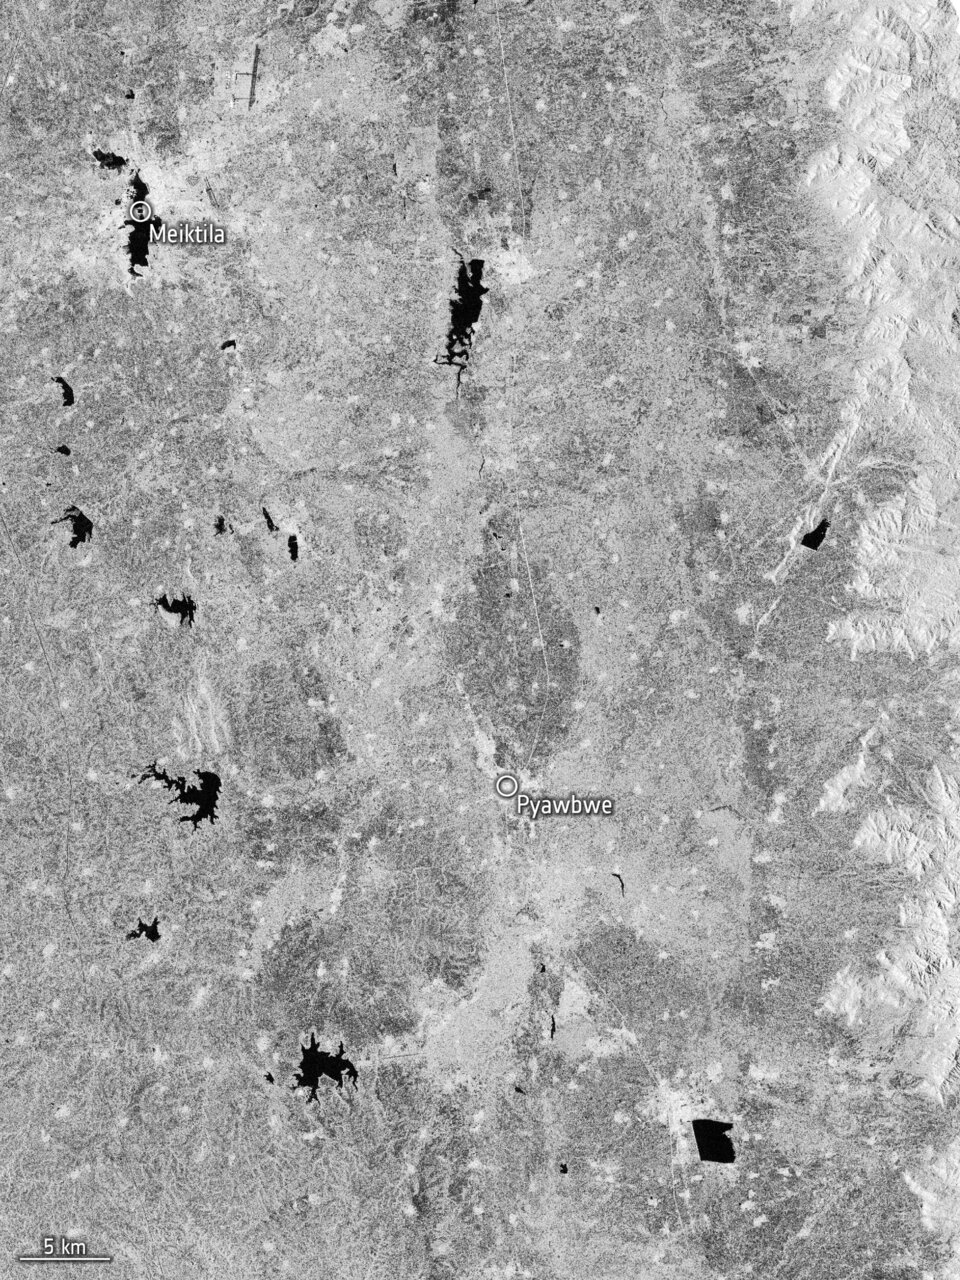
The first set of images, featured above, compares a radar image with an interferogram. The image on the left is a radar image captured by Sentinel-1C on 2 April, while the image on the right is an interferogram – a composite created by combining a Sentinel-1A image from 27 March with the Sentinel-1C image from 2 April, after the earthquake.
These images effectively zoom-in to an area around Pyawbwe, but the closer fringes indicate very clearly the notorious Sagaing Fault, which runs north–south as well as the ground shifts caused by the earthquake.
Each full cycle of colour, from cyan to yellow to red to blue and back to cyan, represents ground displacement of about 160 cm along the fault line. Across the fault line, each colour cycle represents ground displacement of about 28 mm. These impressive fringes show how different parts of the ground moved, with each side of the fault shifting in opposite directions – clear evidence of a tectonic slip.


Then, this second set of images offers a wider view of the interferogram (left), where the tight fringes on the right cut through Mandalay and extend southwards, making the extent of the rupture clearly evident.
The image on the right uses data from Sentinel-1A and Sentinel-1C to reveal a ‘coherence map’, where the fault appears as a dark fracture slicing through the land. This coherence map shows areas that have changed between the two acquisition dates as dark tones while stable areas appear bright.
“We’re thrilled with the clarity of the results,” said the team from the DLR German Aerospace Center’s Microwave & Radar Institute, who processed and analysed the data.
These high-resolution radar images are not just impressive visuals, they’re critical tools for earthquake science. By studying the fringes and phase jumps in the interferogram, geoscientists can create detailed ground deformation maps, helping to unravel how and where quakes change the surface. This information is vital for understanding seismic activity and preparing for future events.
“These data are a game-changer,” said ESA’s Sentinel-1 System Manager, Dirk Geudtner. “They enable faster, more accurate assessments after disasters, and helps us to improve earthquake models globally. This is a textbook example of how space technology helps us understand seismic hazards.”
ESA’s Sentinel-1 Project Manager, Ramón Torres, said, “These results demonstrate that the new Sentinel-1C satellite is working perfectly and its data can be used with confidence alongside its older Sentinel-1A sibling.”


Related Posts

Stay Informed With the Latest & Most Important News
Previous Post
Next Post


Advertisement
-
 01Two Black Holes Observed Circling Each Other for the First Time
 -
 02From Polymerization-Enabled Folding and Assembly to Chemical Evolution: Key Processes for Emergence of Functional Polymers in the Origin of Life
 -
 03Astronomy 101: From the Sun and Moon to Wormholes and Warp Drive, Key Theories, Discoveries, and Facts about the Universe (The Adams 101 Series)
 -
 04True Anomaly hires former York Space executive as chief operating officer
 -
 05Φsat-2 begins science phase for AI Earth images
 -
 06Hurricane forecasters are losing 3 key satellites ahead of peak storm season − a meteorologist explains why it matters
 -
 07Binary star systems are complex astronomical objects − a new AI approach could pin down their properties quickly