
Now Reading: Solar Carbon Abundance From 3D Non-LTE Modelling Of The Diagnostic Lines Of The CH Molecule
-
01
Solar Carbon Abundance From 3D Non-LTE Modelling Of The Diagnostic Lines Of The CH Molecule

Solar Carbon Abundance From 3D Non-LTE Modelling Of The Diagnostic Lines Of The CH Molecule

Context. The spectral lines of the CH molecule are a key carbon (C) abundance diagnostic in FGKM-type stars. These lines are detectable in metal-rich and, in contrast to atomic C lines, also in metal-poor late-type stars. However, only 3D LTE analyses of the CH lines have been performed so far.
Aims. We test the formation of CH lines in the solar spectrum, using for the first time, 3D Non-LTE (NLTE) models. We also aim to derive the solar photospheric abundance of C, using the diagnostic transitions in the optical (4218 – 4356 Å) and infrared (33025 – 37944 Å).
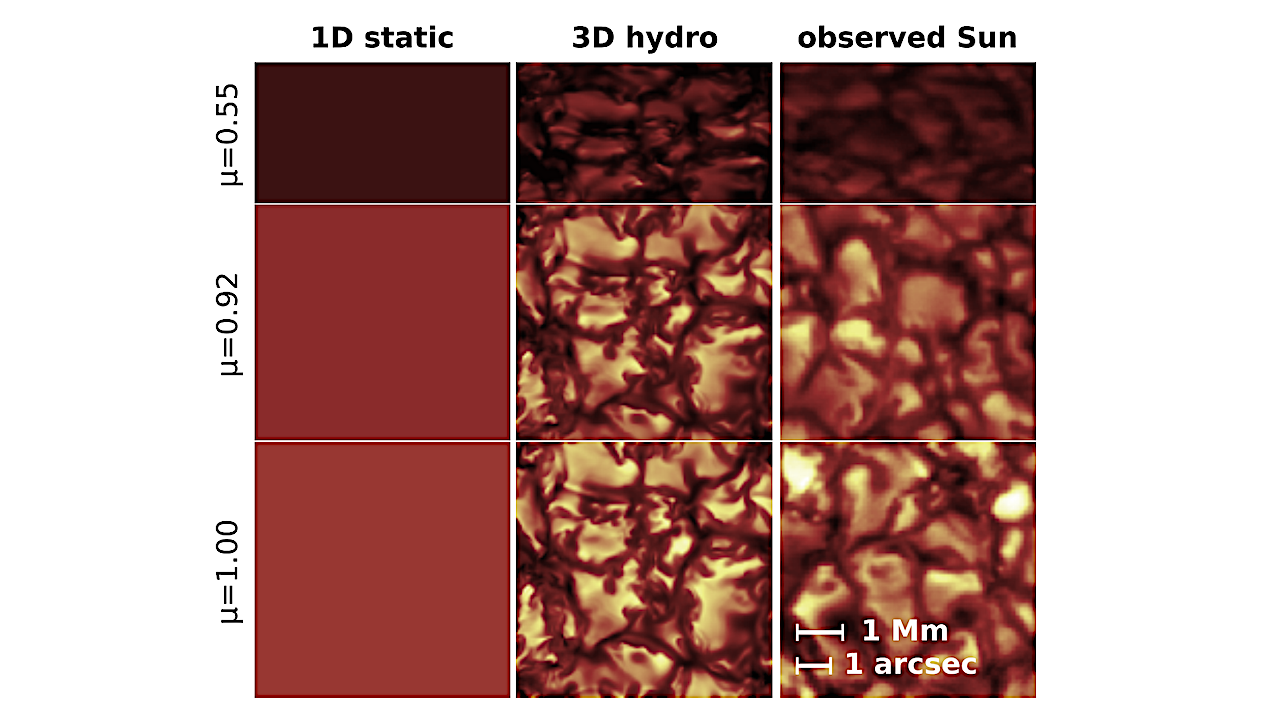
Methods. We use the updated NLTE model molecule from Popa et al. (2023) and different solar 3D radiation-hydrodynamics model atmospheres. The models are contrasted against new spatially-resolved optical solar spectra, and the center-to-limb variation (CLV) of CH lines is studied.
Results. The 1D LTE and 1D NLTE models fail to describe the line CLV, and lead to underestimated solar C abundances. The 3D NLTE modelling of diagnostic lines in the optical and IR yields a carbon abundance of A(C)=8.52±0.07 dex. The estimate is in agreement with recent results based on neutrino fluxes measured by Borexino.
Conclusions. 3D NLTE modelling and tests on spatially-resolved solar data are essential to derive robust solar abundances. The analysis presented here focuses on CH, but we expect that similar effects will be present for other molecules of astrophysical interest.
Richard Hoppe, Maria Bergemann, Philipp Eitner, Momo Ellwarth, Åke Nordlund, Jorrit Leenaarts, Bertrand Plez, Aldo Serenelli
Comments: Accepted by MNRAS, 22 pages
Subjects: Solar and Stellar Astrophysics (astro-ph.SR)
Cite as: arXiv:2511.14289 [astro-ph.SR] (or arXiv:2511.14289v1 [astro-ph.SR] for this version)
https://doi.org/10.48550/arXiv.2511.14289
Focus to learn more
Submission history
From: Richard Hoppe
[v1] Tue, 18 Nov 2025 09:34:51 UTC (1,897 KB)
https://arxiv.org/abs/2511.14289
Astrobiology, heliophysics, exoplanet,


Related Posts
Stay Informed With the Latest & Most Important News
Previous Post
Next Post


Advertisement
-
 01Two Black Holes Observed Circling Each Other for the First Time
 -
 02From Polymerization-Enabled Folding and Assembly to Chemical Evolution: Key Processes for Emergence of Functional Polymers in the Origin of Life
 -
 03Astronomy 101: From the Sun and Moon to Wormholes and Warp Drive, Key Theories, Discoveries, and Facts about the Universe (The Adams 101 Series)
 -
 04True Anomaly hires former York Space executive as chief operating officer
 -
 05Φsat-2 begins science phase for AI Earth images
 -
 06Hurricane forecasters are losing 3 key satellites ahead of peak storm season − a meteorologist explains why it matters
 -
 07Binary star systems are complex astronomical objects − a new AI approach could pin down their properties quickly