
Now Reading: Terrestrial Technosignatures: Satellites Capture The Glowing Pulse Of Human Civilization
-
01
Terrestrial Technosignatures: Satellites Capture The Glowing Pulse Of Human Civilization

Terrestrial Technosignatures: Satellites Capture The Glowing Pulse Of Human Civilization
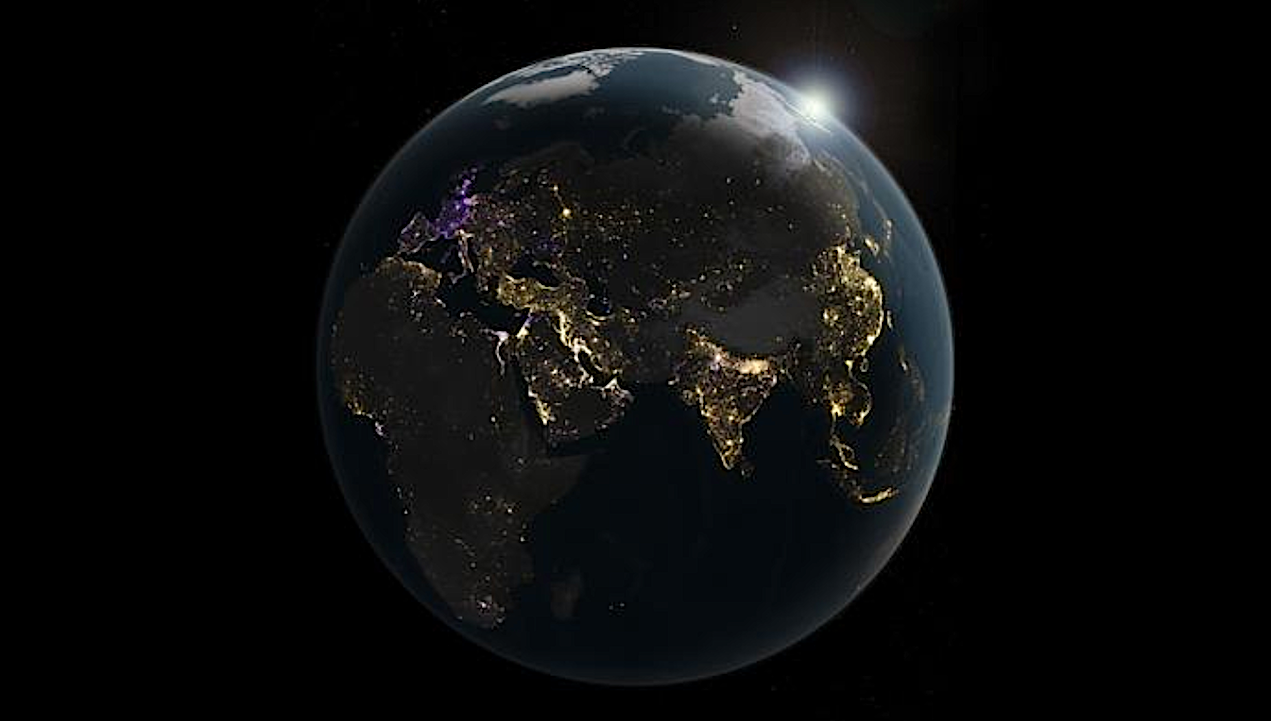

The final accumulated nighttime light change area: A night-time view of Earth, capturing human activity across the eastern hemisphere of the planet through the emissions of artificial light. Derived from satellite images taken daily over the past decade, the image maps the dynamics of the human night-time activity, with golden areas experiencing brightening, purple areas featuring dimming, and white areas experiencing both. Credit © Michala Garrison/NASA Earth Observatory
An analysis of data from the VIIRS DNB satellite instrument covering the years 2014 to 2022 finds that nighttime lighting is increasing globally by about two percent per year. “Although there has been a total increase of 16 percent worldwide, that does not mean that lighting is increasing everywhere,” explained Christopher Kyba.
“In areas where lighting increased, we found global emissions rose by 34 percent. This was offset by an 18 percent decrease in emissions from other areas.” These local changes in lighting were much more dynamic than previously assumed. While China and India became increasingly brighter due to urbanization during the analysis period, measured emissions from other industrialized nations tended to decrease, for example because they switched to LED lighting or introduced regulations to curb light pollution.
A dramatic decline in lighting was observed in Ukraine following the Russian invasion. France also dimmed significantly at night (down 33 percent), as many municipalities there turn off streetlights after midnight to save energy and reduce light pollution. “In Germany, light emissions remained almost constant overall despite local variations,” Kyba reports.
“While light emissions rose by 8.9 percent in brightening German regions, they fell by 9.2 percent in dimming areas.” Overall, nighttime light emissions observed by the satellite in Europe declined by four percent—though this small decrease may not reflect the human experience, as there are differences between the sensitivity of this satellite instrument compared to human vision.
First global analysis at full resolution
These findings were made possible by analyzing data from each individual night. Previous observations were based on monthly or annual composites, which due to instrumental factors made it more difficult to detect and measure changes. “Until now, no global analysis had been conducted using the full-resolution nighttime data,” Kyba emphasizes.
The researchers also made use of an algorithm that incorporates information about the satellite’s viewing angle into account. For example, residential areas usually appear brighter when viewed from an angle than when viewed from directly above, but the opposite is usually the case in city centers. The new analysis accounts for such differences for the first time.
The Satellite
The data analyzed in the study were obtained from the Visible Infrared Imaging Radiometer Suite (VIIRS) Day/Night Band (DNB) instrument aboard the Suomi NPP, NOAA-20, and NOAA-21 satellites operated by the U.S. agencies NOAA and NASA. The satellites observe after midnight, typically between 1:00 a.m. and 4:00 a.m. local time. They image the entire planet nightly between 70° North and 60° South. A single satellite pixel covers an area of approximately 0.5 square kilometers. In this analysis, only areas with artificial light were examined; forest fires and auroras are detected by the satellite but were excluded from the analysis.
A new satellite for Europe
“Artificial light is a major consumer of electricity at night, and light pollution harms ecosystems,” says Christopher Kyba. “It is therefore important to understand how both of these are changing.” Kyba is leading a team that is proposing a state-of-the-art satellite for observing night lights to be selected for the European Space Agency’s (ESA) “Earth Explorer 13” mission.
This new satellite would be able to see much fainter lights than existing satellites and, thanks to its high resolution, would greatly reduce the current uncertainty about exactly what is changing. “While the U.S. and China each have multiple satellites that observe nighttime light, there is currently no European satellite designed for this purpose,” says Kyba.

a, The accumulated ALAN change time map for abrupt changes. The colours show the year of the most recently detected abrupt changes. b, The accumulated change time map for gradual changes. The colours show the year of the most recently detected gradual changes. c–j, Magnified examples showing the accumulated most recent abrupt and gradual ALAN change time and the cumulative radiance change caused by different driver types over the 9 years (locations indicated by arrows in a). Urbanization processes in Guangzhou, China (c); armed conflicts in Kyiv, Ukraine (d); development of dragon fruit agriculture in Vietnam (e); environmental policies in Paris, France (f); gas flare changes in the Middle East region (g); power outages caused by hurricanes in Puerto Rico (h); urban expansion and decentralization in Charlotte, USA (i); and dimming caused by economic collapse in Valencia and Caracas, Venezuela (j). The maps in a and b are shown in 0.05° × 0.05° grid cells, with mean aggregation for visualization, whereas the maps in c–j are in the original 15-arc-second resolution. The global ALAN change product can be accessed by GitHub (https://github.com/GERSL/VZA-COLD). Basemaps in all panels are adapted from the World Continents Layer from Esri.
Satellite imagery reveals increasing volatility in human night-time activity, Nature (open access)
Astrobiology, Astronomy, SETI,


Related Posts
Stay Informed With the Latest & Most Important News


Advertisement
-
 01Two Black Holes Observed Circling Each Other for the First Time
 -
 02From Polymerization-Enabled Folding and Assembly to Chemical Evolution: Key Processes for Emergence of Functional Polymers in the Origin of Life
 -
 03Astronomy 101: From the Sun and Moon to Wormholes and Warp Drive, Key Theories, Discoveries, and Facts about the Universe (The Adams 101 Series)
 -
 04True Anomaly hires former York Space executive as chief operating officer
 -
 05Φsat-2 begins science phase for AI Earth images
 -
 06Hurricane forecasters are losing 3 key satellites ahead of peak storm season − a meteorologist explains why it matters
 -
 07Binary star systems are complex astronomical objects − a new AI approach could pin down their properties quickly