
Now Reading: The Influence Of Hypothetical Exomoons On Planetary Thermal Phase Curves
-
01
The Influence Of Hypothetical Exomoons On Planetary Thermal Phase Curves


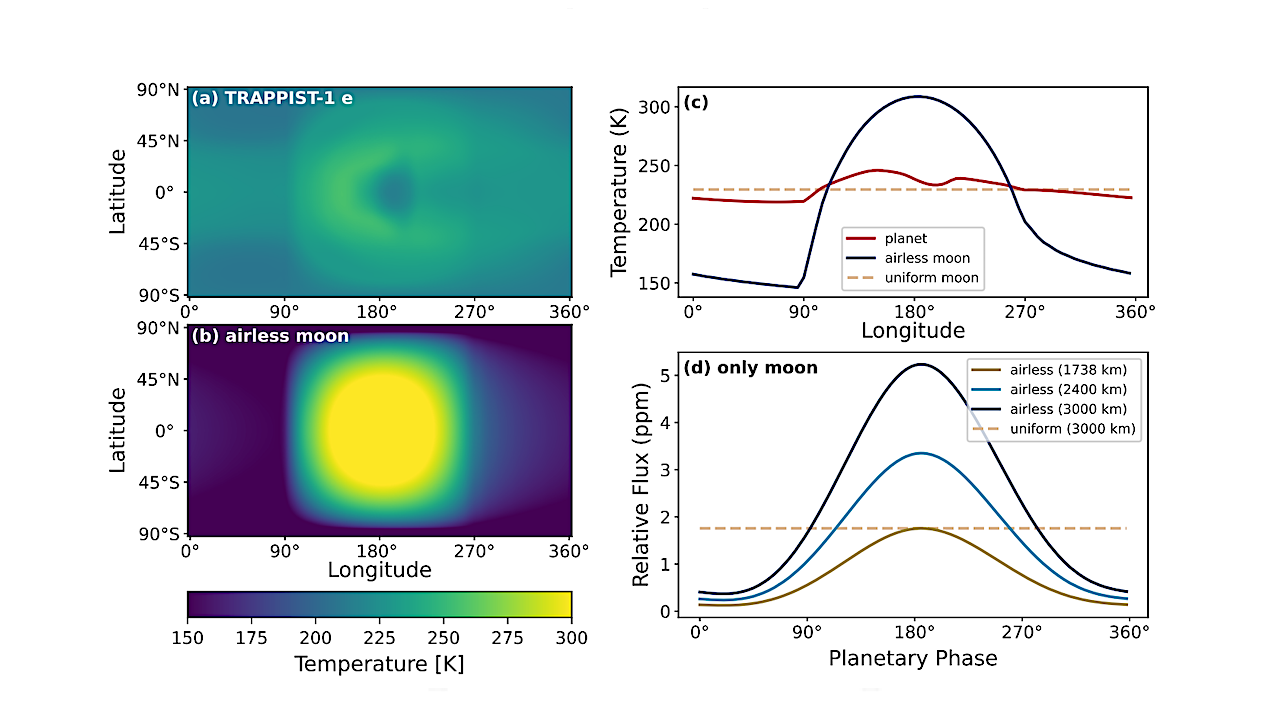
Temperature distributions and thermal phase curves of the TRAPPIST-1 e system. Panel (a): Snapshot of the effective emission temperature of TRAPPIST-1 e. Panel (b): Snapshot of the surface temperature distribution of a hypothetical tidally locked airless exomoon. Panel (c): Meridional mean effective emission temperatures of: TRAPPIST-1 e (red line), a tidally locked airless exomoon (blue line), and an exomoon with uniform temperature (dashed line). Panel (d): Exomoon thermal phase curves, i.e. the ratio of the lunar infrared emission to the stellar infrared emission. The green, cyan, and dark blue lines represent tidally locked airless exomoons with radii of 1738 km, 2400 km, and 3000 km, respectively. The dashed line shows the thermal phase curve of an exomoon with uniform temperature and a radius of 3000 km. The exomoons orbit at 33300 km around TRAPPIST-1 e, and the orbital period is 0.876 Earth days. The thermal phase curves are integrated over wavelengths from 5 to 50 µm. — astro-ph.EP
More than 200 moons exist in our Solar System, yet no exomoon has been confirmed to date. While the innermost two planets of the Solar System lack natural satellites and most studies favour the existence of exomoons around long-period planets, some theoretical studies that take tidal dissipation, orbital decay, and migration processes into account suggest that exomoons may survive around short-period exoplanets.
We investigated the impact of exomoons on planetary thermal phase curves and assessed their detectability within a theoretical framework. We simulated the thermal phase curves of exomoon-exoplanet systems, including mutual transits and occultations, and explored their dependence on planetary orbital periods across a wide range of systems.
Close-in airless exomoons maintain large day-night temperature contrasts, amplifying the thermal phase-curve signal of the system. When the exomoon transits or is occulted by the exoplanet, the transit depth varies with the planetary phase, and the occultation depth varies with the exomoon’s phase.
The maximum occultation depth can reach ∼ 20 ppm for long-period systems. For short-period planets, the signal can reach up to ∼100 ppm, although such configurations may not be dynamically stable over long timescales. If exomoons are not accounted for, the planetary temperature distribution retrieved from observed thermal phase curves may overestimate the planetary day-night temperature contrast and underestimate the planetary horizontal heat transport.
In principle, the periodic exomoon-exoplanet mutual occultation signal could be extracted using methods such as box-fitting least squares, providing a framework for future observational studies and instrument planning.

Thermal phase curves and eclipses for the TRAPPIST-1 e system. Panel (a): Total thermal phase curve of the planet and a 3000 km tidally locked airless exomoon (blue line). Panel (b): Total thermal phase curve of the planet and a 3000 km exomoon with uniform temperature (dashed line). The exomoons orbit at 33300 km around TRAPPIST-1 e. The red lines in panels (a) and (b) show the planetary phase curve alone, i.e. the ratio of the planetary infrared emission to the stellar infrared emission. Panel (c): Occultation scenarios, with the exomoon blocked by the planet. The red indicators on the exomoon markers show the 180◦ longitude. Panel (d): Transit scenarios, with the exoplanet blocked by the exomoon. The observation direction in panels (c) and (d) is from bottom to top, as indicated by the black arrows at the bottom. — astro-ph.EP
Xinyi Song, Jun Yang, Yueyun Ouyang
Subjects: Earth and Planetary Astrophysics (astro-ph.EP)
Cite as: arXiv:2603.18437 [astro-ph.EP] (or arXiv:2603.18437v1 [astro-ph.EP] for this version)
https://doi.org/10.48550/arXiv.2603.18437
Focus to learn more
Submission history
From: Xinyi Song
[v1] Thu, 19 Mar 2026 02:52:07 UTC (1,230 KB)
https://arxiv.org/abs/2603.18437
Astrobiology,


Related Posts
Stay Informed With the Latest & Most Important News
Advertisement
-
 01Two Black Holes Observed Circling Each Other for the First Time
 -
 02From Polymerization-Enabled Folding and Assembly to Chemical Evolution: Key Processes for Emergence of Functional Polymers in the Origin of Life
 -
 03Astronomy 101: From the Sun and Moon to Wormholes and Warp Drive, Key Theories, Discoveries, and Facts about the Universe (The Adams 101 Series)
 -
 04True Anomaly hires former York Space executive as chief operating officer
 -
 05Φsat-2 begins science phase for AI Earth images
 -
 06Hurricane forecasters are losing 3 key satellites ahead of peak storm season − a meteorologist explains why it matters
 -
 07Binary star systems are complex astronomical objects − a new AI approach could pin down their properties quickly