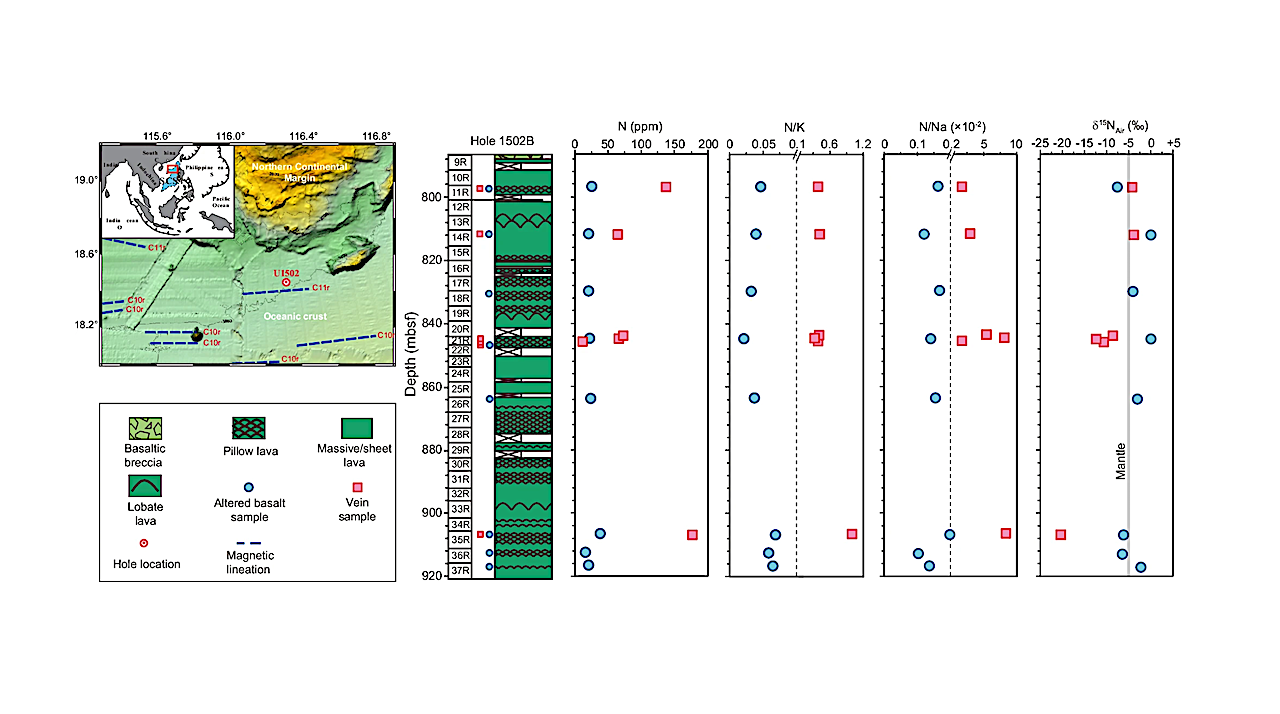
In the location map, dashed lines represent the magnetic anomaly lineations. Note the scale change in the N/K and N/Na ratios marked by the dashed lines. — Nature University of

In the location map, dashed lines represent the magnetic anomaly lineations. Note the scale change in the N/K and N/Na ratios marked by the dashed lines. — Nature University of
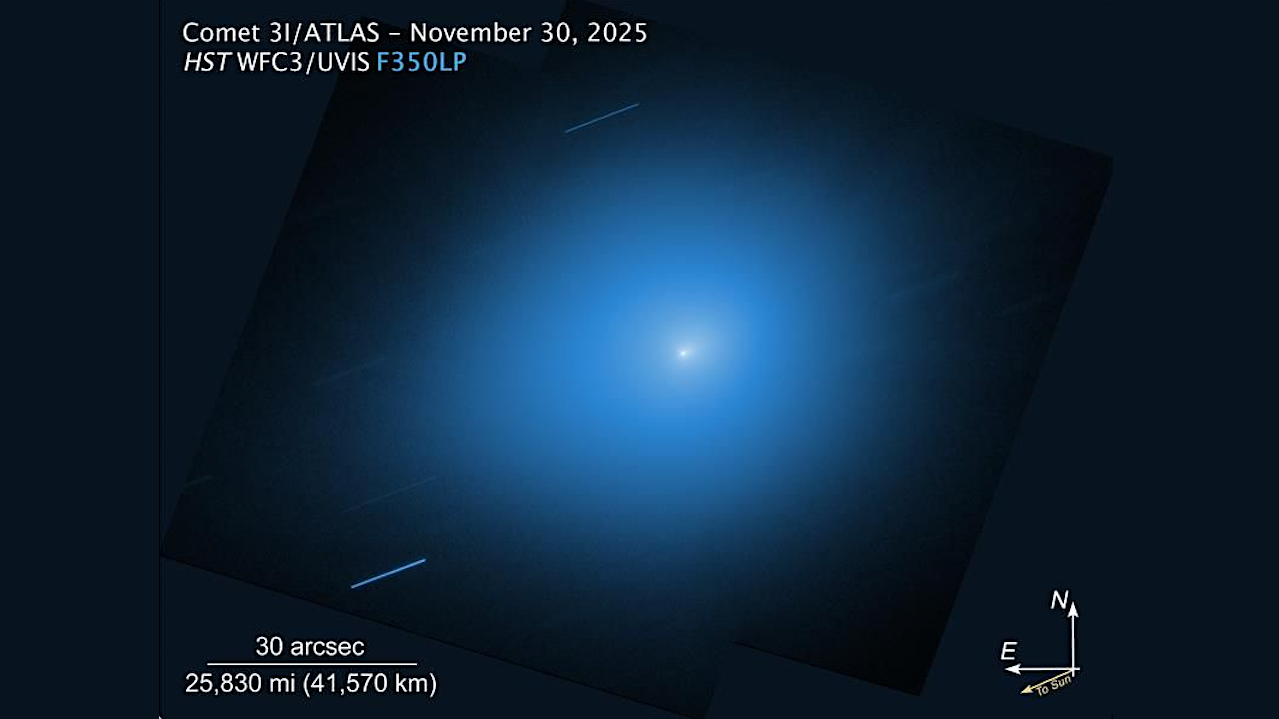
NASA, ESA, STScI, D. Jewitt (UCLA), M.-T. Hui (Shanghai Astronomical Observatory). Image Processing: J. DePasquale (STScI) NASA’s Hubble Space Telescope reobserved interstellar comet 3I/ATLAS Nov. 30, with its Wide Field

LIFE RCN Workshop Join us for the 2025 NASA LIFE RCN Seminar SeriesTime: Tuesday December 9th, 4 PM PT/7PM ET (Wednesday, December 10th 9 AM JST)This month’s speakers are Prof.

Keith Cowing Explorers Club Fellow, ex-NASA Space Station Payload manager/space biologist, Away Teams, Journalist, Lapsed climber, Synaesthete, Na’Vi-Jedi-Freman-Buddhist-mix, ASL, Devon Island and Everest Base Camp veteran, (he/him) 🖖🏻 Follow on

The abstract in PubMed or at the publisher’s site is linked when available and will open in a new window. Carter KJ, Ferguson CR, O’Grady CS, Poczatek MJ, Chen X,
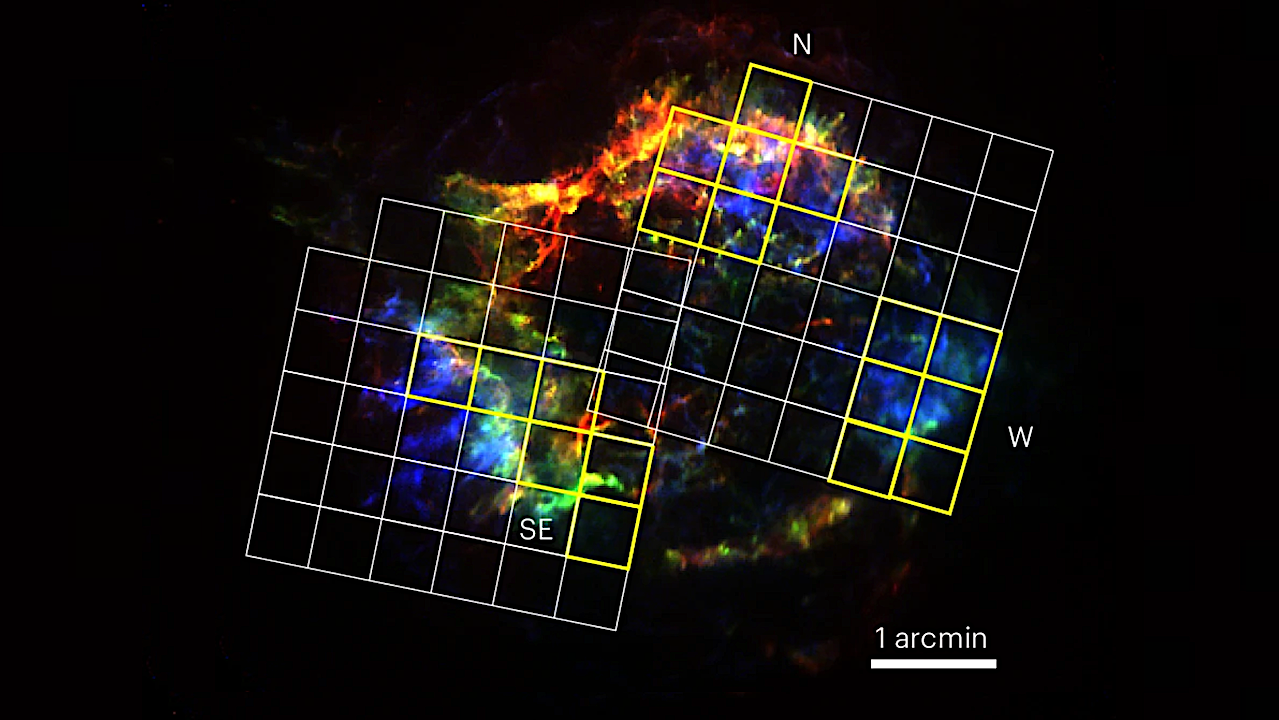
Red, green and blue represent Chandra X-ray images of O- (0.6–0.85 keV), Si- (1.76–1.94 keV) and Fe-enhanced (6.54–6.92 keV) regions, respectively. The white grids indicate the fields of view of our two-pointing

Comet 3I/ATLAS As Seen By ESA Juice Navigation Camera Larger images — ESA During November 2025, ESA’s Jupiter Icy Moons Explorer (Juice) used five of its science instruments to observe
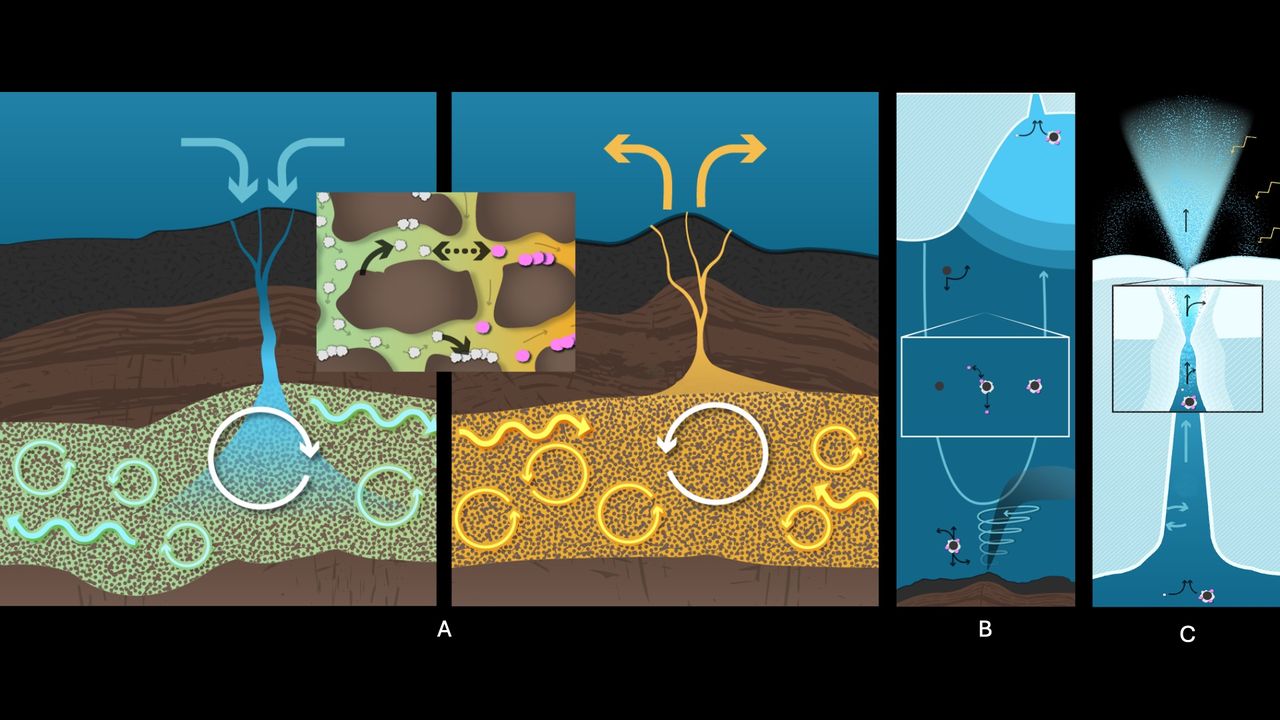
The Investigating Ocean Worlds (InvOW) project will measure organic compounds across three domains: the subseafloor (A), the ocean (B), and the cryosphere (C), with a goal of helping NASA apply

Extraterrestrial Materials Academy (ETMA) – LIP/USRA The Extraterrestrial Materials Academy (ETMA) is scheduled for June 8–August 15, 2026, at the Lunar and Planetary Institute (LPI) in Houston, Texas, in partnership
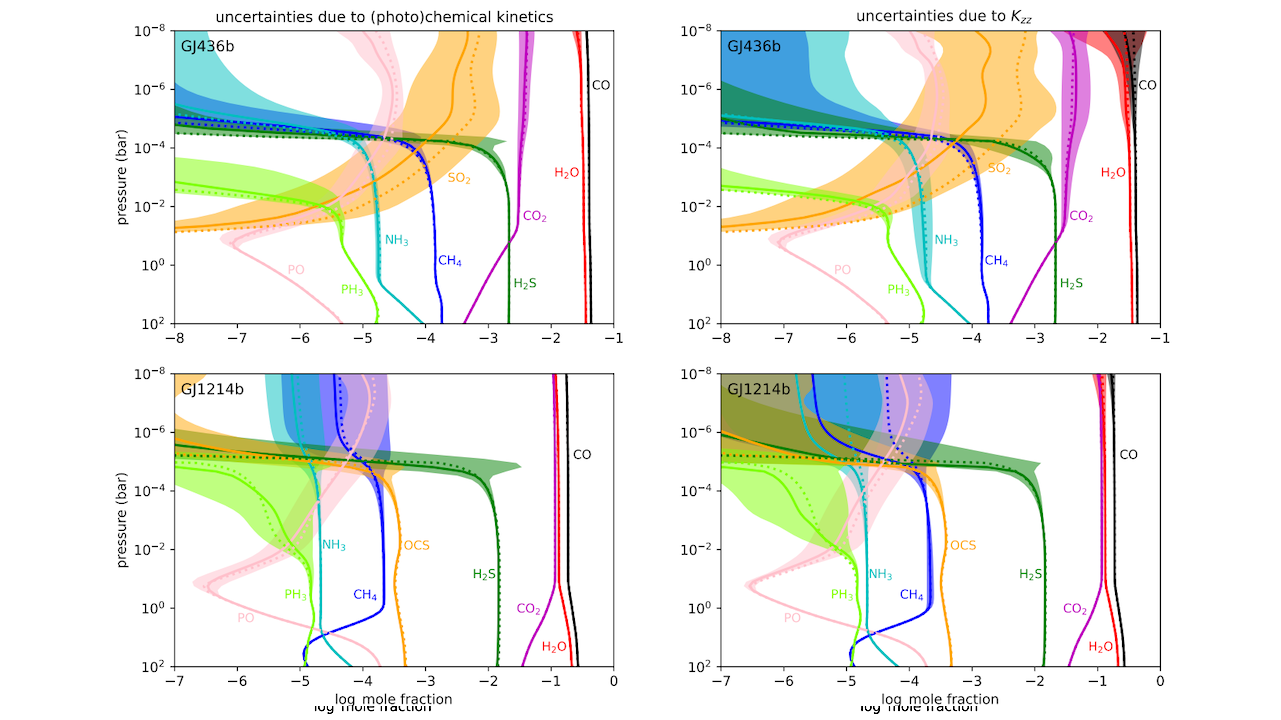
Calculated vertical distribution of abundances for the warm Neptunes GJ 436b and GJ 1214b. The solid lines correspond to the mean abundance, the shaded areas to the range around the