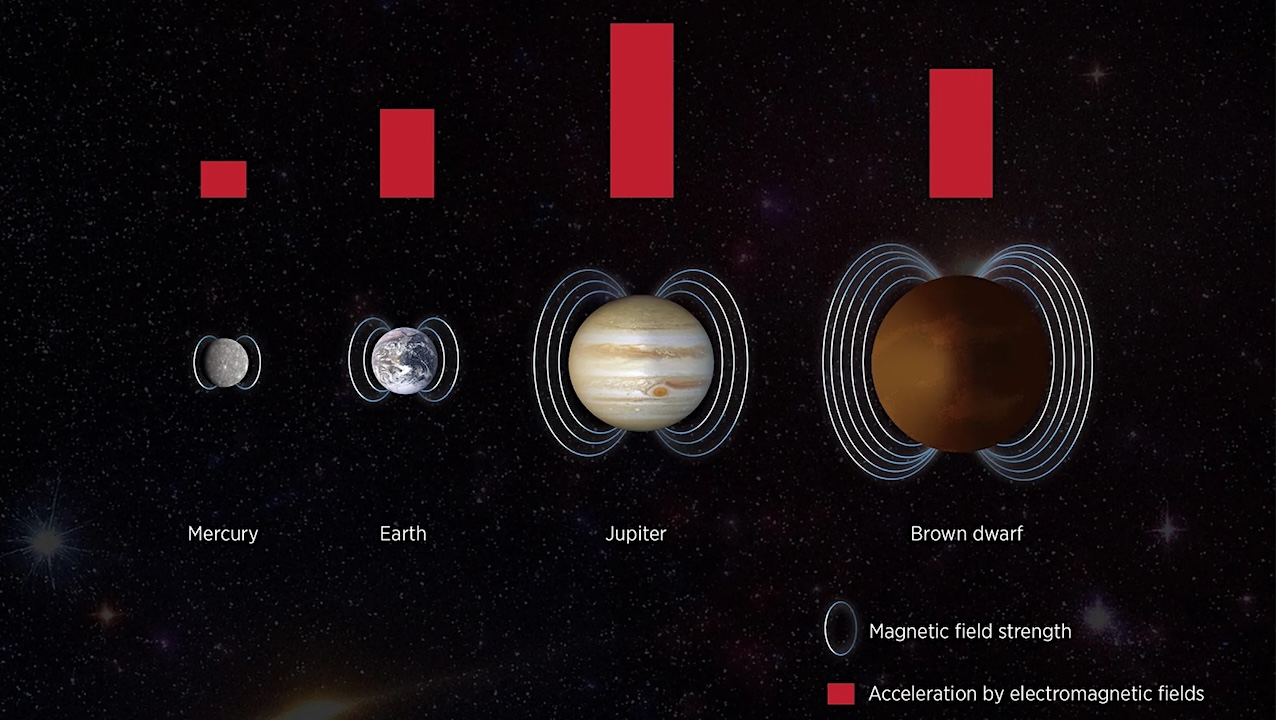
Different celestial objects and acceleration Credit Jani Närhi We all know that stars radiate light and much more. But radiation belts can also surround many other celestial bodies, such as

Different celestial objects and acceleration Credit Jani Närhi We all know that stars radiate light and much more. But radiation belts can also surround many other celestial bodies, such as

Earth Observatory Science Earth Observatory A Most Unusual Lake Earth Earth Observatory Image of the Day EO Explorer Topics All Topics Atmosphere Land Heat & Radiation Life on Earth Human
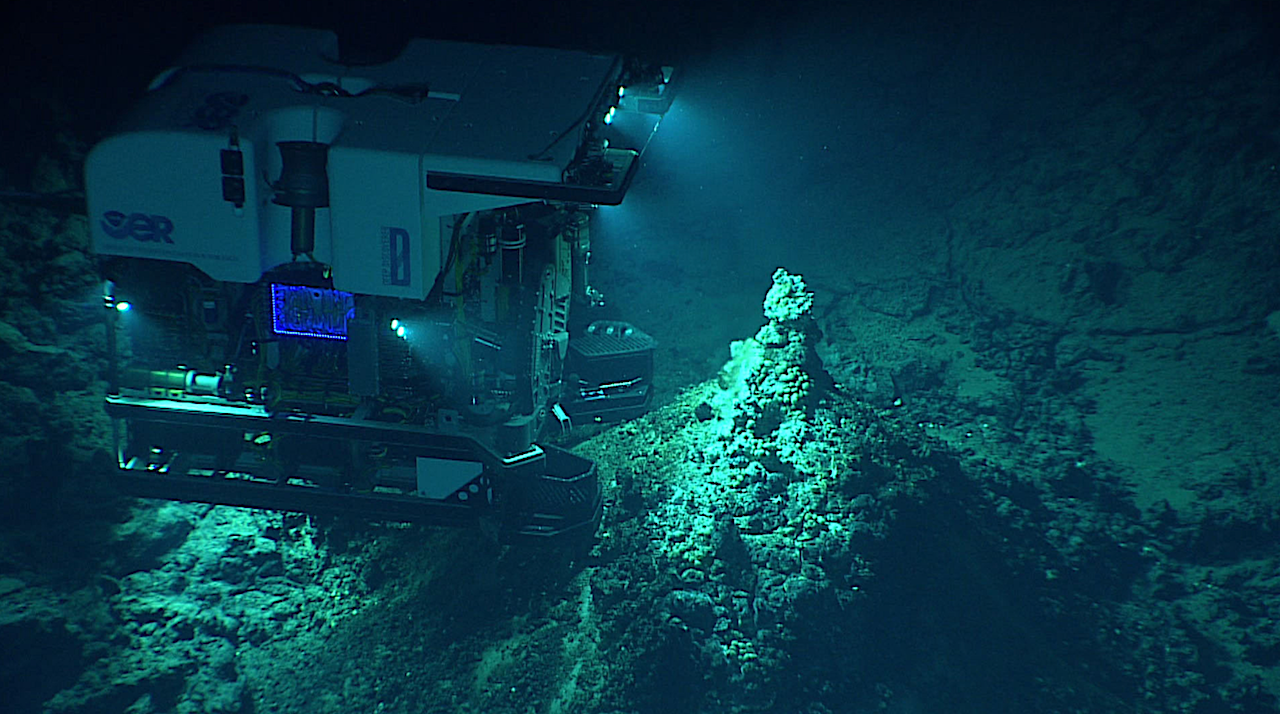
A deep-ocean submersible uses its lights to illuminate a hydrothermal vent field at Chammoro Seamount, within the Mariana Trench, June 24, 2016. Source NOAA Office of Ocean Exploration and Research/NOAA

iss073e0516005 (Aug. 23, 2025) — The Milky Way appears above Earth’s bright atmospheric glow in this photograph from the International Space Station as it soared 261 miles above southern Iran
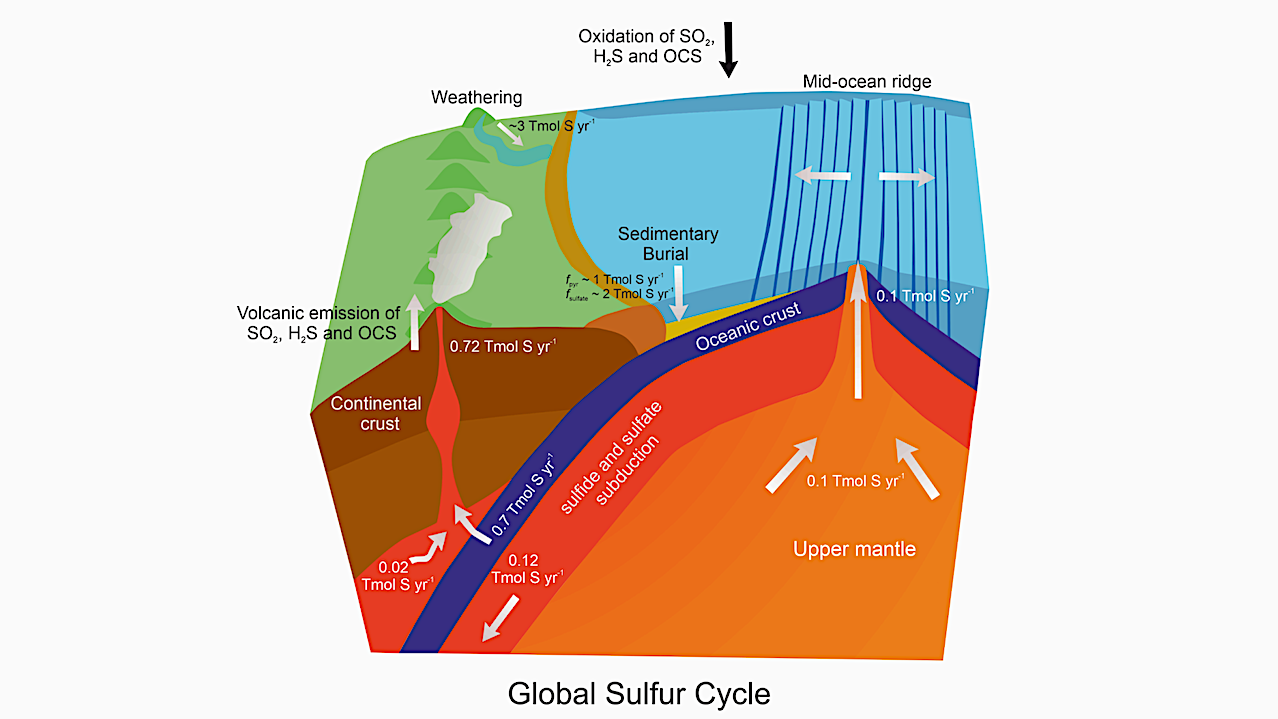
Schematic diagram of global sulfur cycle with major fluxes of sulfur between the deep Earth and surface Earth (in 10 12 moles of sulfur per year, denoted as Tmol S
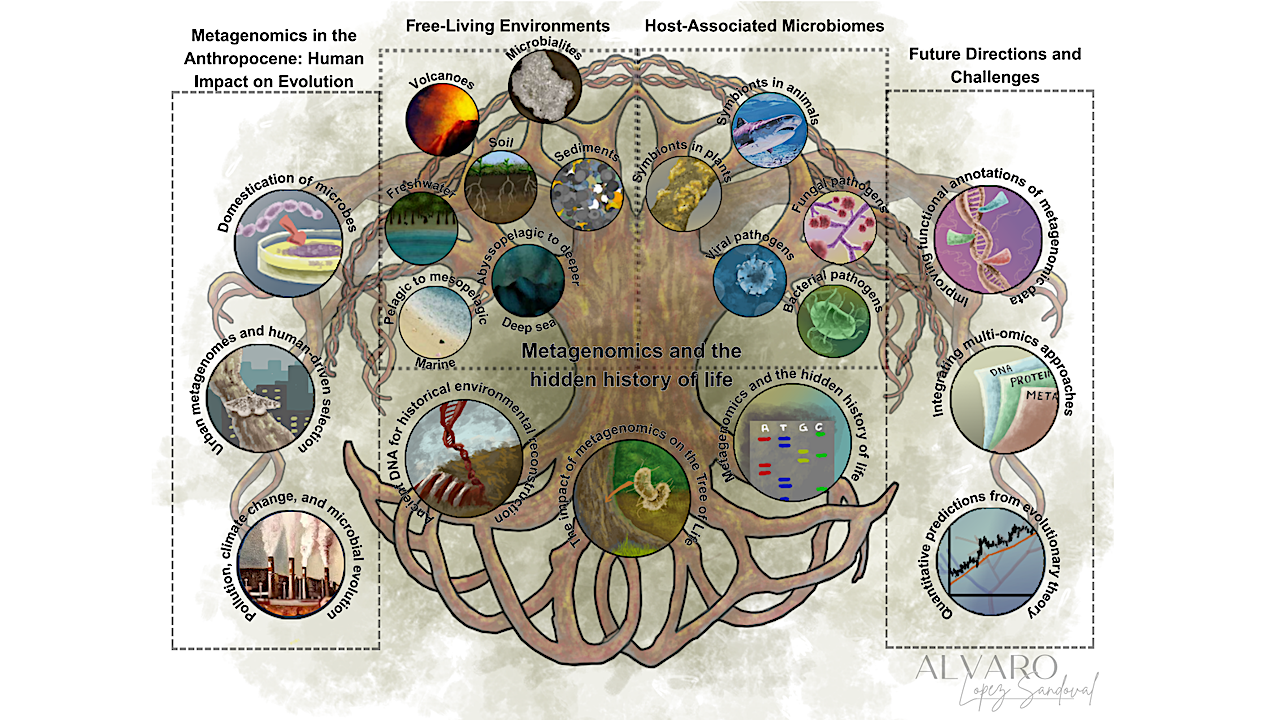
Metagenomics and the hidden history of life. Metagenomic approaches uncover microbial diversity and evolutionary processes across diverse environments. The figure is organized into four thematic sections. Center left: Free-living environments,
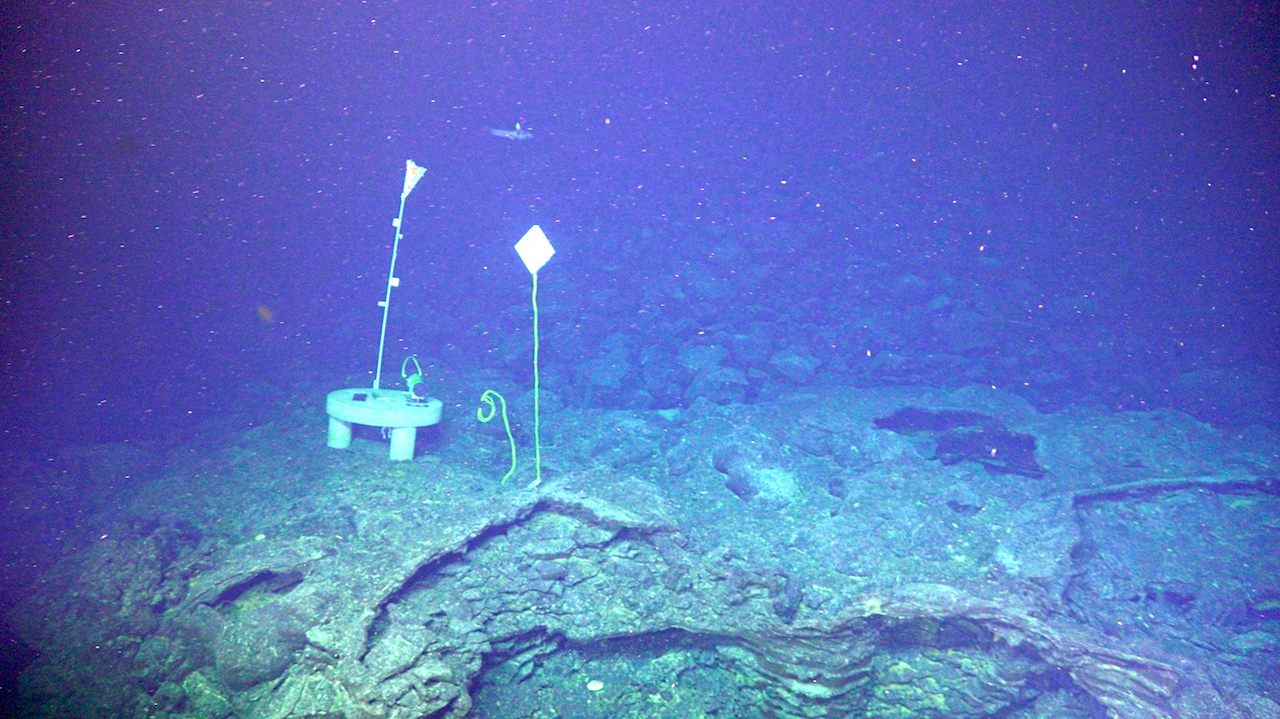
New benchmark AX-403 was deployed at the base of the western caldera wall of the Axial Seamount volcano. This photo was taken during the ROV Jason dive J2-1432 of the
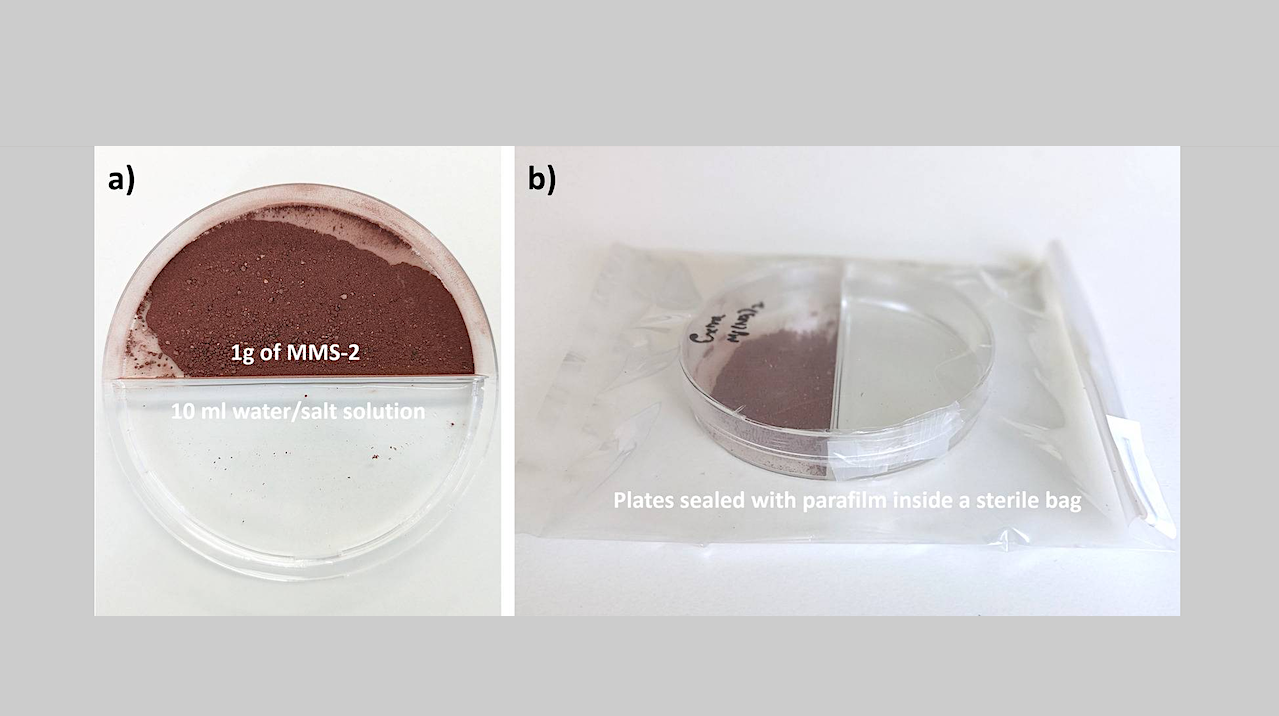
Experimental set-up of the MMS-2 incubation. (a) One side of a two compartment Petri dish was filled with 1 g of heat-treated MMS-2; the other side contained 10 mL of Milli-Q
Keith Cowing Explorers Club Fellow, ex-NASA Space Station Payload manager/space biologist, Away Teams, Journalist, Lapsed climber, Synaesthete, Na’Vi-Jedi-Freman-Buddhist-mix, ASL, Devon Island and Everest Base Camp veteran, (he/him) 🖖🏻 Follow on
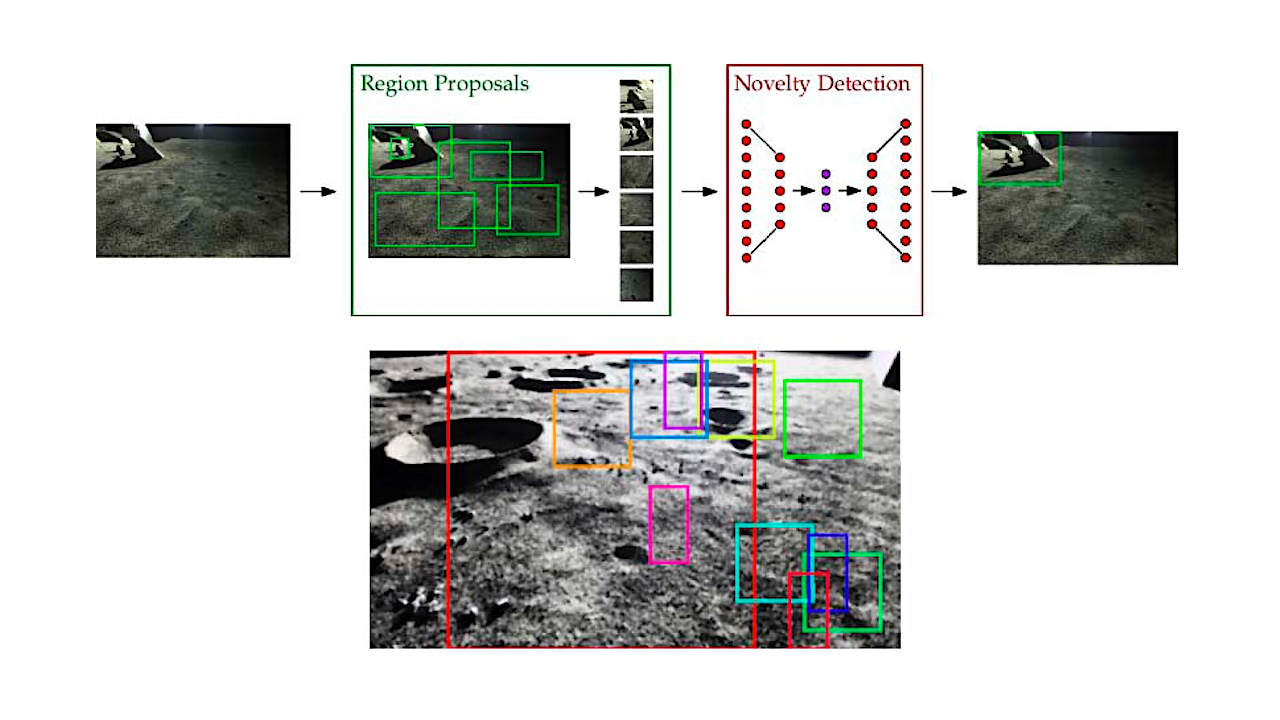
(top) Schematic of the novel region extraction (NRE) pipeline. NREs cascade a class-agnostic region proposal system with full-image novelty detection and can be trained like traditional reconstruction-based novelty detectors. (bottom)