(a) CORALS engineering test unit. (b) Schematic diagram of Fig. 1a illustrating key subsystems and components. (c) Ion optics simulation using SIMION® 8.1, showing a cut plane of the instrument.

(a) CORALS engineering test unit. (b) Schematic diagram of Fig. 1a illustrating key subsystems and components. (c) Ion optics simulation using SIMION® 8.1, showing a cut plane of the instrument.
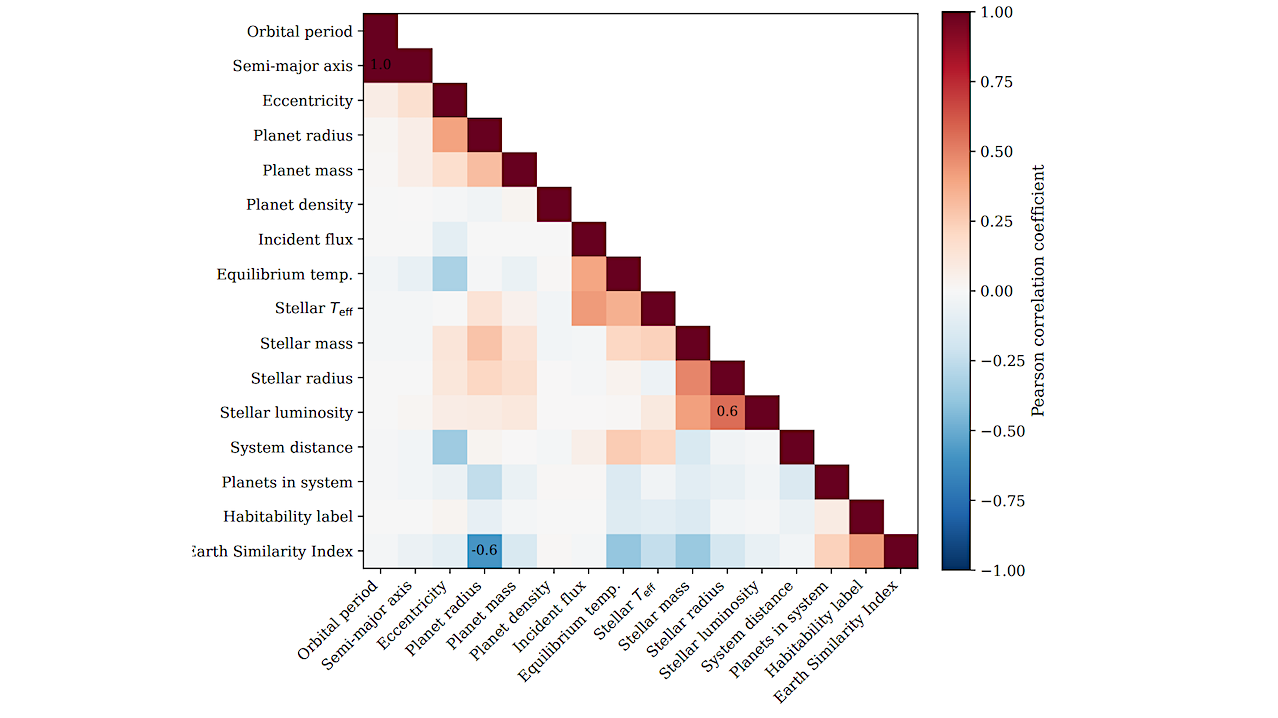
Lower-triangular Pearson correlation matrix of the final feature set used in this study. Each cell shows the Pearson correlation coefficient between a pair of planetary or stellar properties, with the
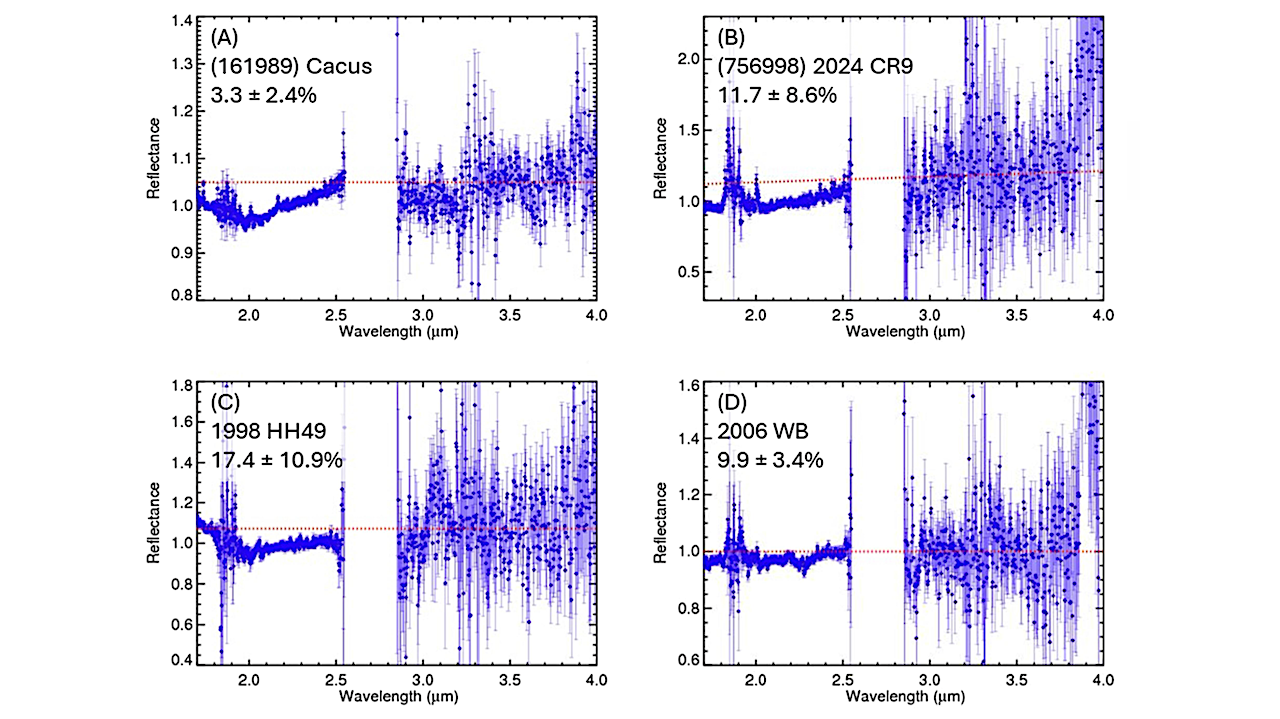
Spectra of NEOs with (potential) 3 μm absorption features. (A) Spectrum of (161989) Cacus as observed on 2022 September 3 and 4. (B) (756998) 2024 CR9 as observed on 2024
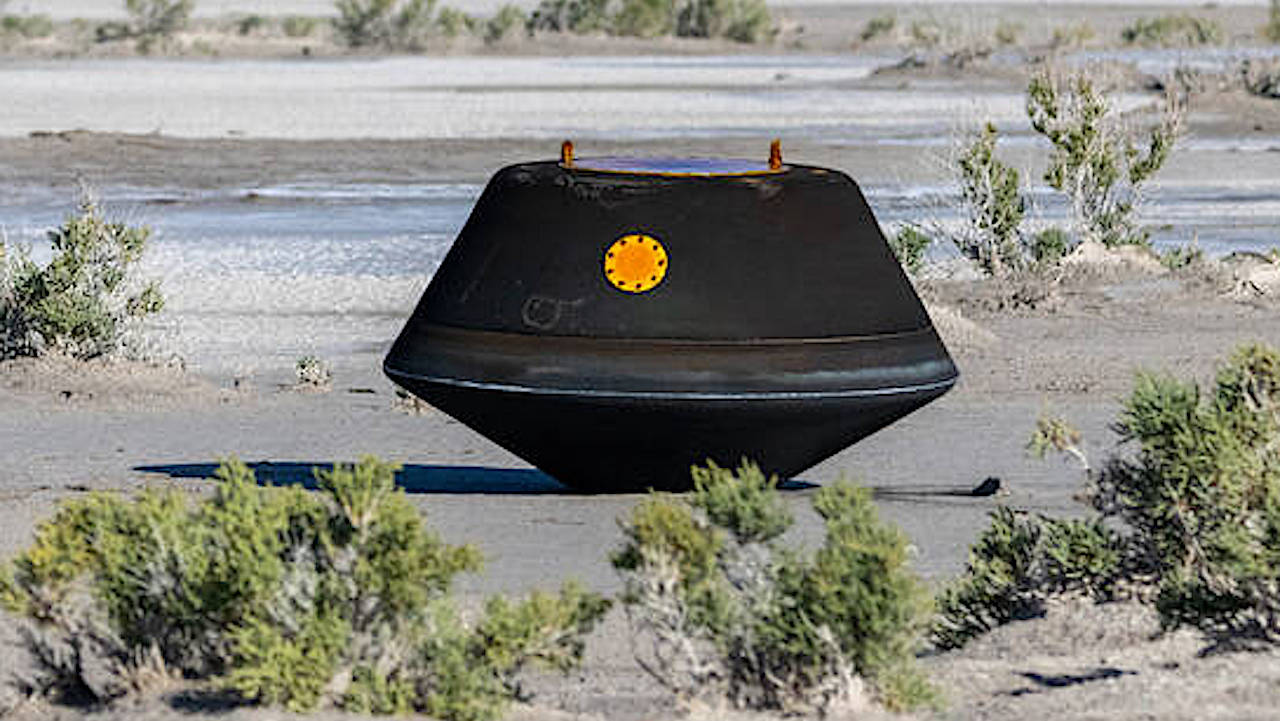
Asteroids are some of the oldest objects in the solar system: leftovers from the chaotic time when planets were assembling from dust and rock. They’re time capsules, preserving clues about
The abstract in PubMed or at the publisher’s site is linked when available and will open in a new window. Ebert D, Walton M, Byrne VE, Nelson AM, Sargsyan A.Autonomous
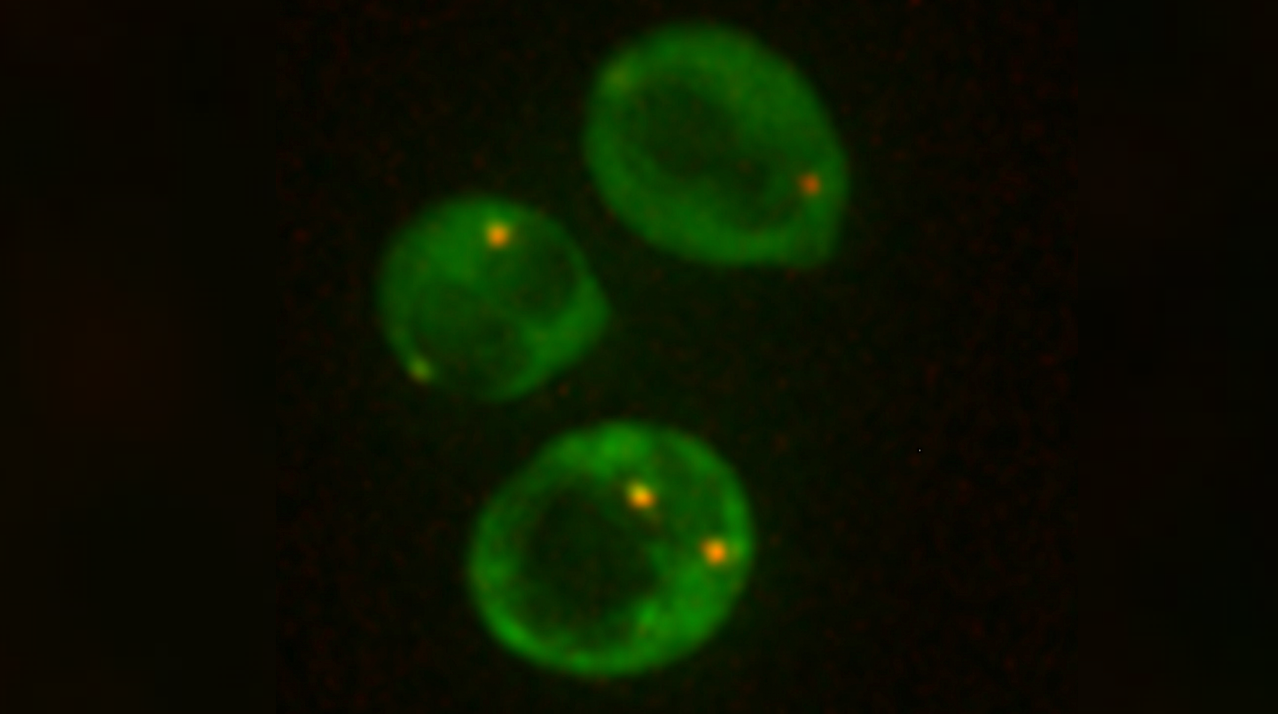
Assembly of cytoplasmic RNP condensates (yellow dots) in yeast cells in response to stress (Image: Riya Dhage) Baker’s yeast (Saccharomyces cerevisiae) is an indispensable ingredient in making bread, beer, and
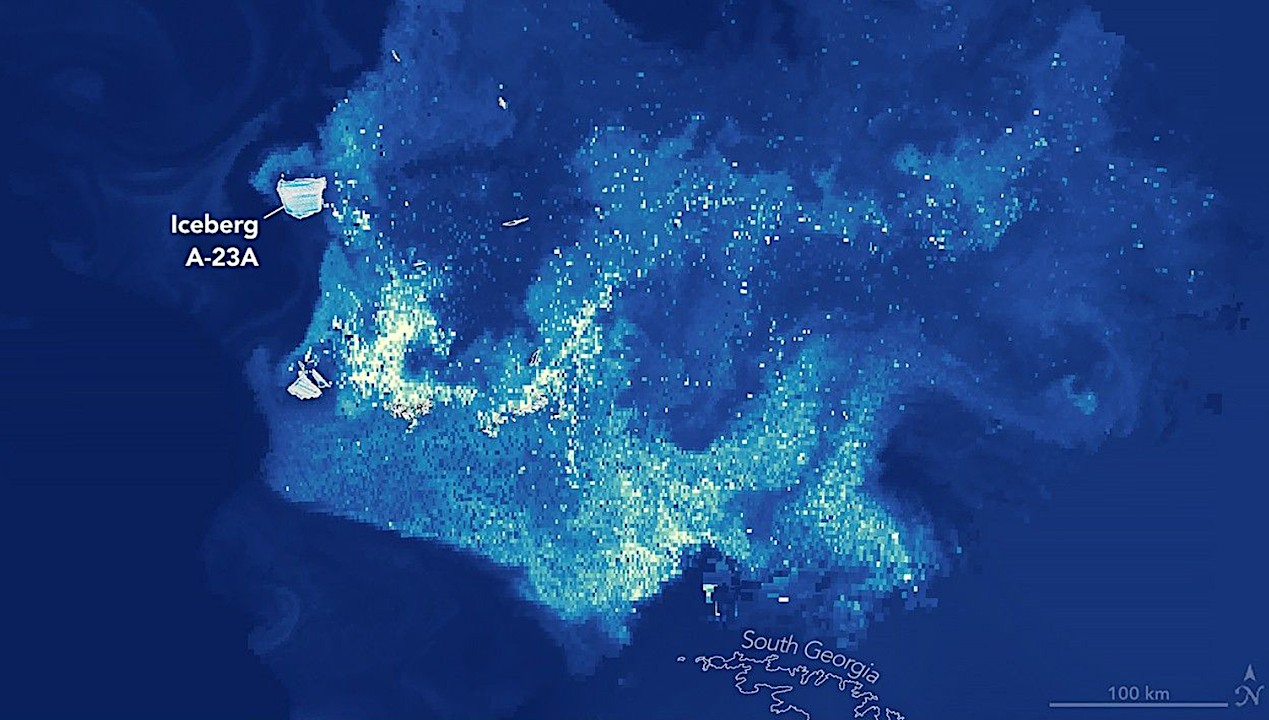
Iceberg A-23A has had a more eventful run than most of the large Antarctic icebergs that have calved from the continent’s ice shelves in recent decades. Over its winding, forty-plus-year
Keith Cowing Explorers Club Fellow, ex-NASA Space Station Payload manager/space biologist, Away Teams, Journalist, Lapsed climber, Synaesthete, Na’Vi-Jedi-Freman-Buddhist-mix, ASL, Devon Island and Everest Base Camp veteran, (he/him) 🖖🏻 Follow on
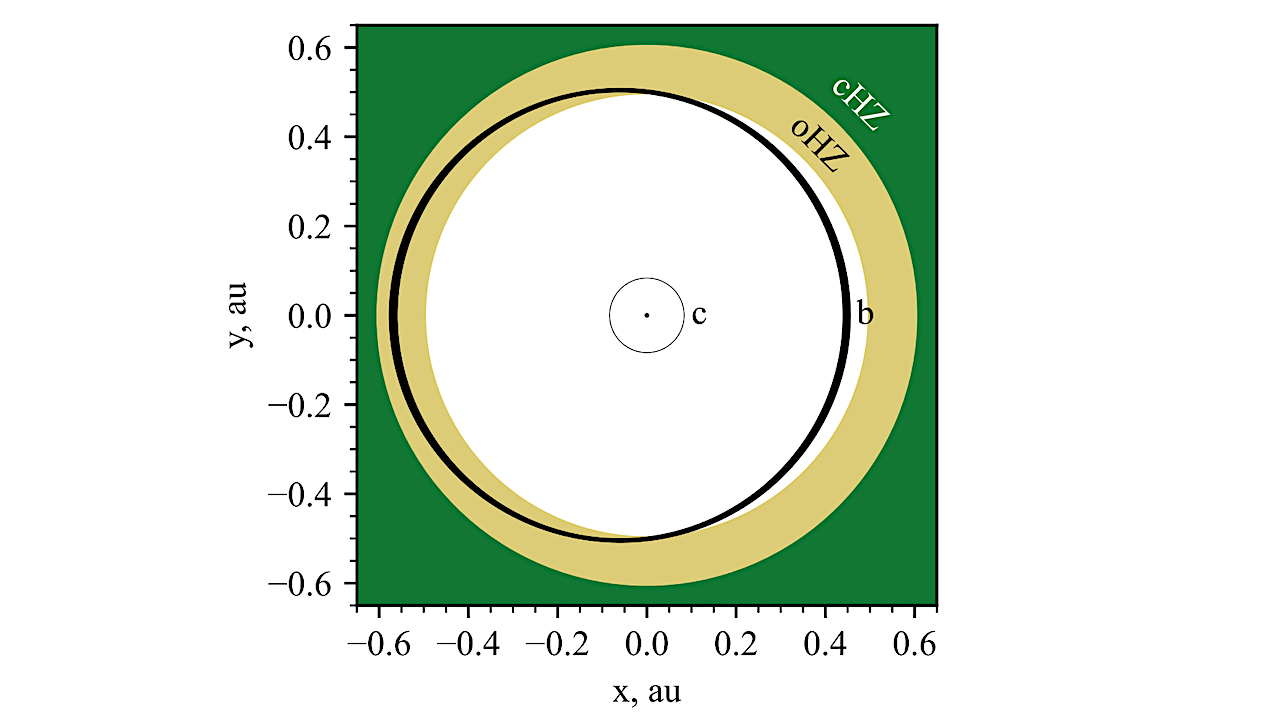
Planetary system of GJ 1137 relative to the conservative habitable zone (cHZ; green) and the optimistic habitable zone (oHZ; yellow), respectively. Black orbital bands come from our 1σ posteriors of
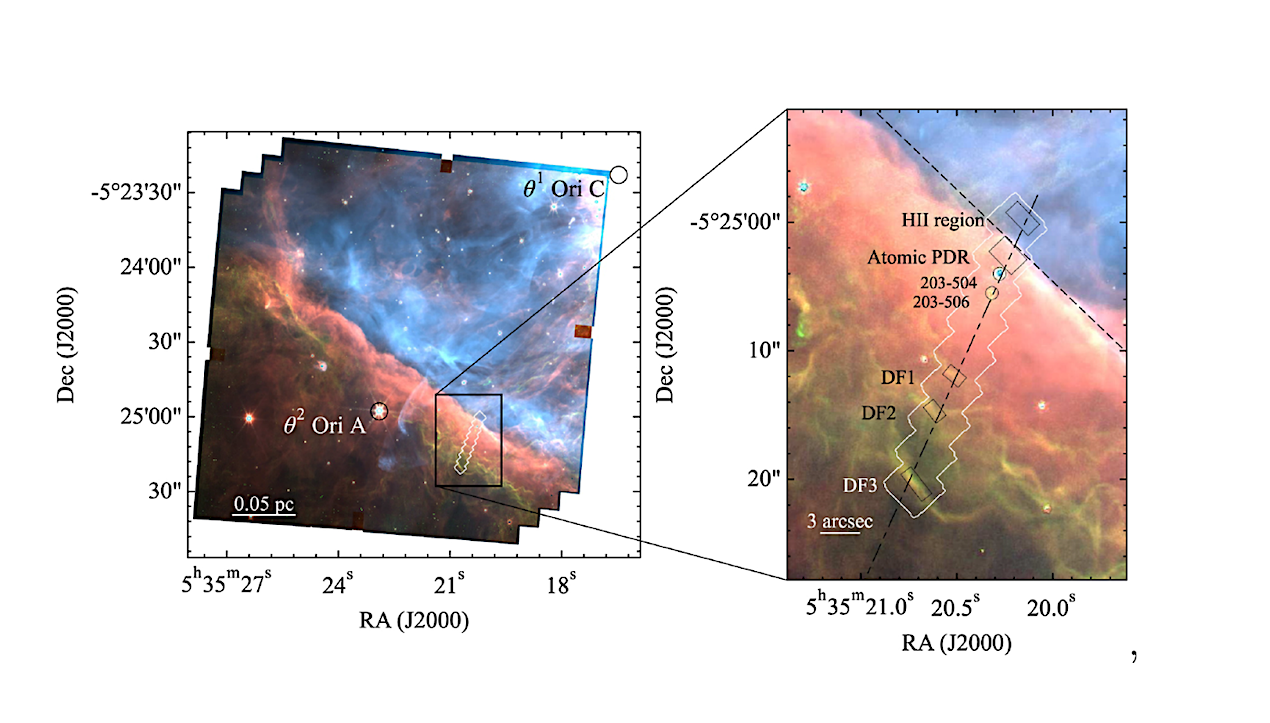
Top: Left: false color NIRCam image of the Orion Bar11 showing the NIRSpec mosaic footprint (white boundary). The composite image combines AIB emission (red), H2 emission (green), and H I