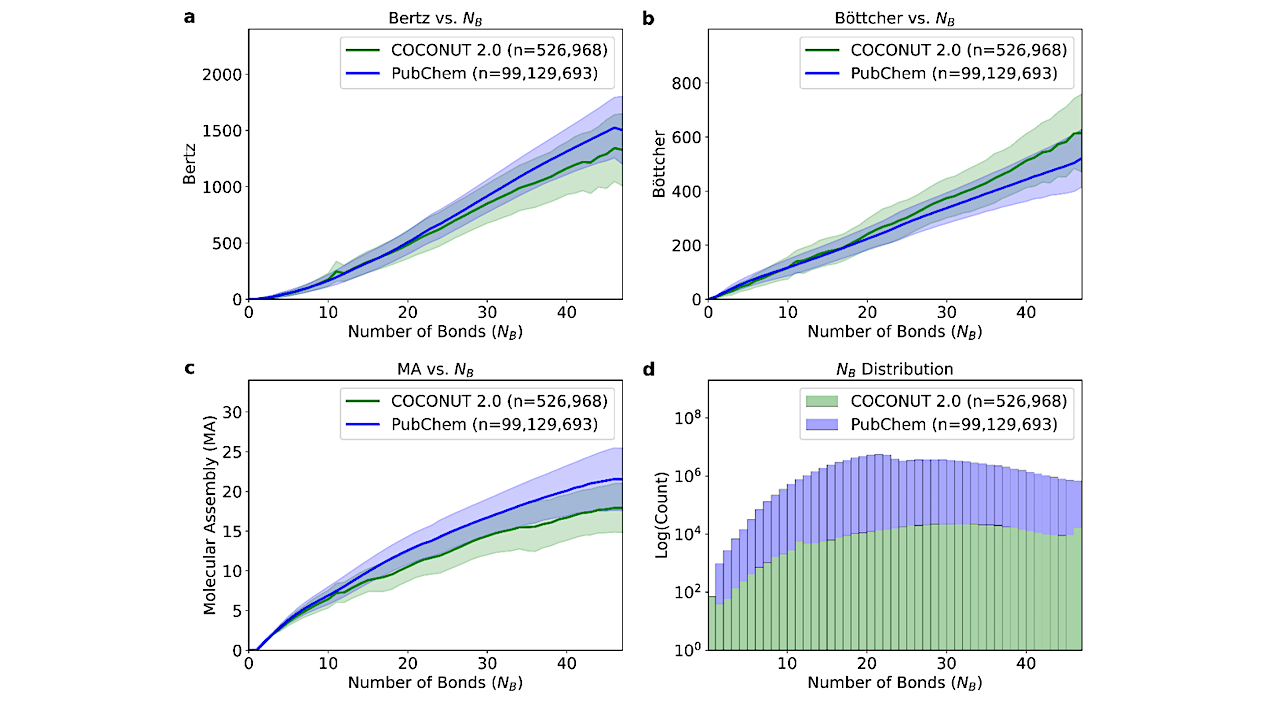
Molecular complexity growth rate per bond count between PubChem and COCONUT 2.0 molecules. Mean (solid line) and standard deviation (shaded area) of complexity scores per bond count between PubChem molecules

Molecular complexity growth rate per bond count between PubChem and COCONUT 2.0 molecules. Mean (solid line) and standard deviation (shaded area) of complexity scores per bond count between PubChem molecules
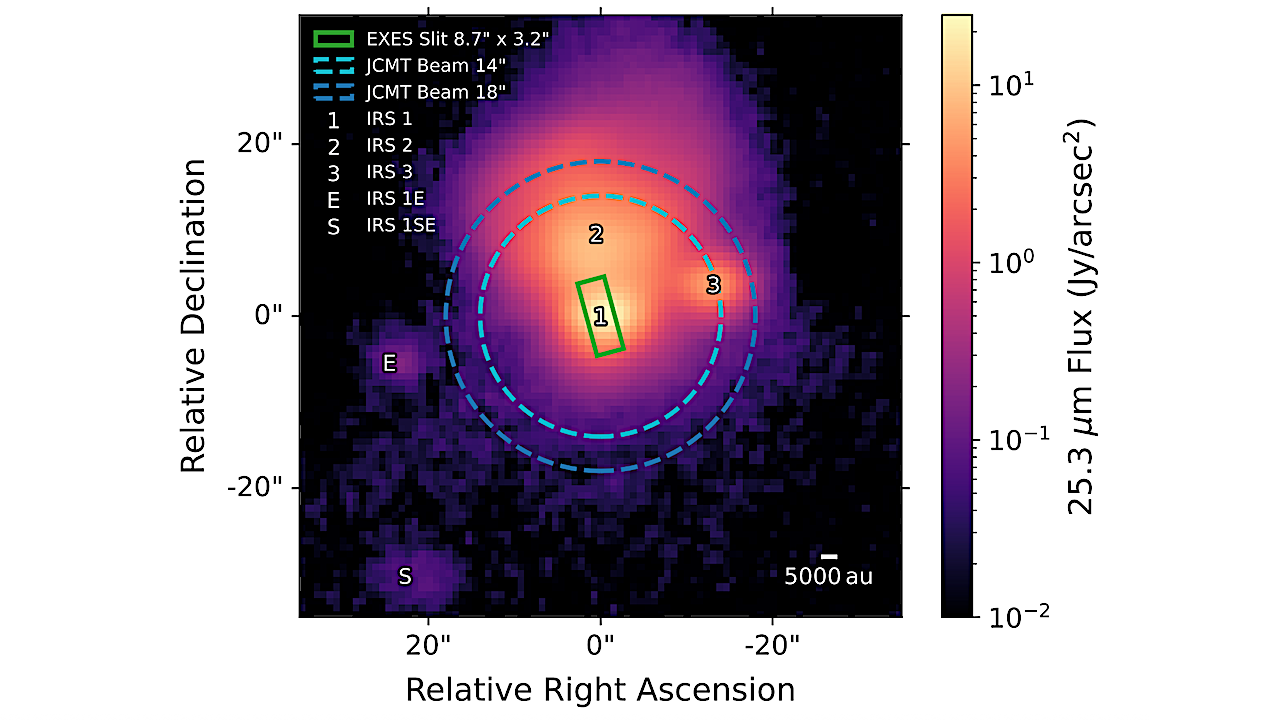
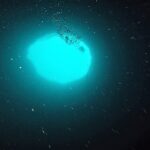
25.3 µm map of the NGC 7538 region from SOFIA/Faint Object infraRed Camera (FORCAST; Herter et al. 2013) archival data (Cycle 1 Program 0034, PI A. G. G. M. Tielens).
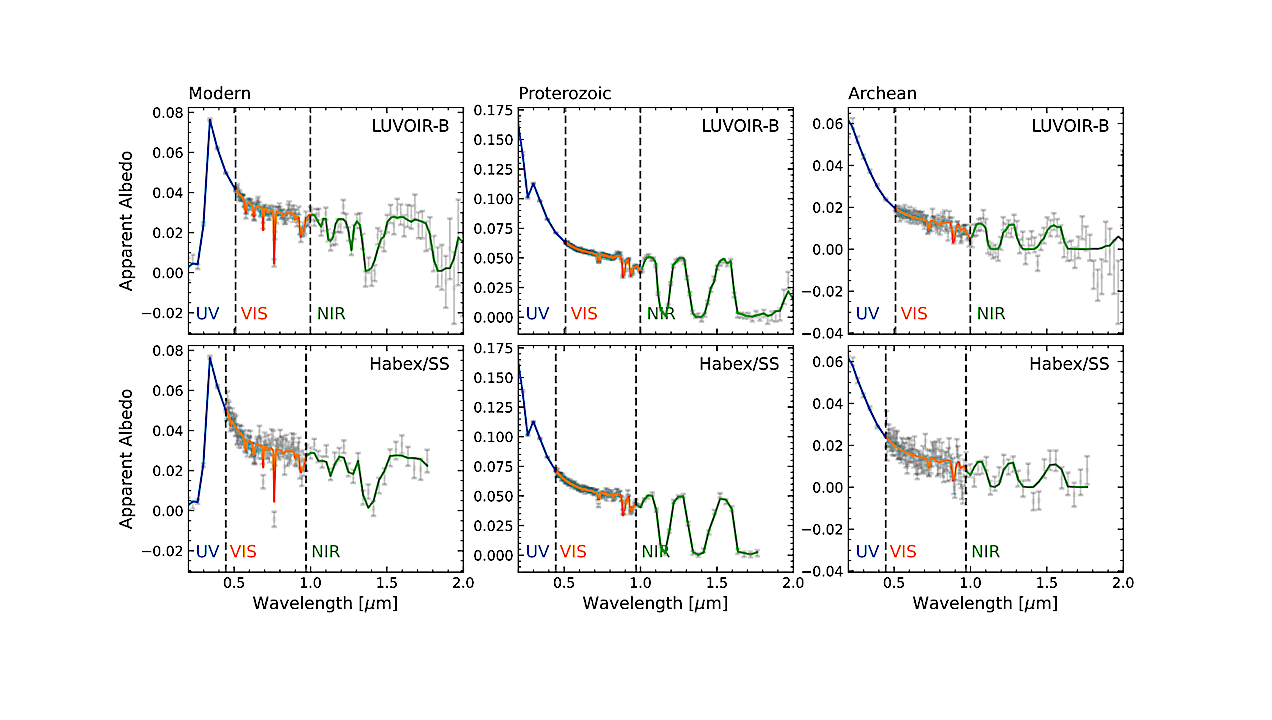
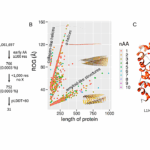
Examples of training reflection spectra for Earth-like exoplanets in the Archean (left), Proterozoic (center), and Modern (right) eras, observed with LUVOIR-B (top row) and Habex/SS (bottom row). Colored lines represent
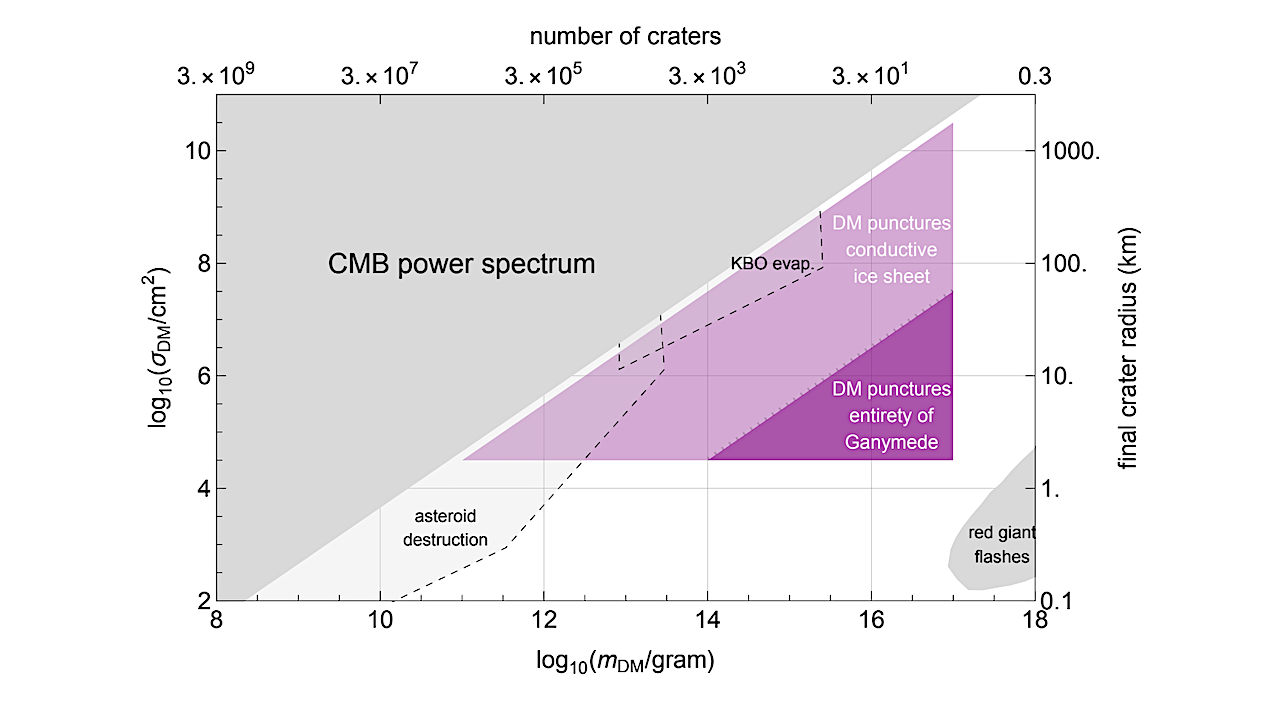
Status Report hep-ph August 4, 2025 The region in which dark matter impacts may leave detectable surface features on Ganymede. Gray regions correspond to existing constraints . The
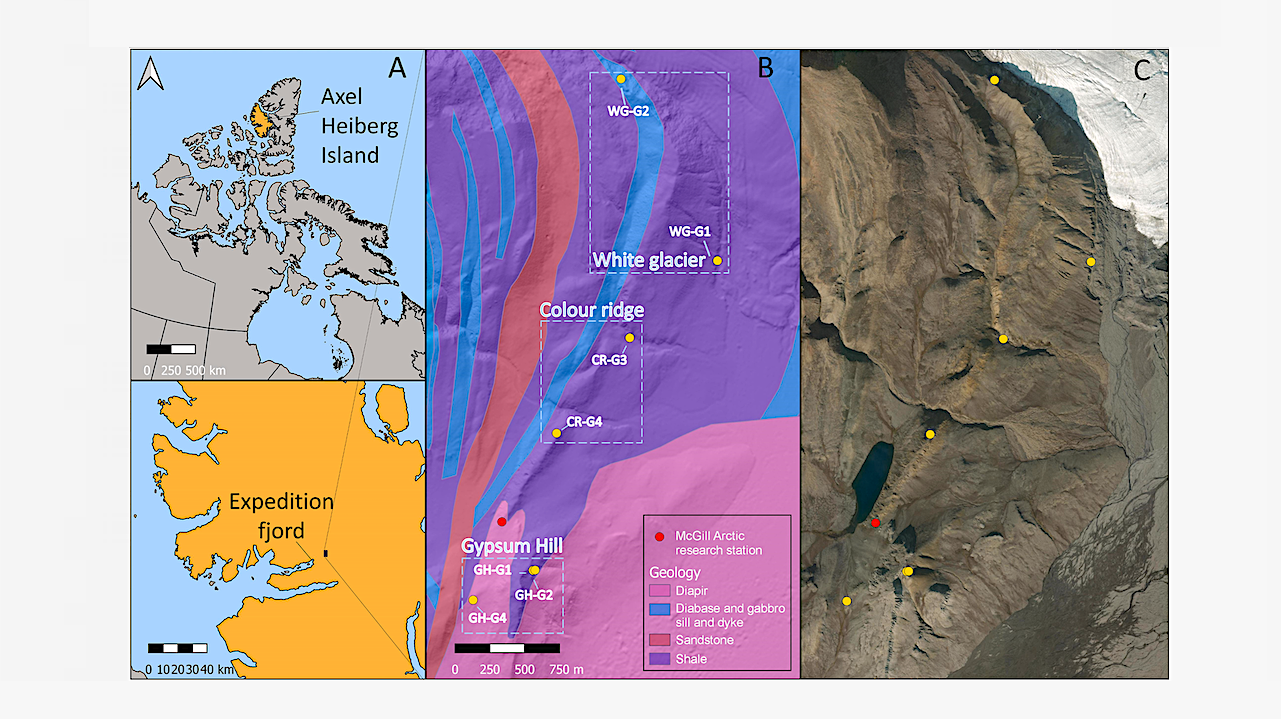
(A) Map of the study area on Axel Heiberg Island, Nunavut, Canada. The north arrow is valid for every panel. (B) Geological map of the region modified from Harrison and
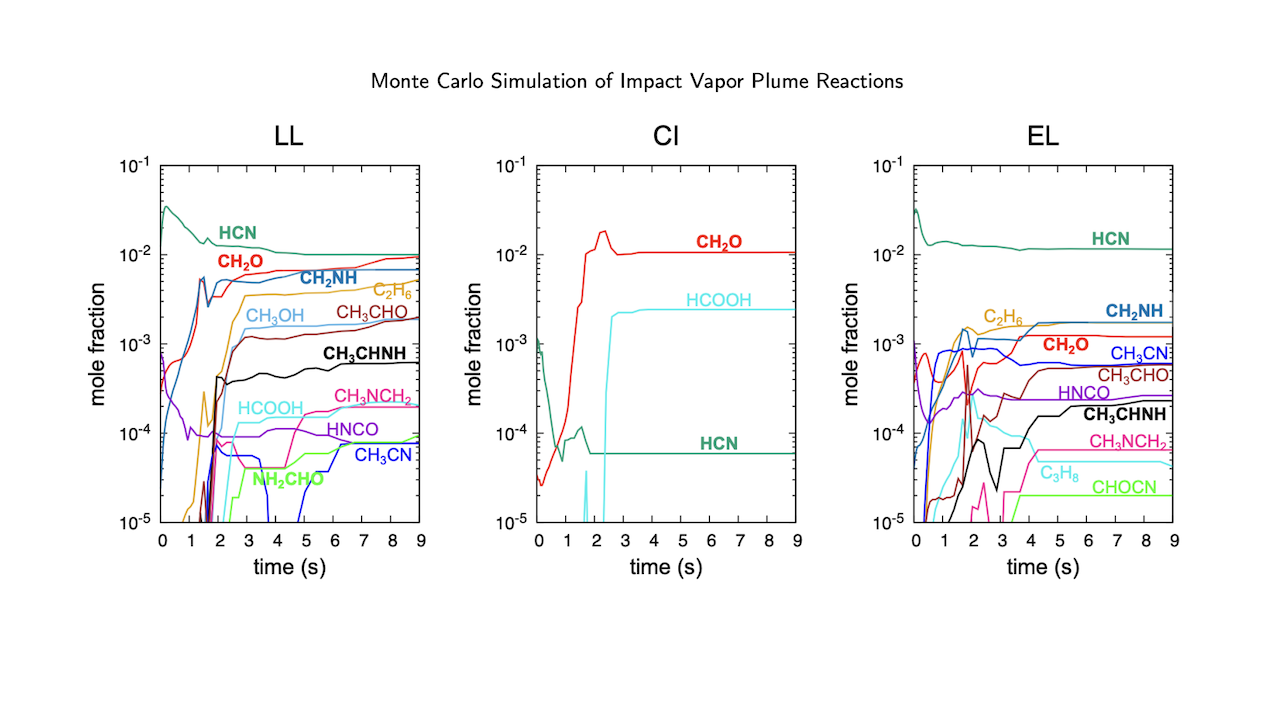
Time evolution of mole fractions of organic molecules. The molecules represented by each chemical formula are as follows: hydrogen cyanide (HCN), formaldehyde (CH2O), methanol (CH3OH), formic acid (HCOOH), isocyanic acid
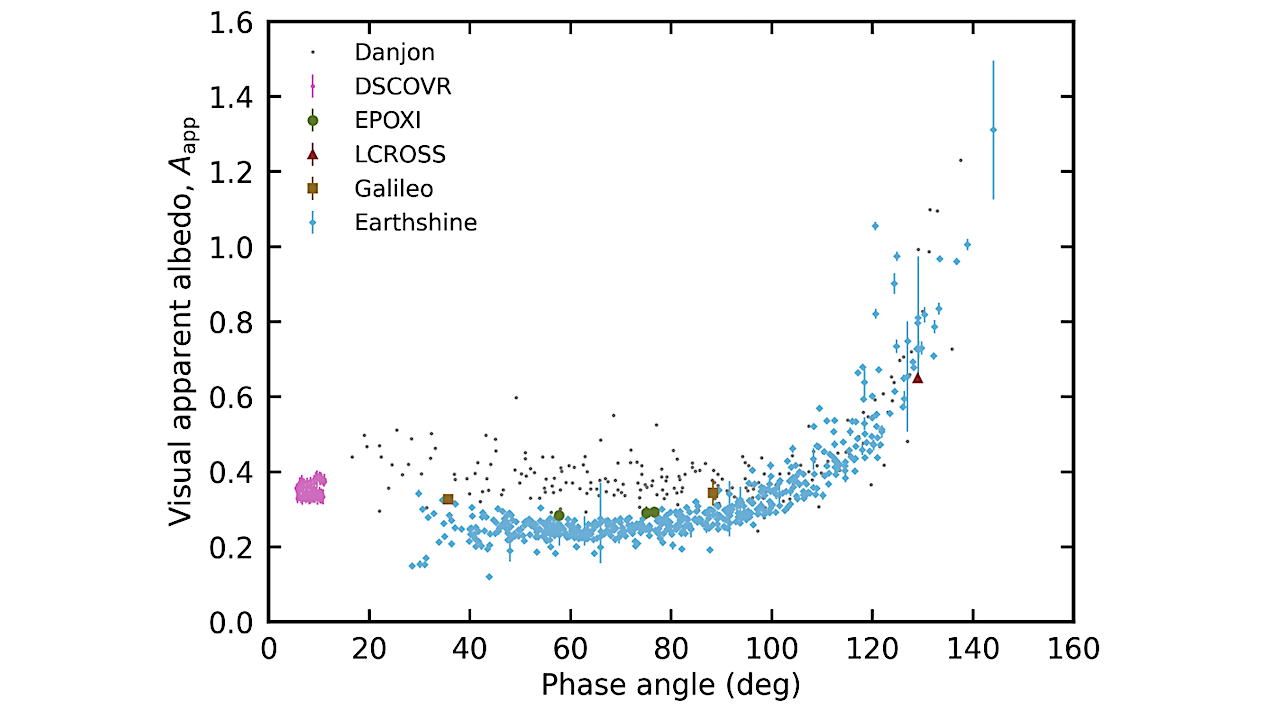
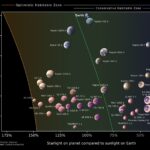
Phase-dependent measurements of Earth’s broadband visual apparent albedo, including historic observations from Danjon (1928). Mission or observing technique is indicated by datapoint color and shape. Uncertainties are indicated, which are
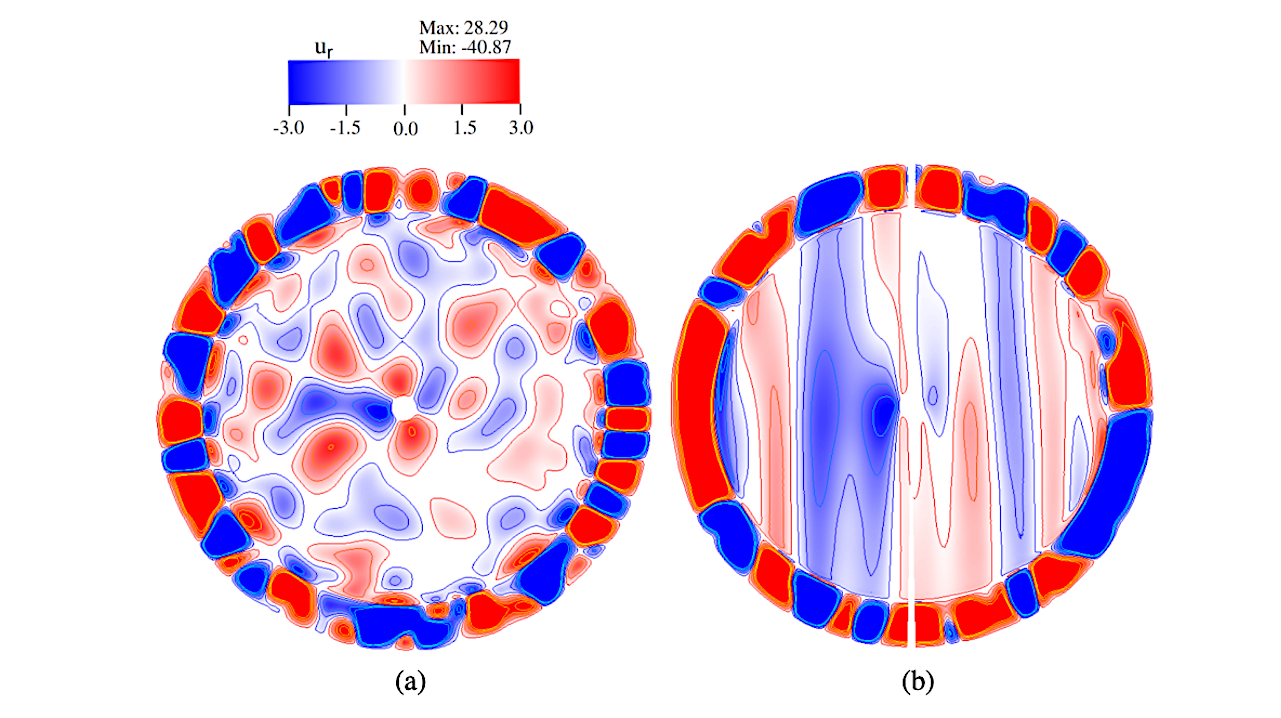
(a) Equatorial section of ur and (b) azimuthal section of uϕ showing a typical flow pattern for the metallic core-silicate magma ocean system for the default model D. — astro-ph.EP
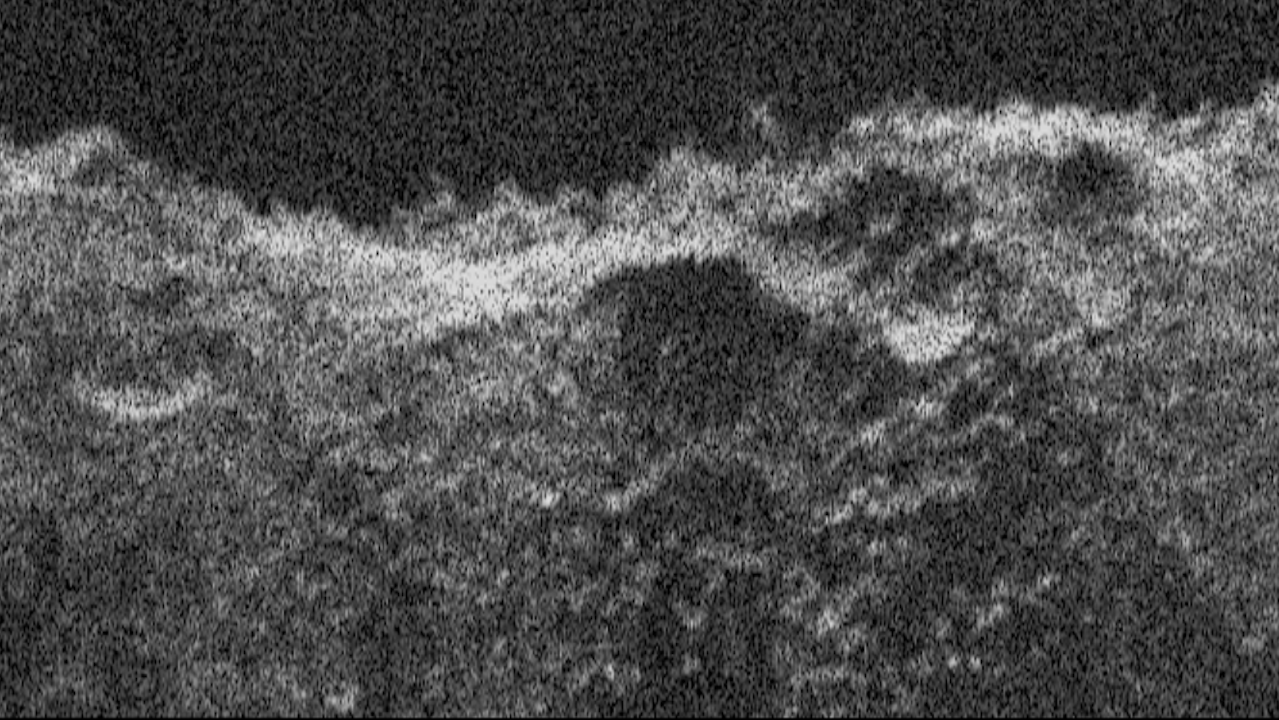
Europa Clipper’s radar instrument received echoes of its very-high-frequency radar signals that bounced off Mars and were processed to develop this radargram. What looks like a skyline is the outline