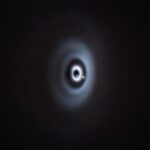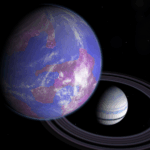
Artist concept highlighting the novel approach proposed by the 2025 NIAC awarded selection of Inflatable Starshade for Earthlike Exoplanets concept. — NASA/John Mather — NASA Innovative Advanced Concepts (NIAC) Imaging

Artist concept highlighting the novel approach proposed by the 2025 NIAC awarded selection of Inflatable Starshade for Earthlike Exoplanets concept. — NASA/John Mather — NASA Innovative Advanced Concepts (NIAC) Imaging
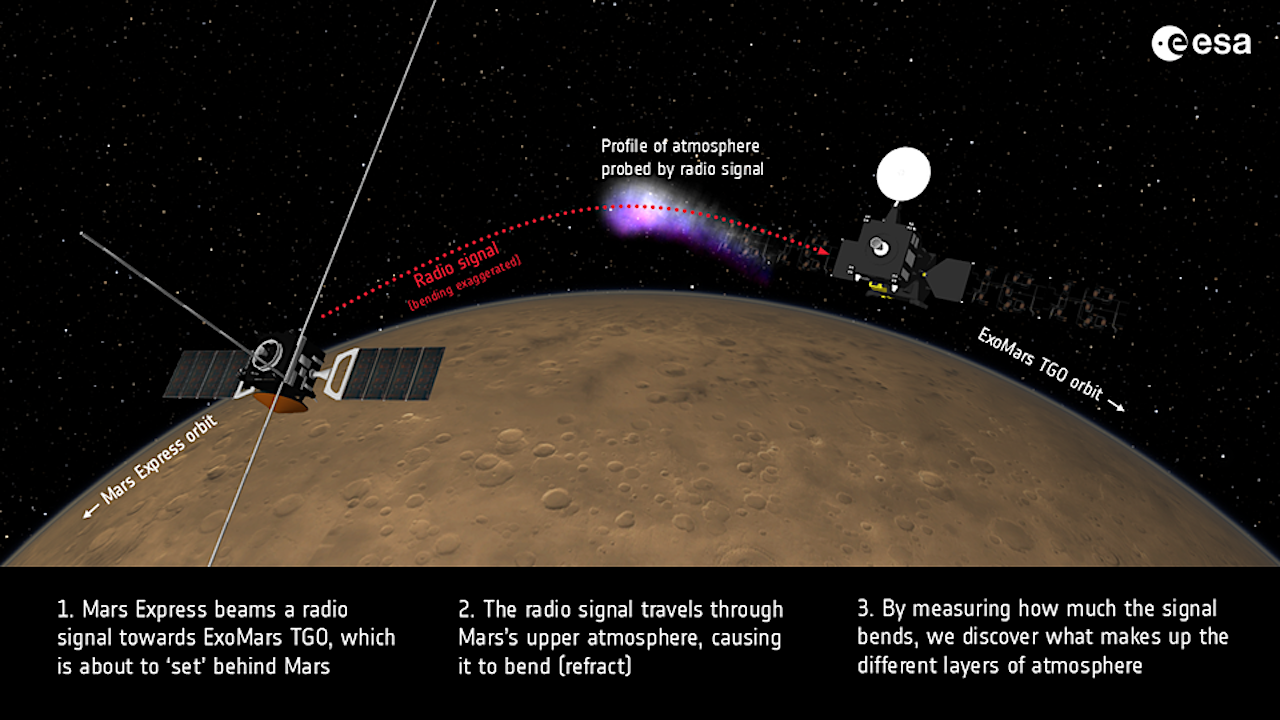
How ESA’s Mars orbiters make use of radio occultation — ESA What happens when a solar superstorm hits Mars? Thanks to the European Space Agency’s Mars orbiters, we now know:
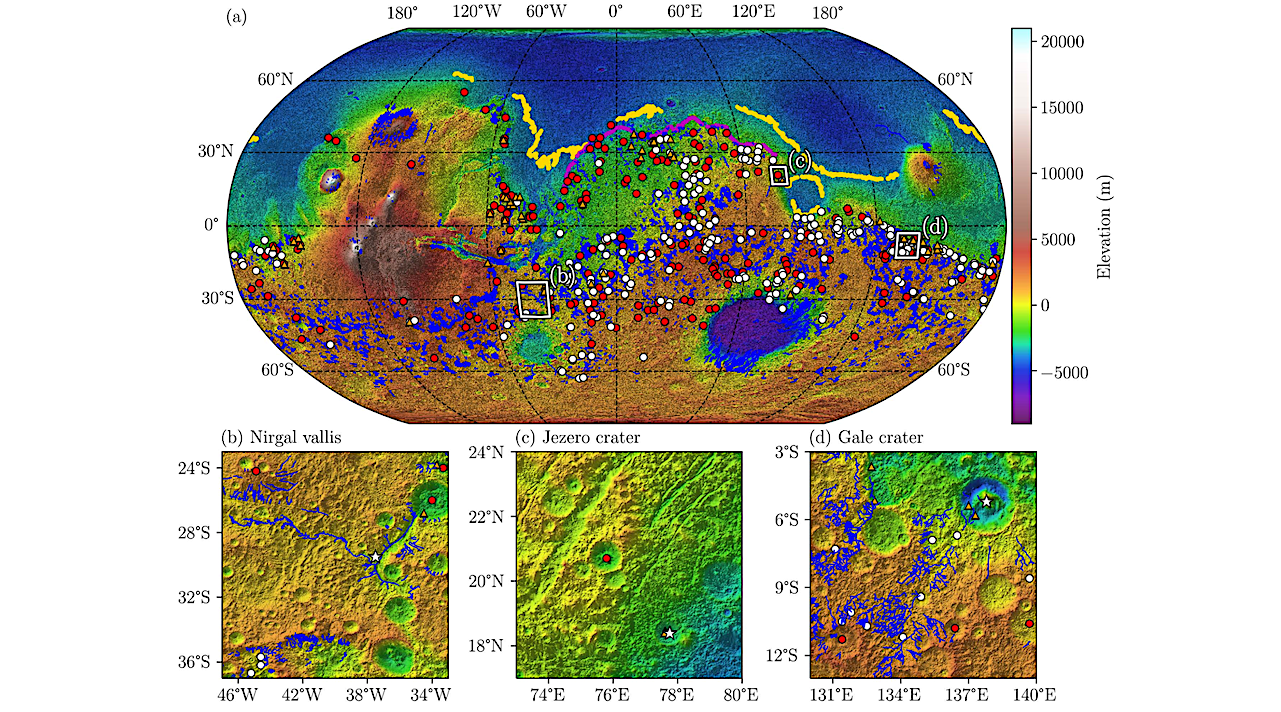
Mars topographic map showing the inventory of observed data relating to water flow effects. (a) Digital Elevation Model (DEM) from the Mars Orbiter Laser Altimeter (MOLA) (Smith et al., 2001;

Comparative Genomics – Image GitHub Join ESA and NASA on 11 March 2026 (16:00-18:00 CET) for a seminar on how ESA omics data are shared, curated and accessed through NASA’s
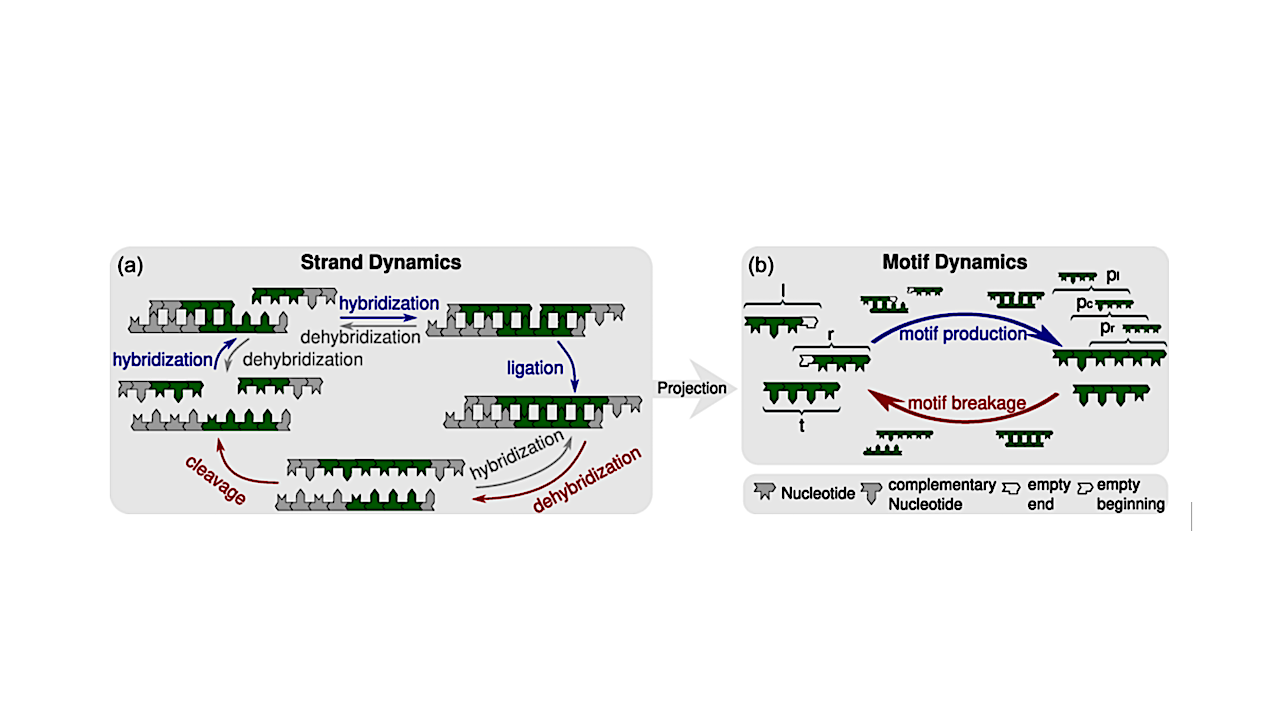
Origin & Evolution of Life Status Report Physical Review E March 6, 2026 Kinetic processes of the strand-based RNA reactor model and their projection onto motif kinetics. We consider
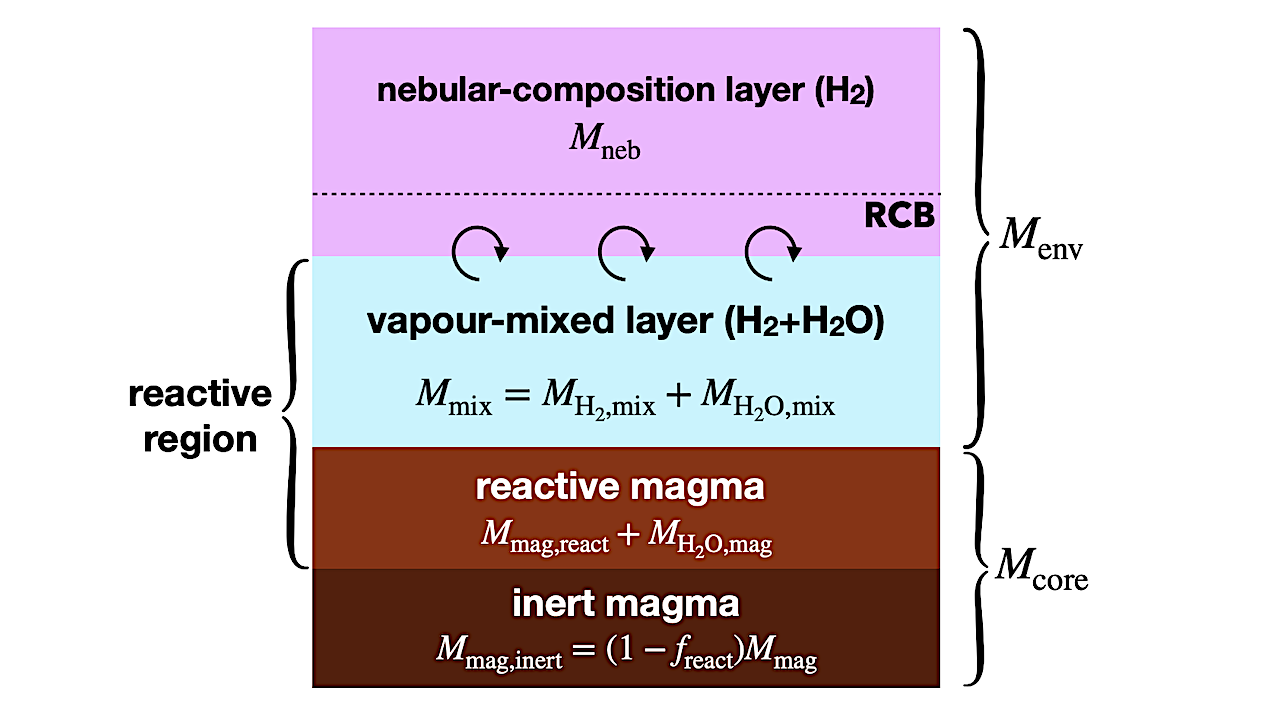
Schematic structure of the planet in our model. From top to bottom, the planet consists of four layers: a nebular-composition envelope (pure H2), a vapor-mixed envelope (H2 + H2O), a
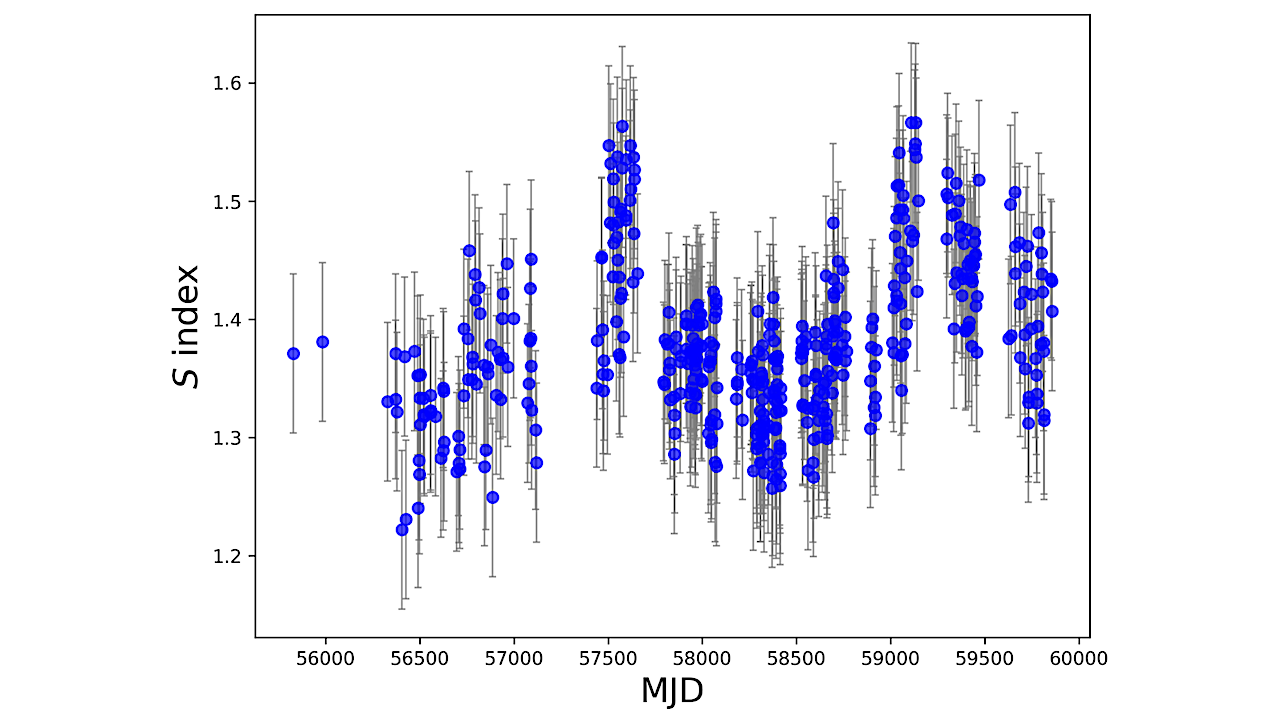
Time series of the S -index for GJ 617A. Each point represents a SOPHIE spectrum. — astro-ph.SR M dwarfs are prime targets for exoplanet searches due to their low masses
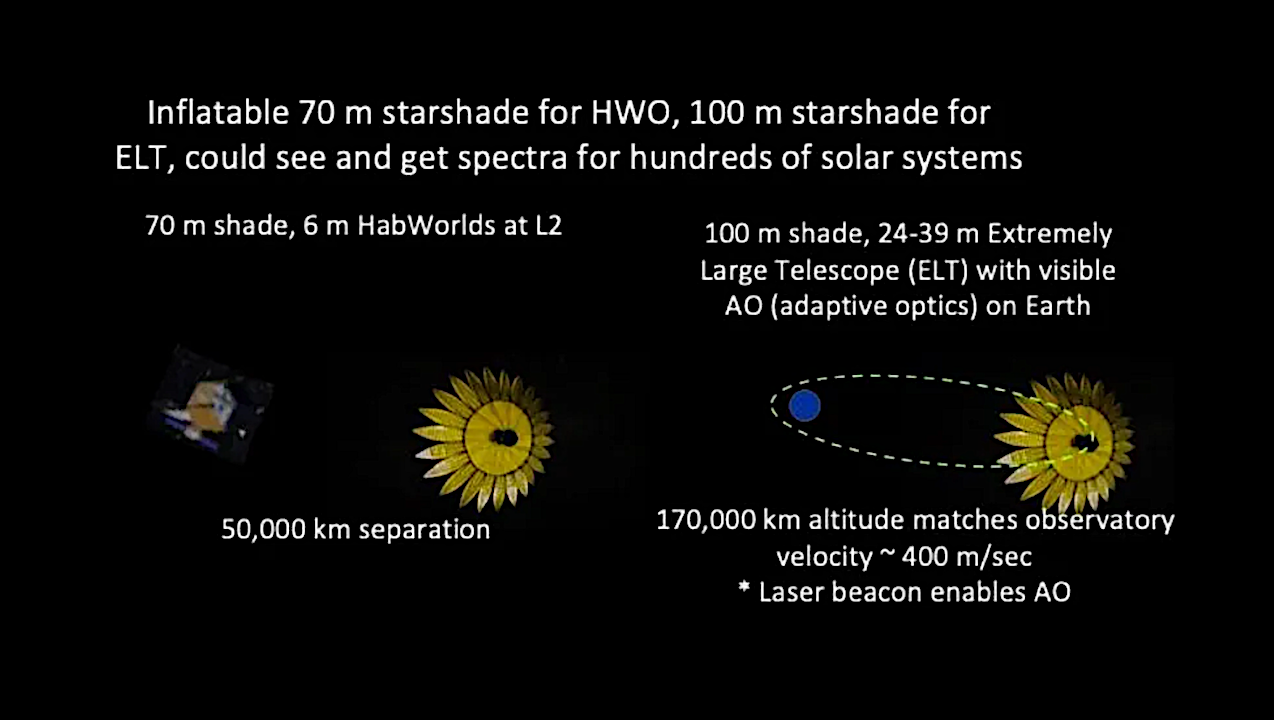
Finding Earth-like planets orbiting sun-like stars and identifying signs of life such as oxygen or water is a major goal in astronomy and a key interest for the public. Addressing
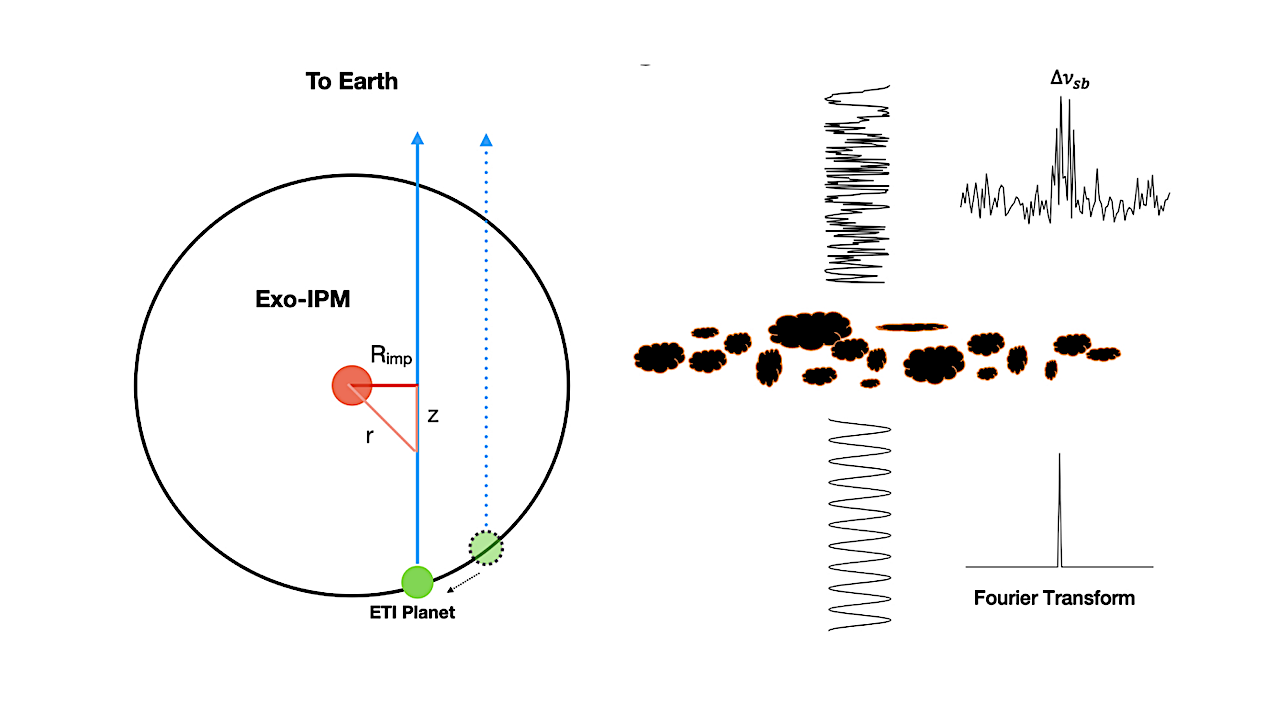
Left panel: schematic of an extraterrestrial transmitter on a planet (green) within the Exo-IPM, with Rimp indicating the impact distance of the passing line of sight between Earth and the
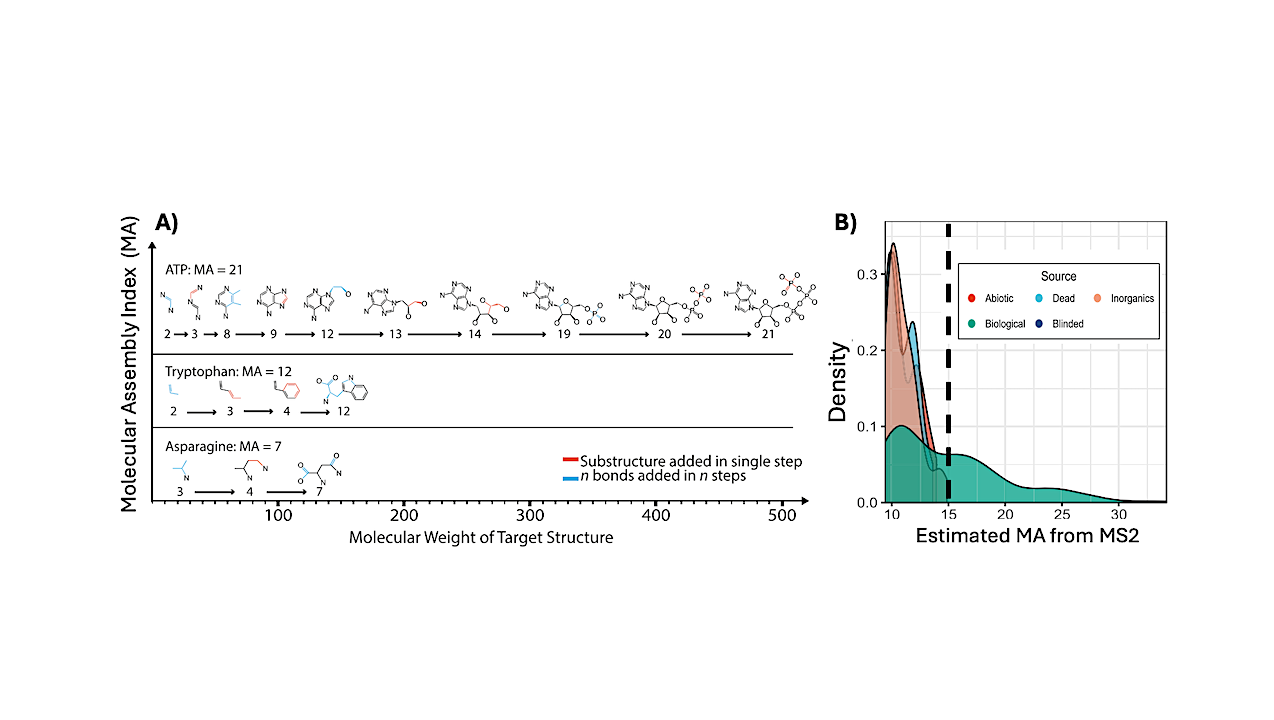
A) Molecular assembly index (MA) and assembly paths for amino acids asparagine (MA = 7) and tryptophan (MA = 12), and the important energy carrier adenosine triphosphate (MA = 21)