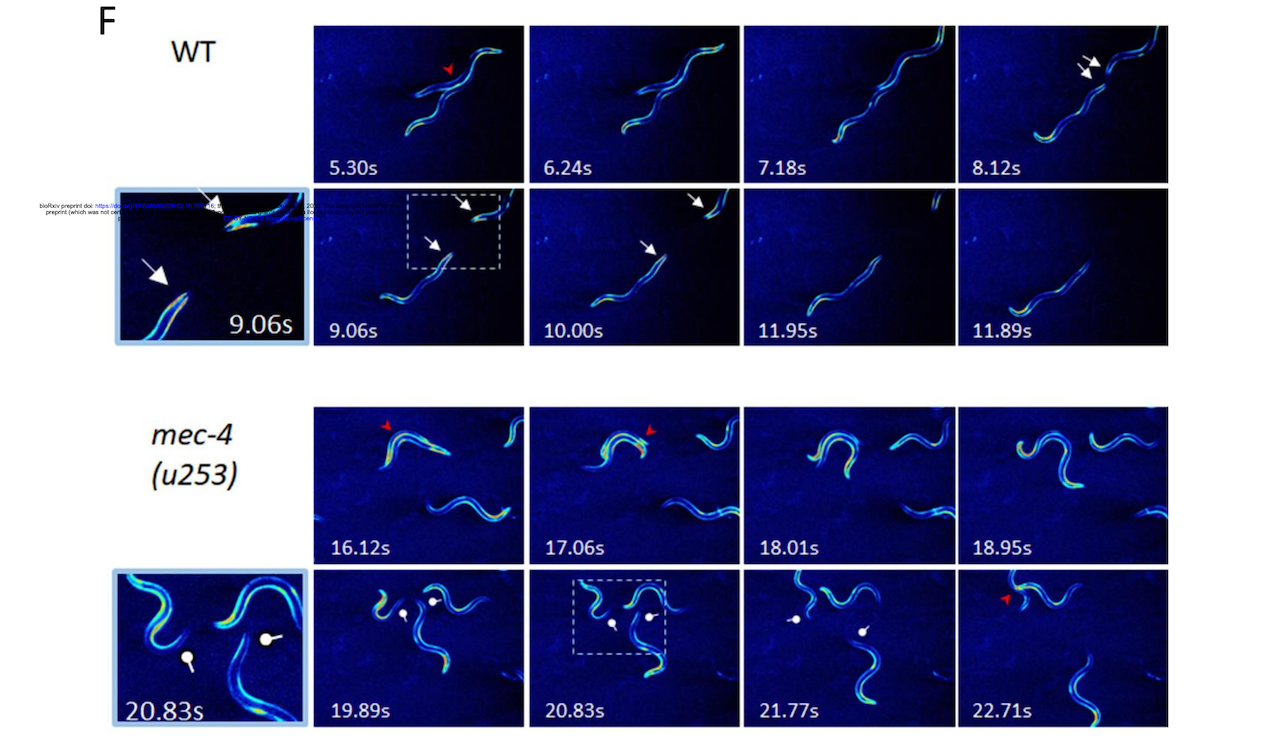
Effect of mec-4 mutations on neuromuscular aging and muscular calcium transients in a terrestrial 1G environment. (A) Heatmap analysis of log2(FC) ratio of autophagy/aggrephagy genes between D01 wild type and

Effect of mec-4 mutations on neuromuscular aging and muscular calcium transients in a terrestrial 1G environment. (A) Heatmap analysis of log2(FC) ratio of autophagy/aggrephagy genes between D01 wild type and
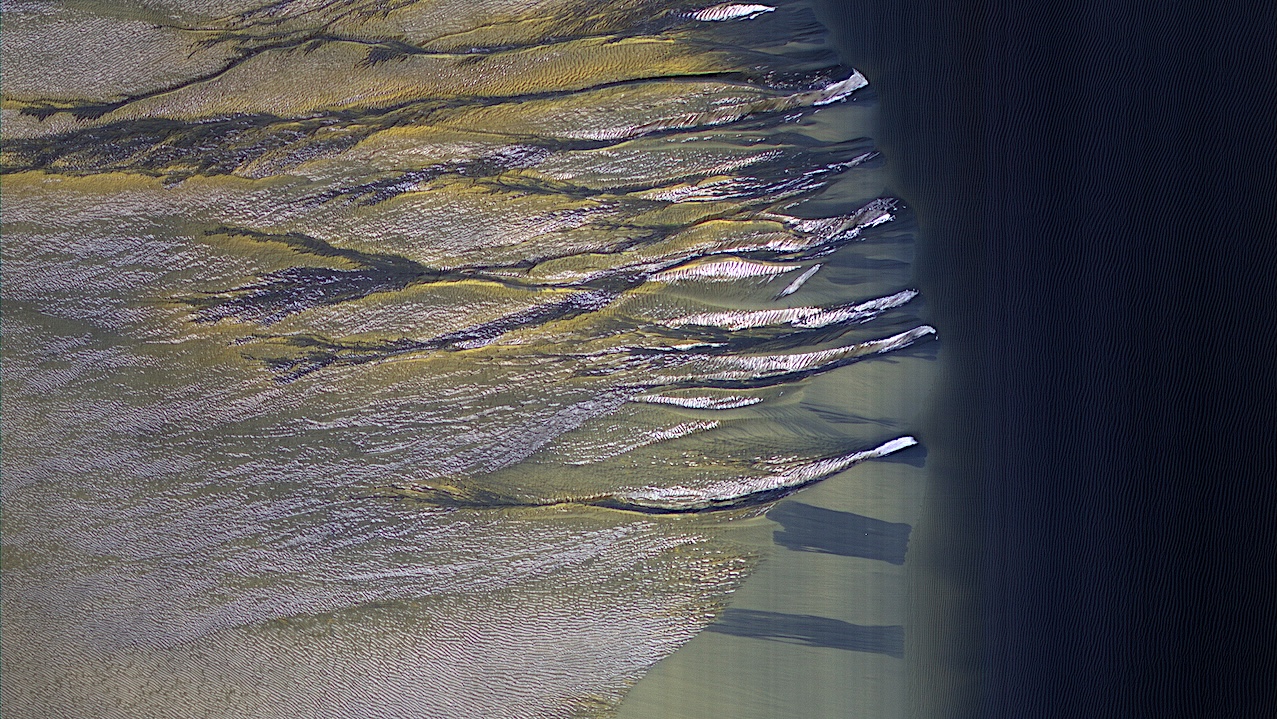
ID: ESP_072042_1330, date: 8 December 2021,altitude: 251 km larger image NASA/JPL-Caltech/University of Arizona The dark sand dune at the center of this observation is covered in a blanket of white
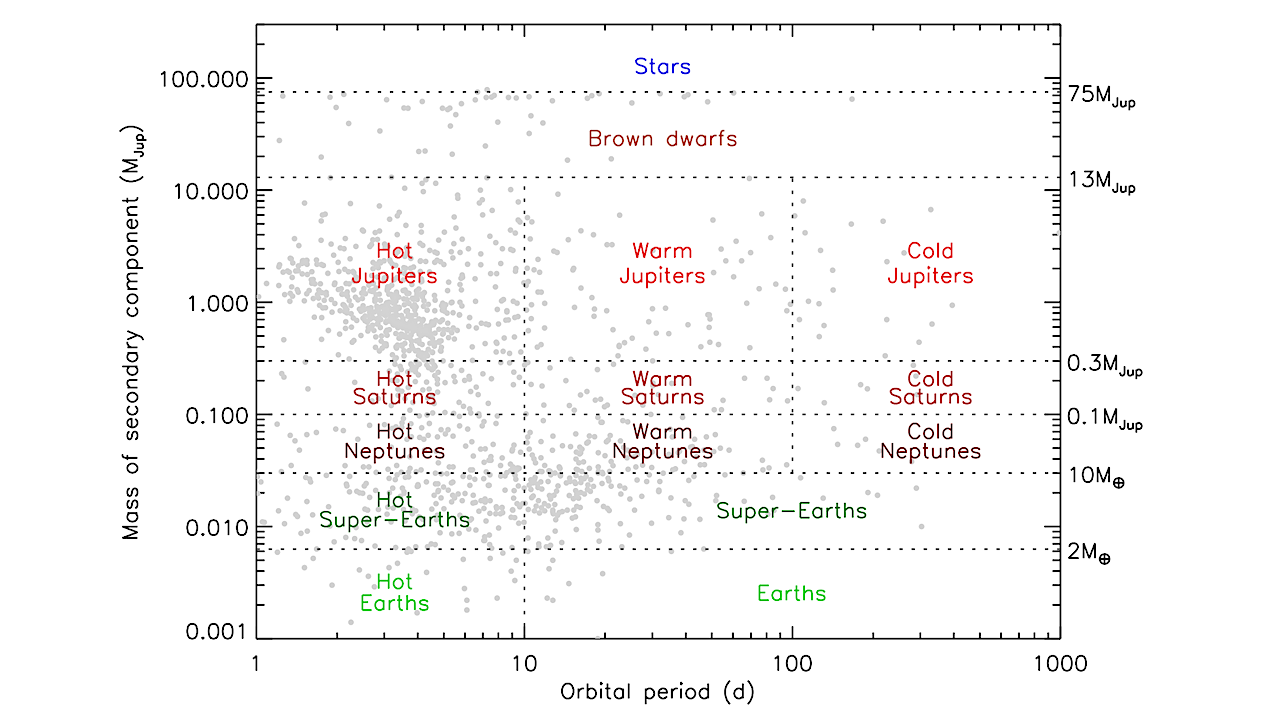
Exoplanets, -moons, -comets Status Report astro-ph.EP) March 2, 2026 Schematic diagram for classifying planets according to their masses and orbital periods. The various categories of planets are labelled. The boundary
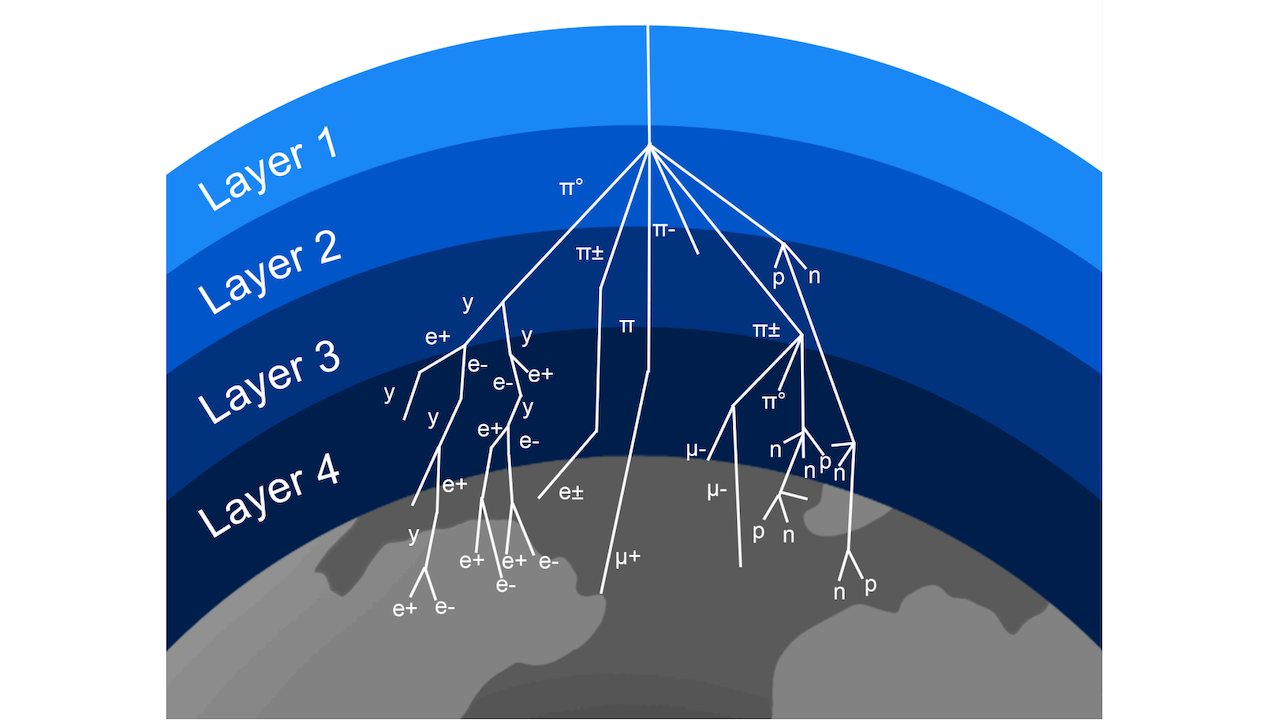
Two-dimensional wireframe representation of the atmospheric geometry implemented in the Geant4 simulations. The model consists of four concentric spherical layers corresponding to the altitude ranges 15–20 km, 20–25 km, 25–30
Keith Cowing Explorers Club Fellow, ex-NASA Space Station Payload manager/space biologist, Away Teams, Journalist, Lapsed climber, Synaesthete, Na’Vi-Jedi-Freman-Buddhist-mix, ASL, Devon Island and Everest Base Camp veteran, (he/him) 🖖🏻 Follow on

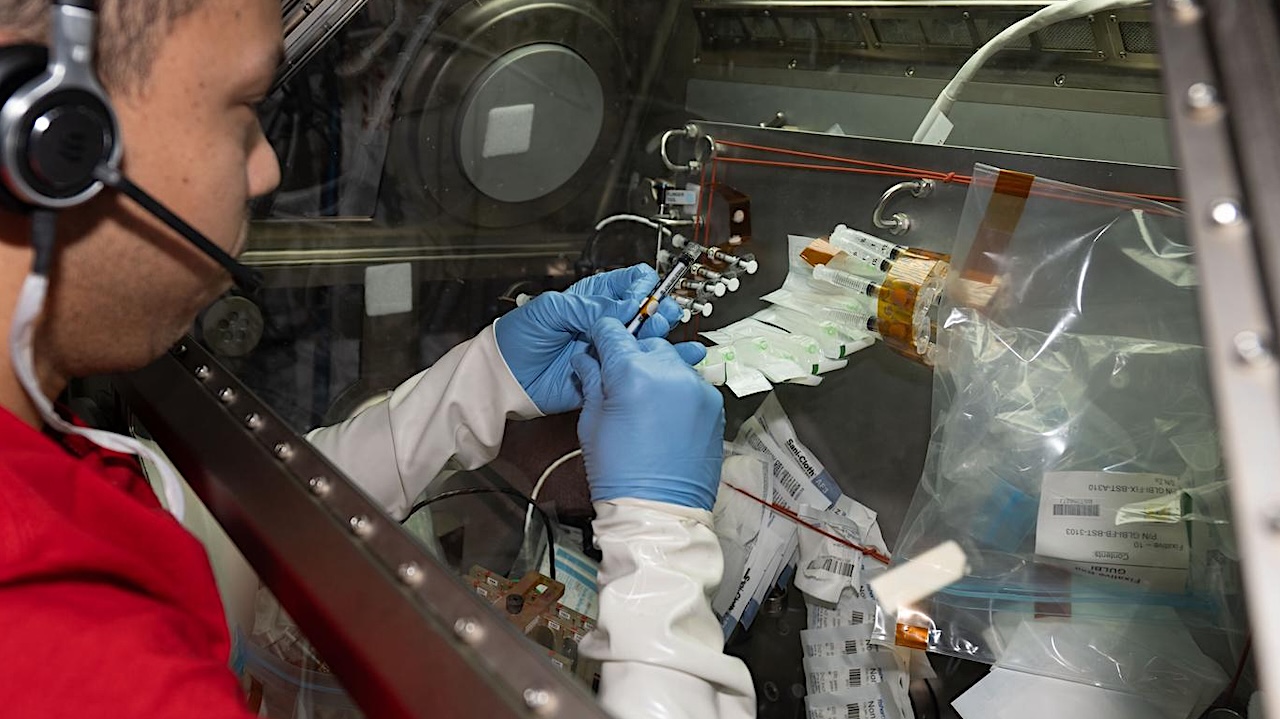
Biofilms, shown here, are structured communities of microorganisms that could be important to space exploration. — University of Houston University of Houston microbiologist Madhan Tirumalai is part of NASA’s Analysis

Rocky Worlds Director’s Discretionary Program The JWST Users Committee (JSTUC) met in person in Baltimore on December 2 and 3, 2025. Presentations included updates on the overall status of the
Zoom in to explore this image at its full 10 m resolution. Larger image The bay is on the coast of Victoria Land on the Ross Sea – an extension
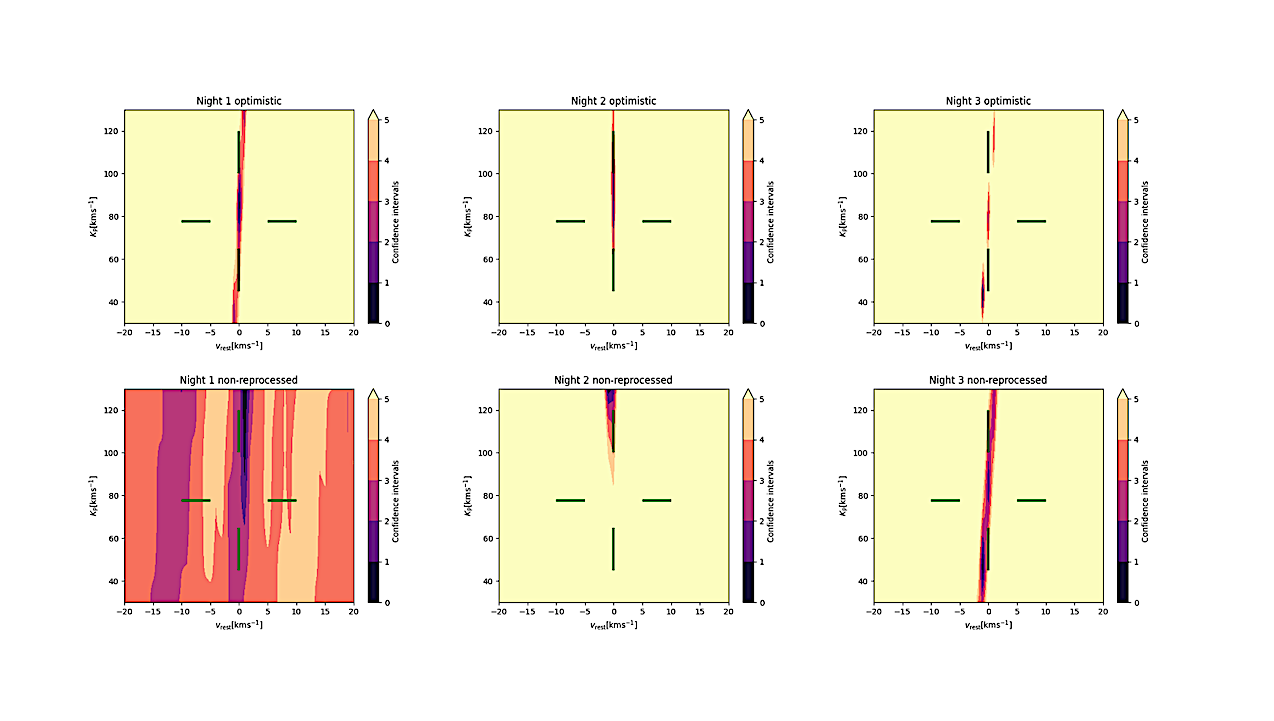
Recovery of an injected signal for the cloud-free case of V1298 Tau b on a vrest − KP grid for each synthetic night simulated using Ratri for the case of
Scientists might have just found Earth’s icy, distant cousin a few hundred million light-years away. HD 137010 b is one of thousands of exoplanets, or planets that orbit other stars,