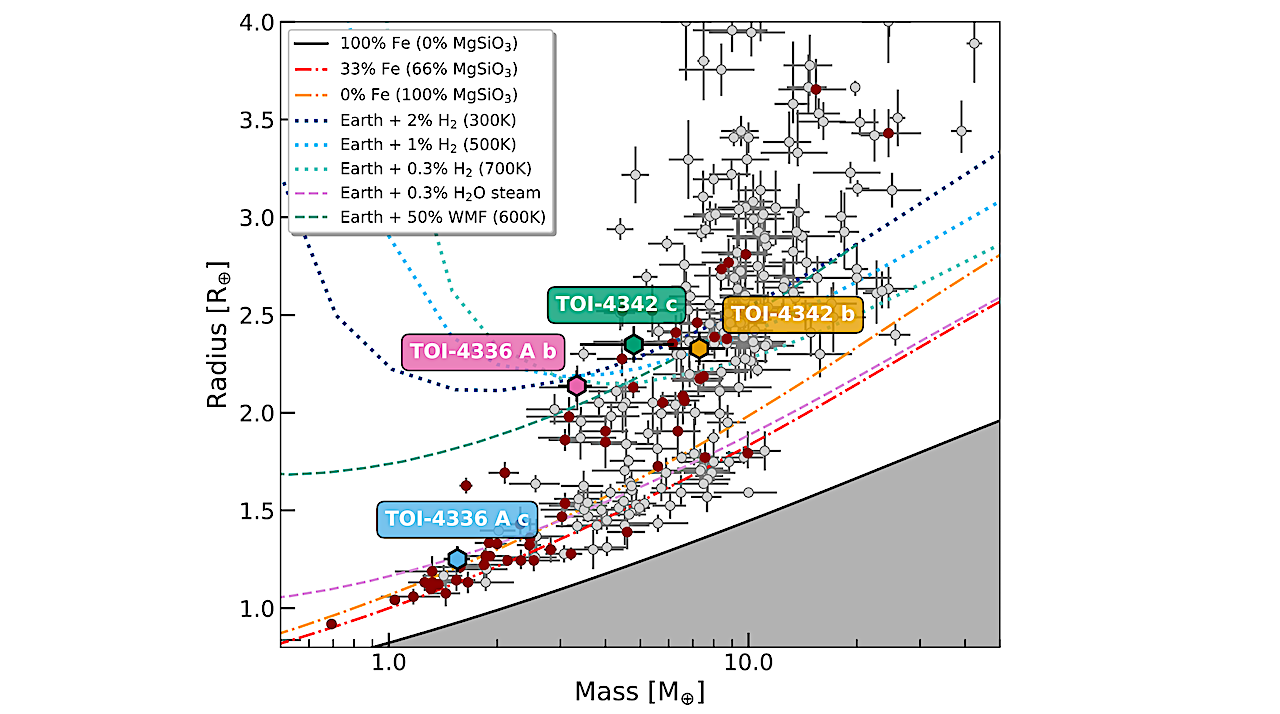
Mass-radius diagram of small exoplanets (with radii ranging from 1–4 R⊕) with precise densities from the PlanetS catalog. The red (gray) dots correspond to exoplanets orbiting M dwarfs (FGK dwarfs).

Mass-radius diagram of small exoplanets (with radii ranging from 1–4 R⊕) with precise densities from the PlanetS catalog. The red (gray) dots correspond to exoplanets orbiting M dwarfs (FGK dwarfs).

Keith Cowing Explorers Club Fellow, ex-NASA Space Station Payload manager/space biologist, Away Teams, Journalist, Lapsed climber, Synaesthete, Na’Vi-Jedi-Freman-Buddhist-mix, ASL, Devon Island and Everest Base Camp veteran, (he/him) 🖖🏻 Follow on
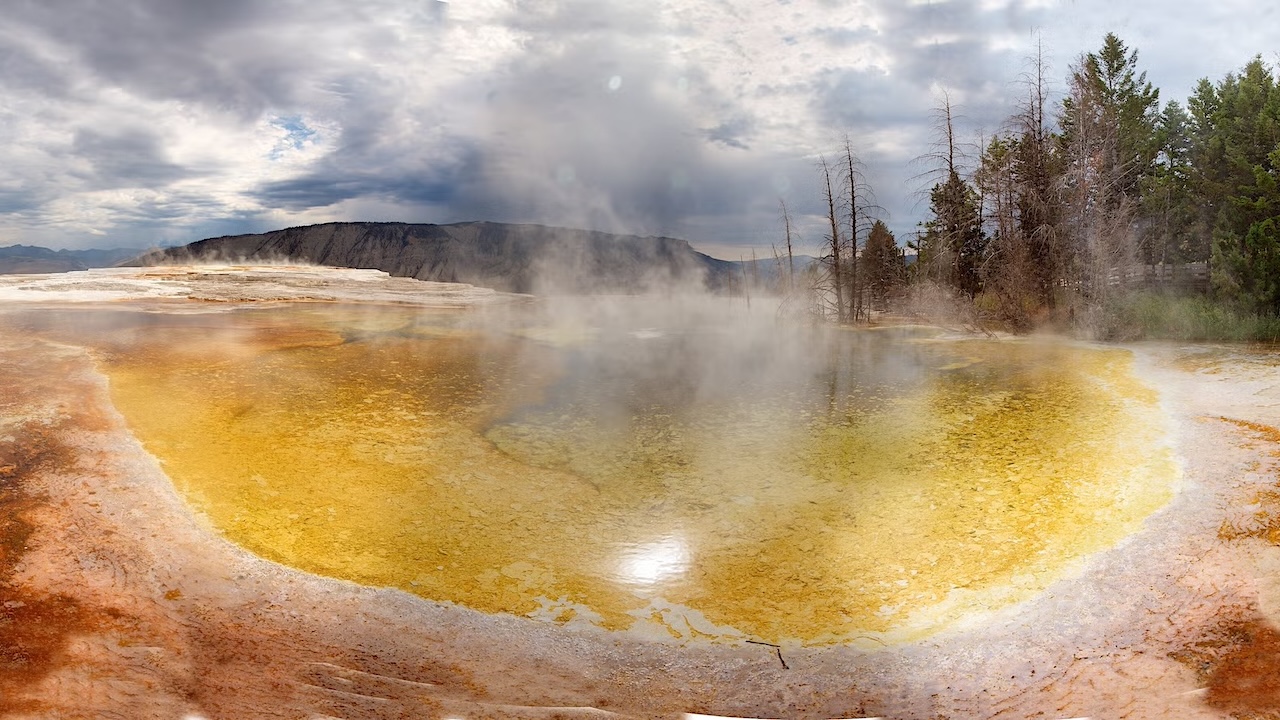
On Earth, life thrives in some of the most seemingly inhospitable environments. Single-celled organisms like bacteria teem in the hot springs of Yellowstone National Park, where temperatures reach nearly 200
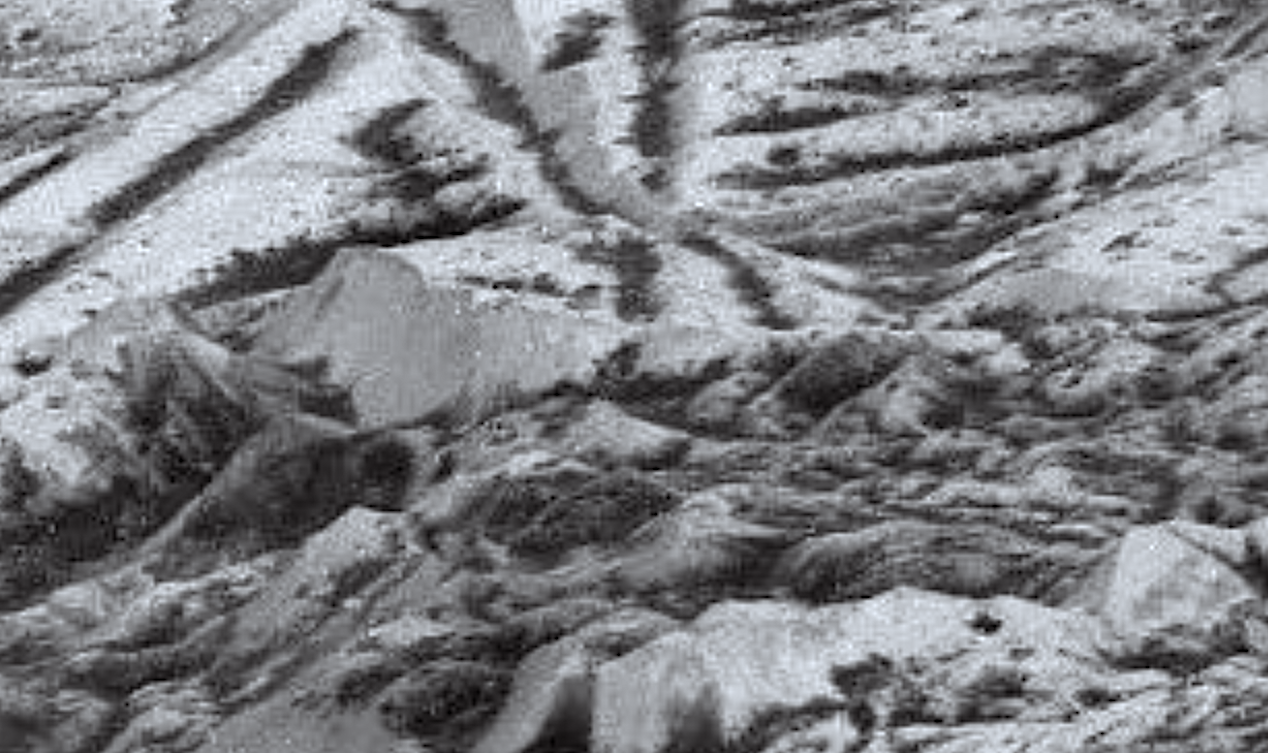
This image was taken near the closest approach point, at a range of 560 kilometers (335 miles) and is the highest resolution picture of Europa that will be obtained by
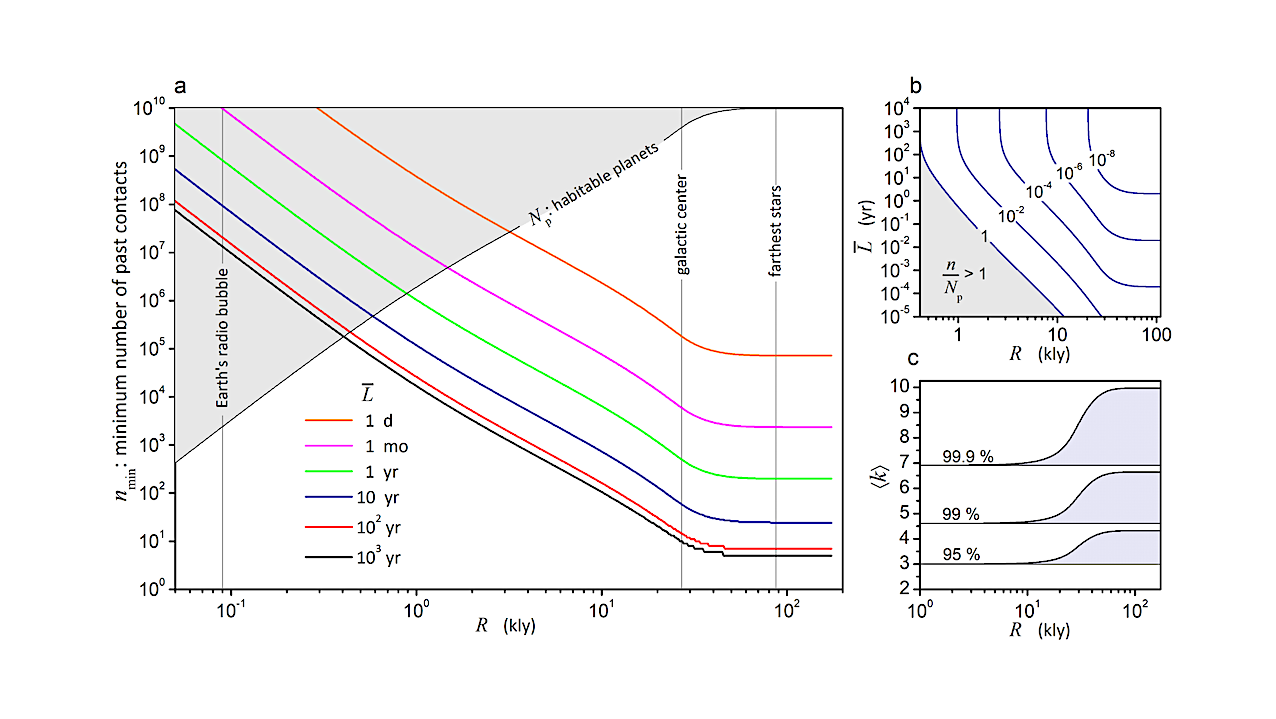
Results assuming undetected contacts with technoemissions over the past 65 yr. (a) Minimum number nmin of undetected past contacts required to achieve a present-day detectability of at least 95%, as
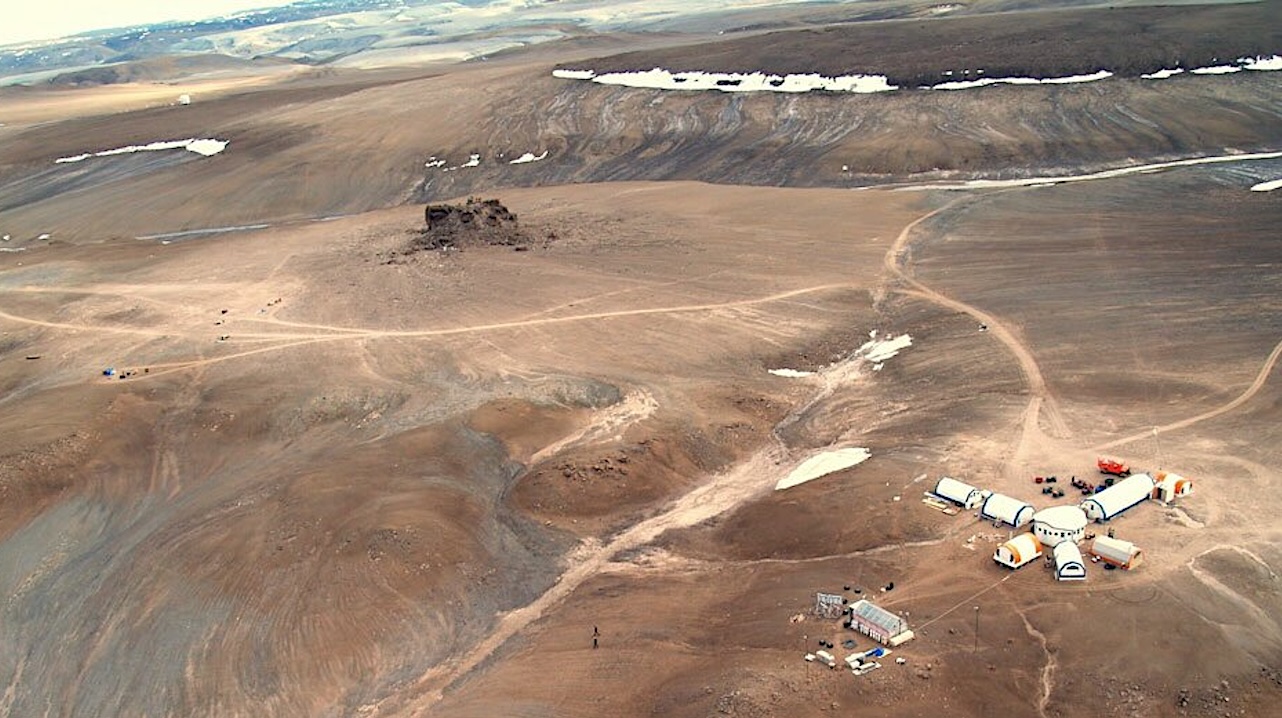
Haughton-Mars Project Base Camp – Haughton Crater, Nunavut, Canada — Mars Institute Analog environments are terrestrial environments that resemble extraterrestrial sites; this concept originated in space sciences for defining methods
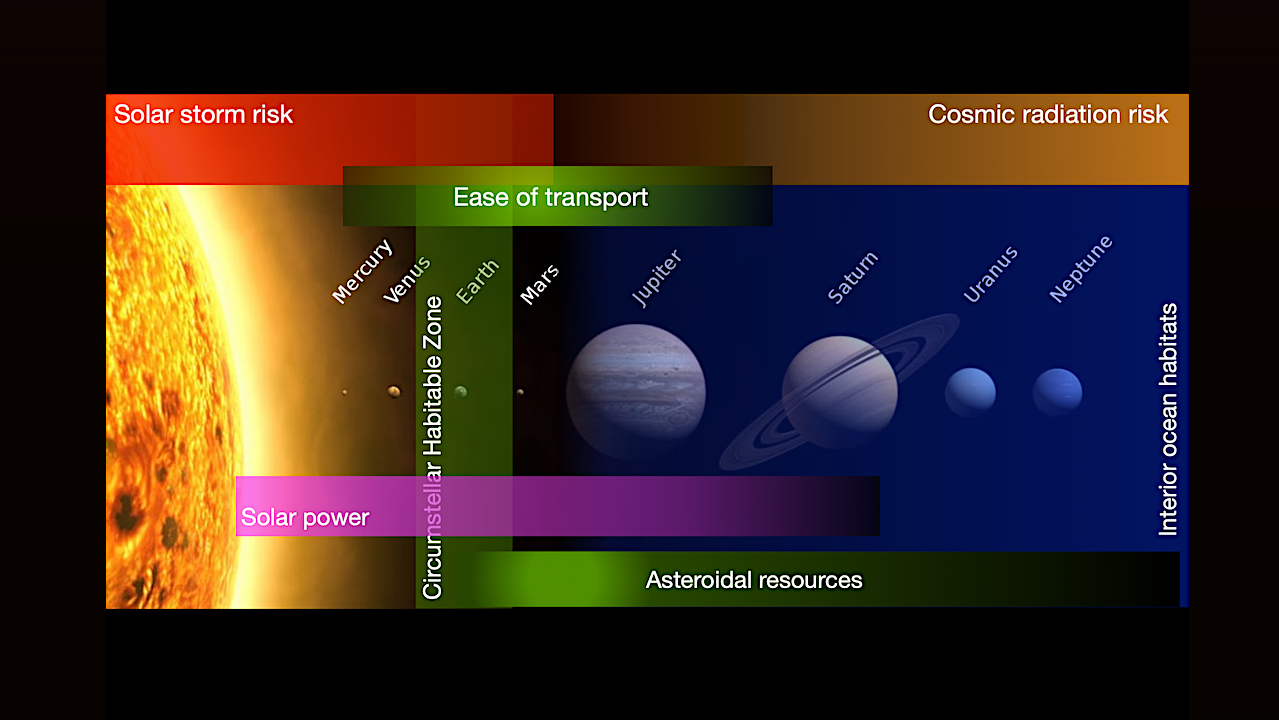
Illustration of some of the multi-modal factors that may contribute to an IHZ in our solar system, overlaid on traditional habitable zones: the circumstellar habitable zone and the zone where
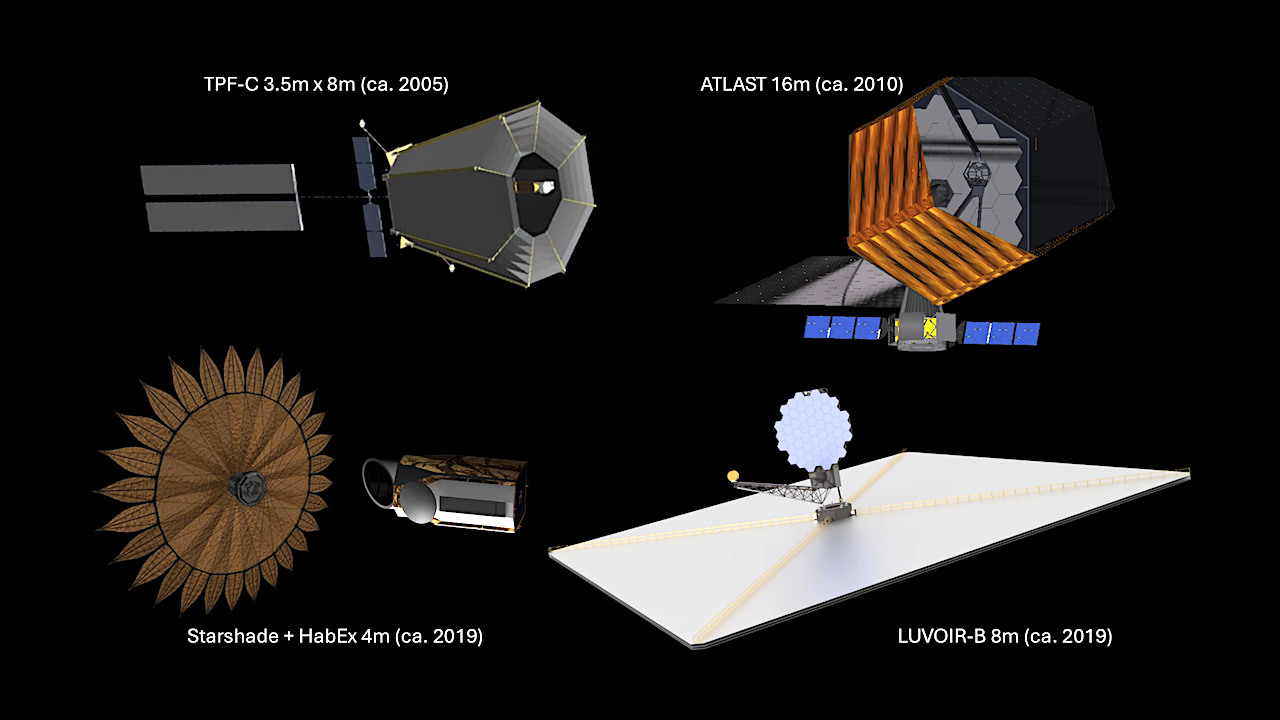
Concept drawings of four of the large-aperture direct imaging space telescopes envisioned and studied over the past 25 years. Note that the separation depicted here between the starshade and the
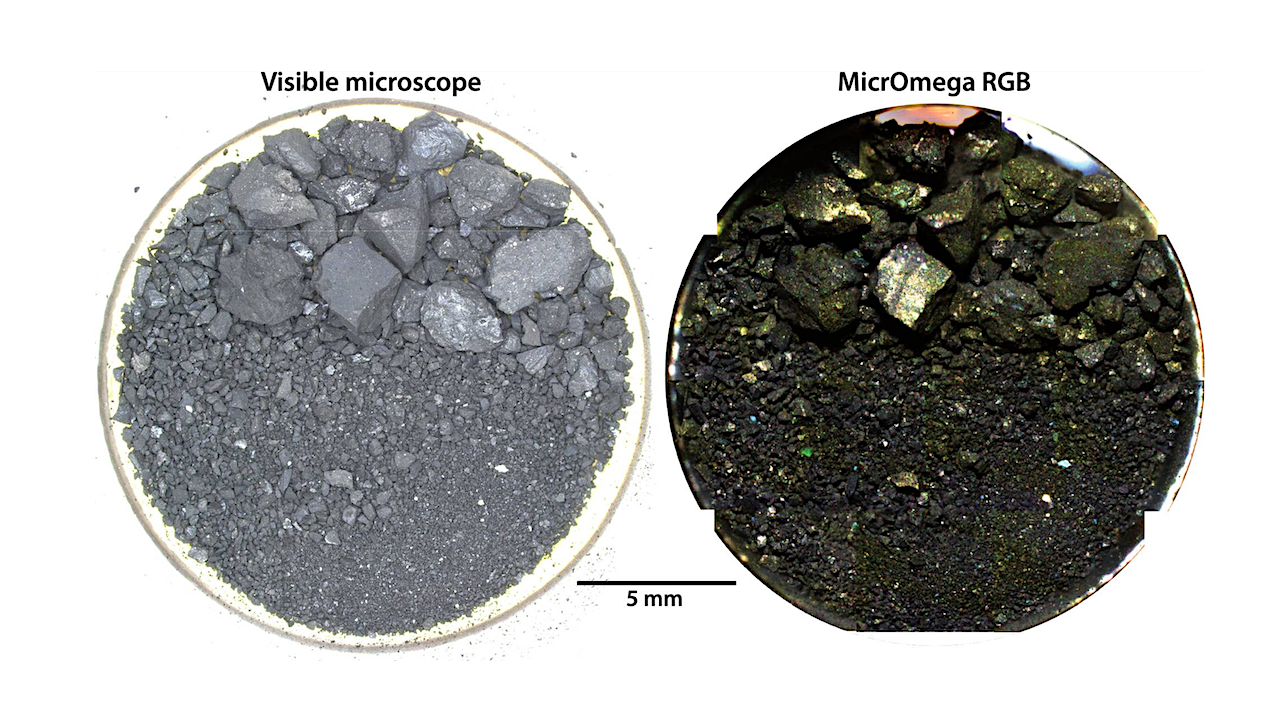
Bulk ORX-29000 observed by the Leica visible microscope and by the MicrOmega IR hyperspectral microscope (Mosaic of RGB composite images). The following wavelengths are used for the MicrOmega RGB image:
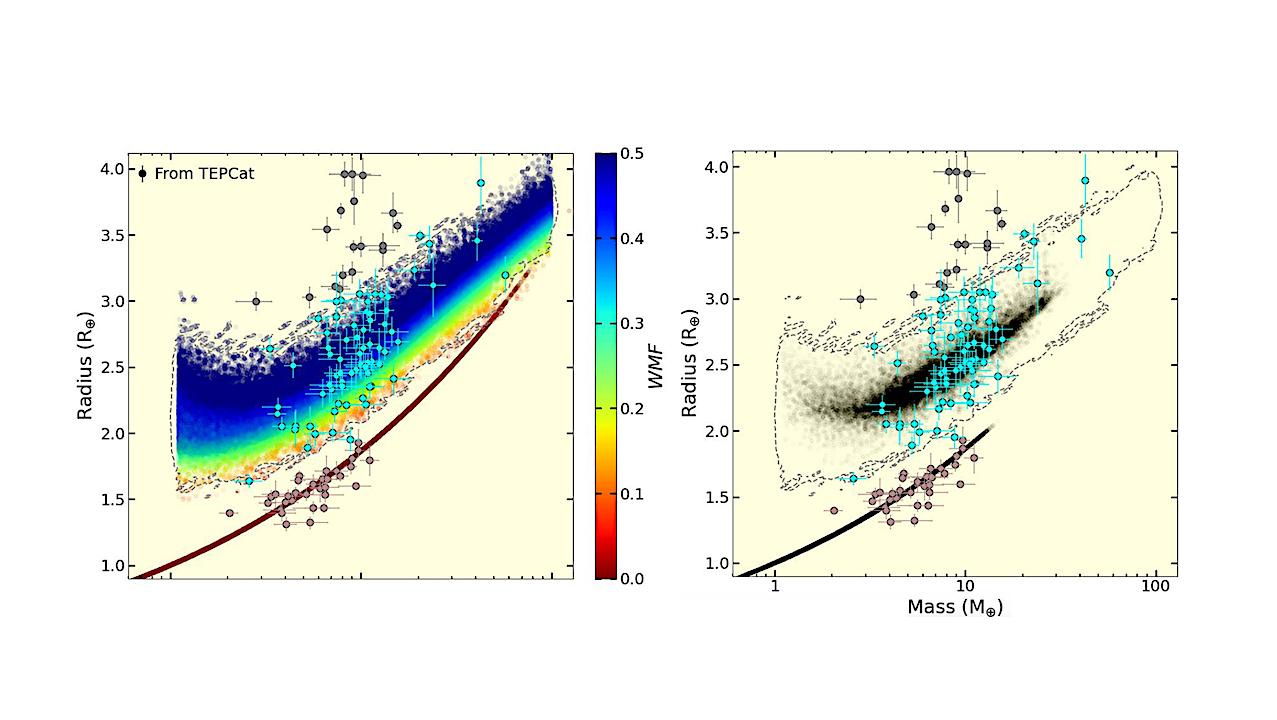
Mass–radius distribution of planets from Model I compared with the observed planets around G-type host stars from the TEPCat catalog Southworth (2011). Top: Weighted mass–radius distribution of simulated rocky planets