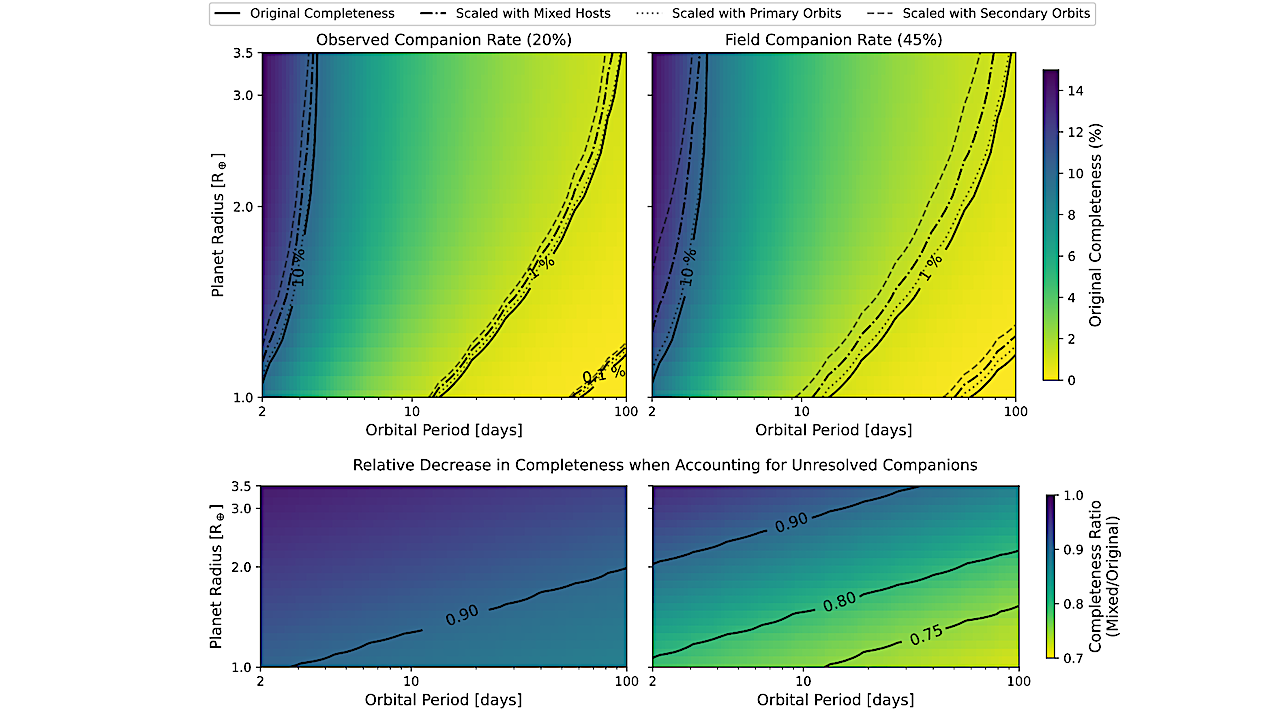
Modifications to the Kepler survey completeness for our sample, based on the simulated presence of stellar companions using left: the properties of our observed companion sample at their observed rate

Modifications to the Kepler survey completeness for our sample, based on the simulated presence of stellar companions using left: the properties of our observed companion sample at their observed rate
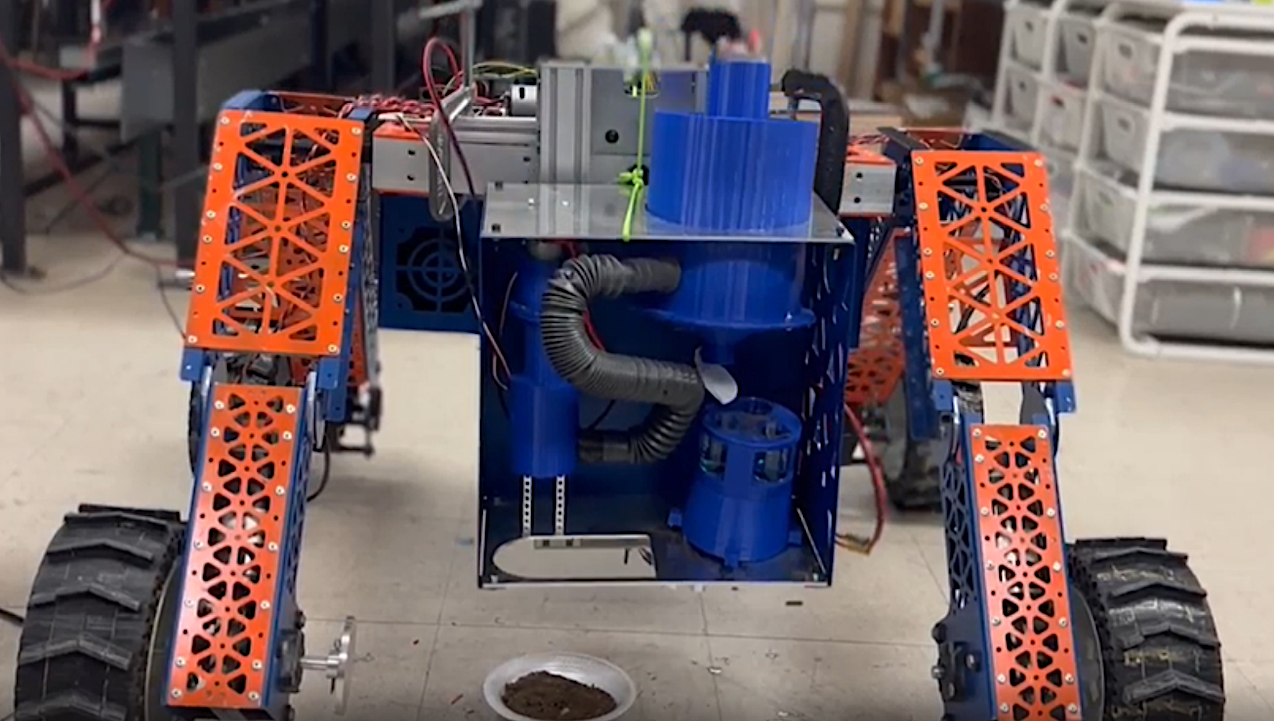
Proof of life module physical hardware on rover chassis– astro-ph.EP The search for extraterrestrial life has long been a primary focus of scientific exploration, driven by rapid advancements in technology
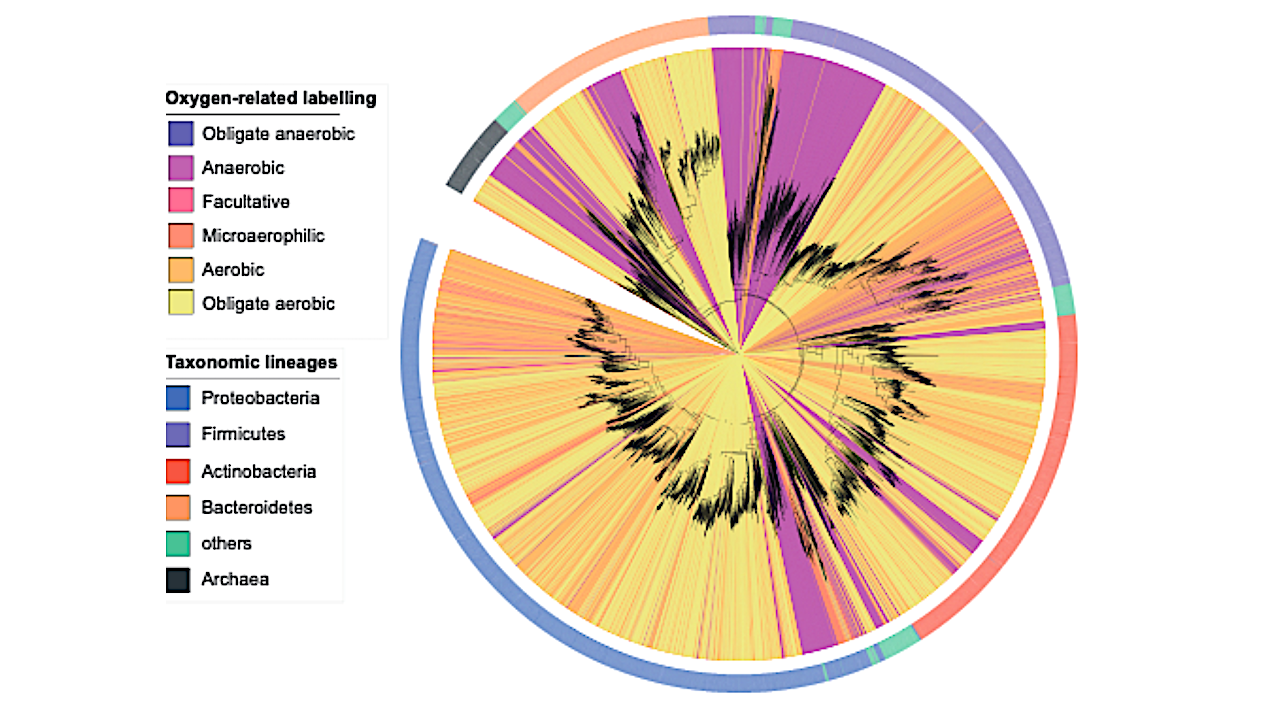
Noncanonical Genetic Markers Resolve The Pre-GOE Emergence Of Aerobic Bacteria In Earth’s History — PNAS via PubMed The transition from anaerobic to aerobic life was a pivotal adaptation in Earth’s
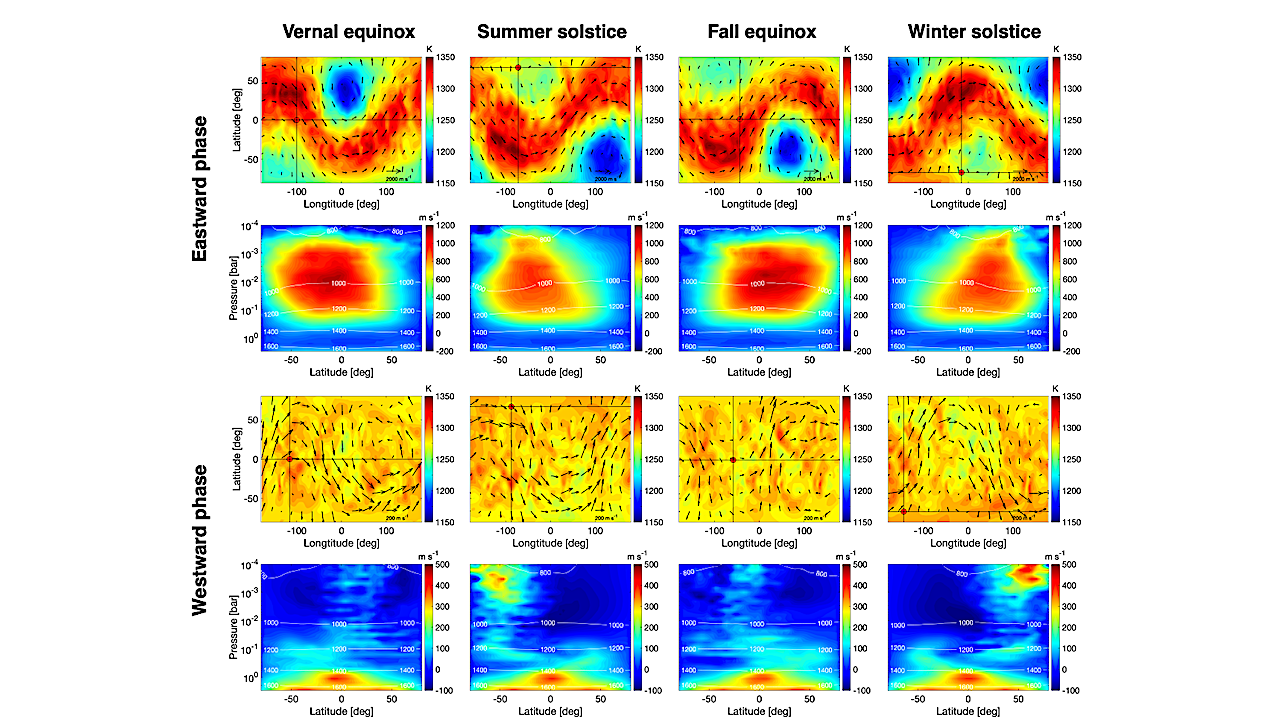
Seasonal variations of circulation patterns during the eastward phase (the top two rows) and the westward phase (the bottom two rows) under nonsynchronous rotation. Each row, from left to right,
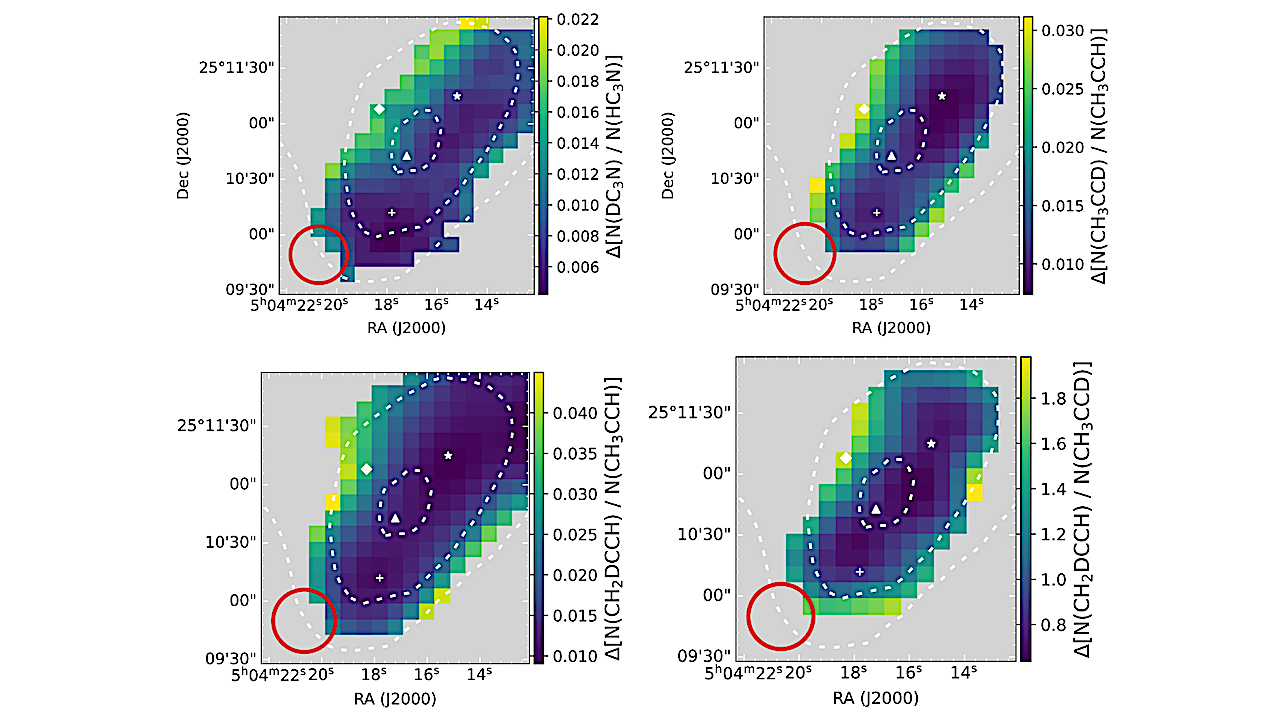
A.1: Error maps of the deuteration maps for HC3N and CH3CCH (presented in Figs. 8 and 9, respectively). Only pixels above the 3σ level of the respective integrated intensities are
ARKS continuum clean images of systems in the sample after correction and subtraction of any SMG. — in Astronomy & Astrophysics. Astronomers have, for the first time, captured a detailed
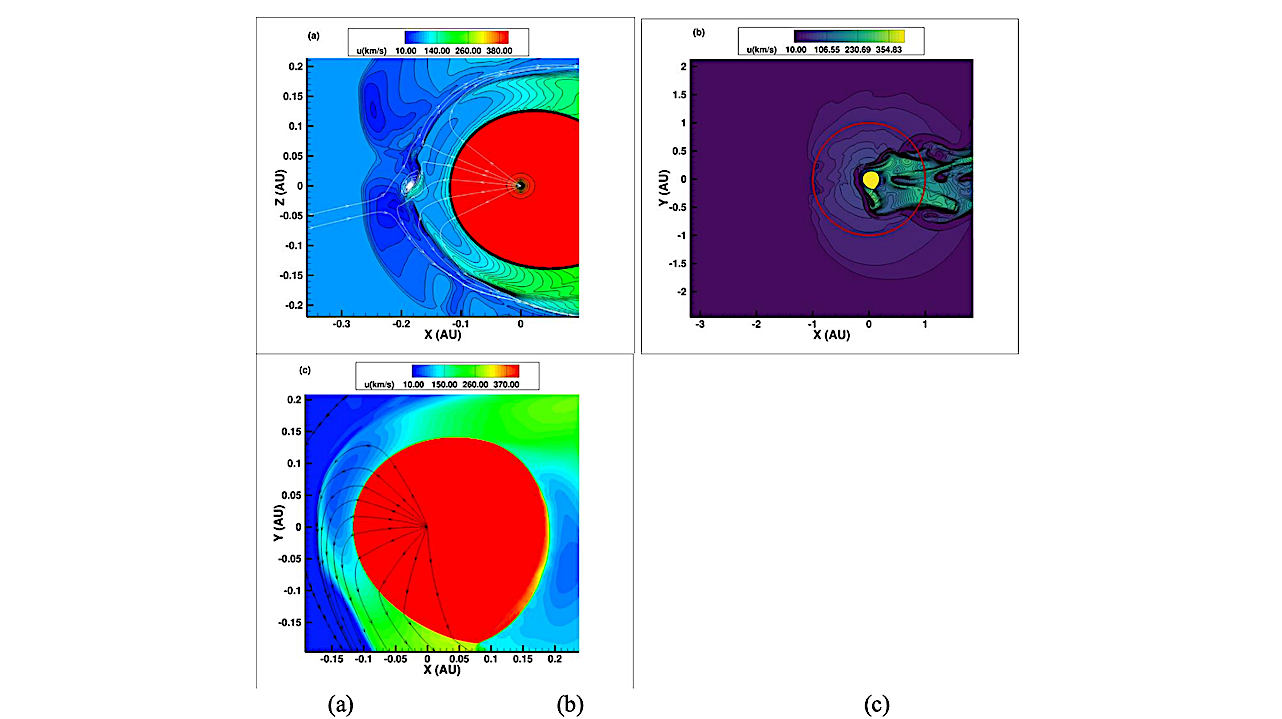
Heliosphere 2-3 Myr ago –speed. (a) meridional plane (b) equatorial plane showing the trajectory of Earth. When Earth will be inside the heliosphere the Galactic Cosmic Rays will be filtered
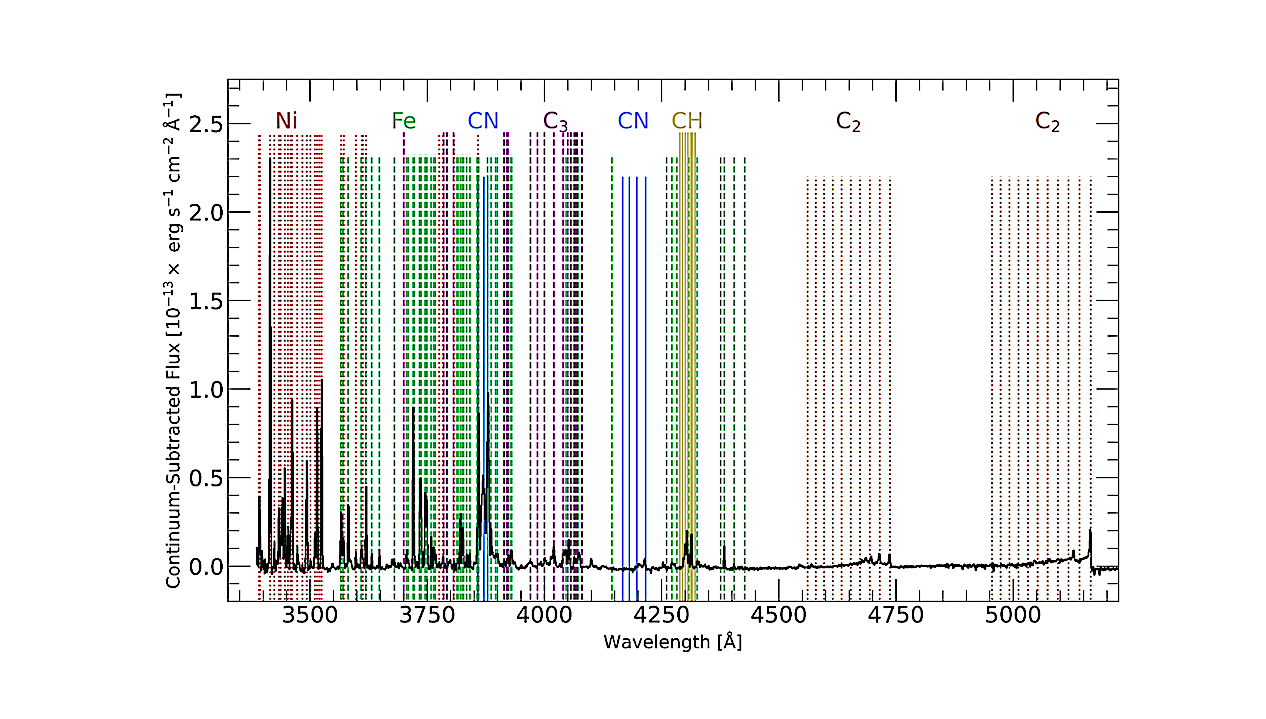
The continuum-subtracted KCWI spectrum of 3I/ATLAS between 3325 Å and 5225 Å, extracted from a 2” aperture centered on the comet. Cometary emission species are denoted as follows: Ni as
The abstract in PubMed or at the publisher’s site is linked when available and will open in a new window. Patel CM, Kim L, Reno K, Coulombe J, Vitaterna MH,
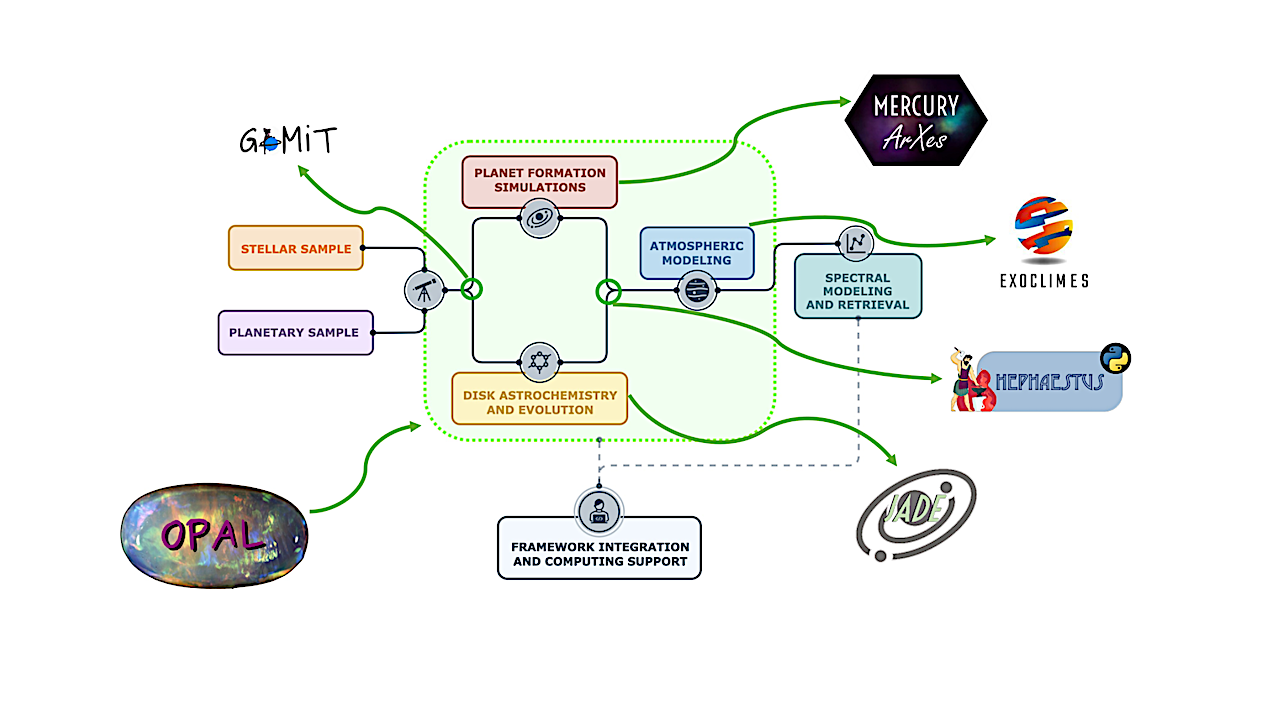
Infographic of the OPAL campaign simulations in the ambit of the Ariel mission Dry Run of 2025. The green box contains the codes presented in this paper that make up