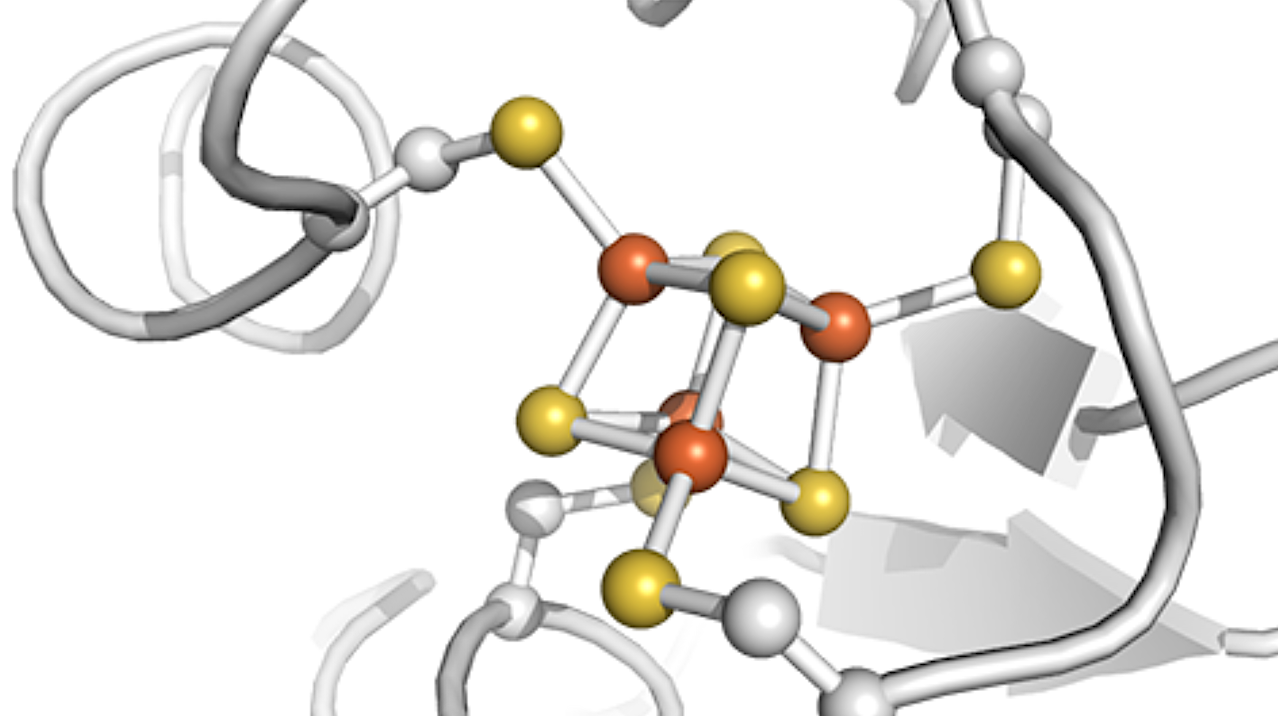
A bacterial ferredoxin FeS cluster — Ferredoxin is a type of protein found across biology with a key role in the movement of electrons. In this figure iron is shown

A bacterial ferredoxin FeS cluster — Ferredoxin is a type of protein found across biology with a key role in the movement of electrons. In this figure iron is shown
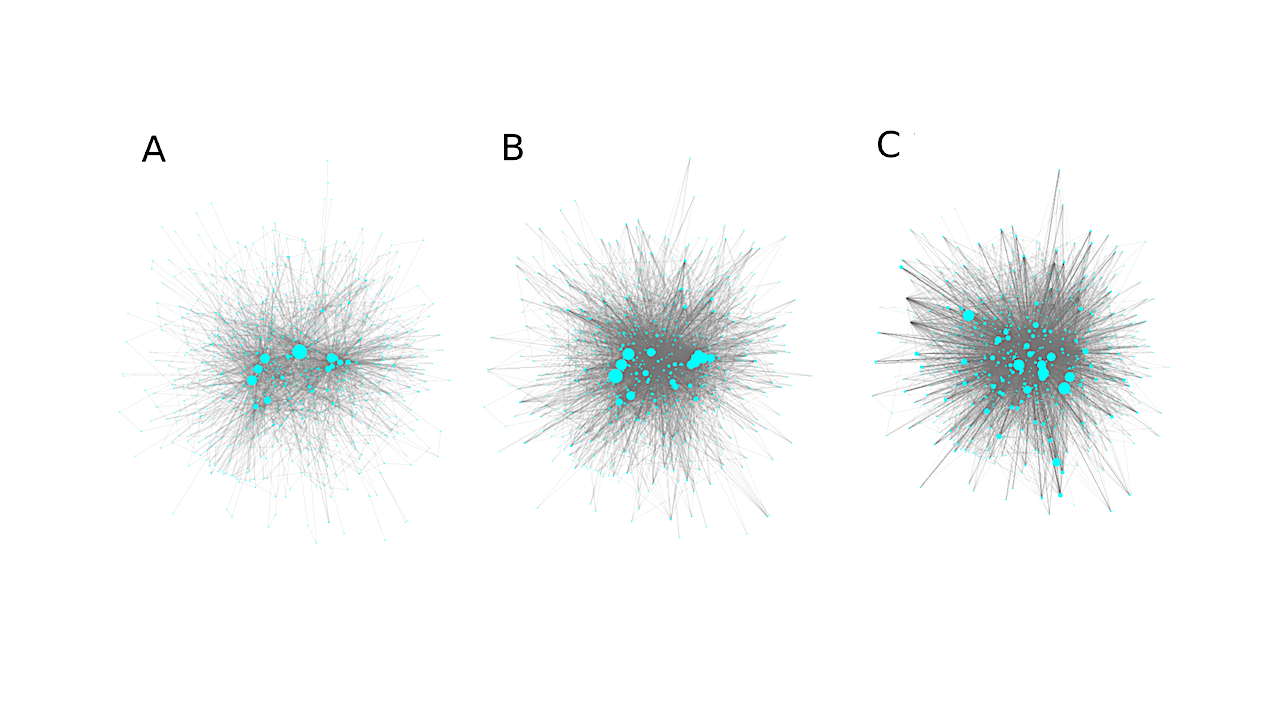
Examples of metabolic networks (gray nodes and edges) and seed sets (blue circles). A. Metabolic network and seed set of the bacterium Candidatus Desulforudis audaxviator which forms a single-species ecosystem
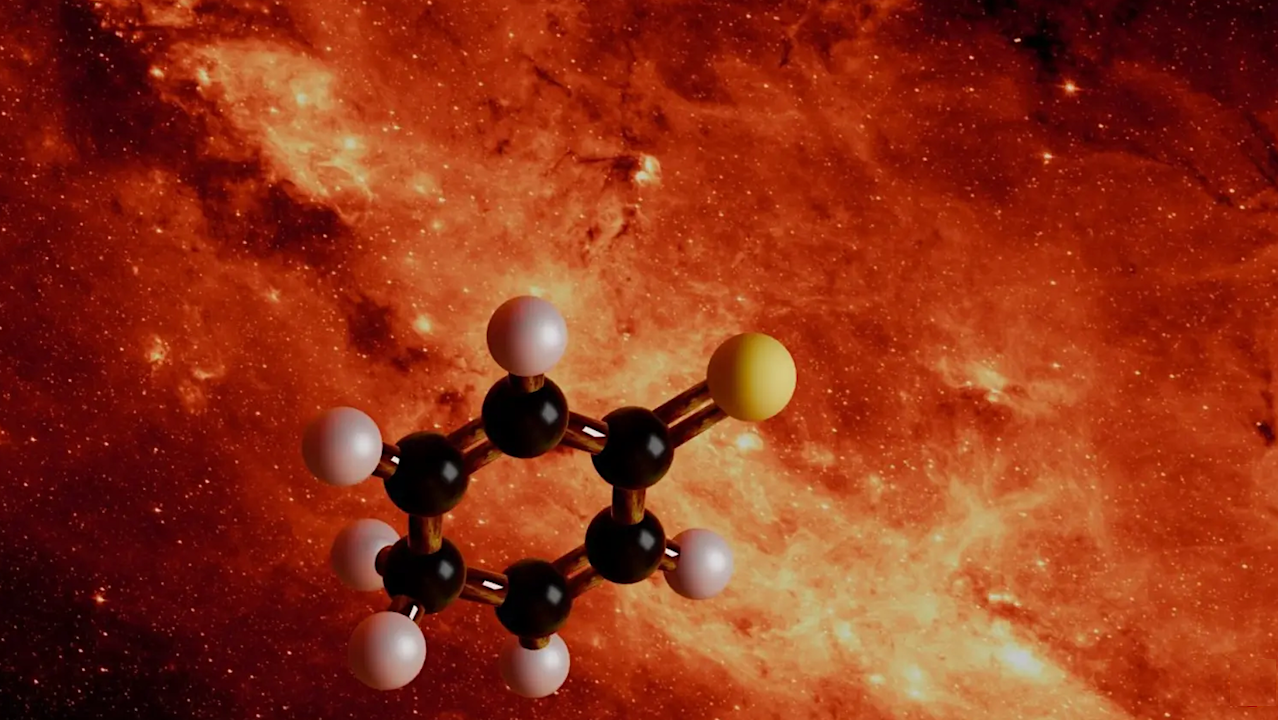
In the heart of our Galaxy, scientists discovered the first sulfur-bearing six-membered ring molecule hiding in an interstellar cloud. © MPE/ NASA/JPL-Caltech Researchers at the Max Planck Institute for Extraterrestrial
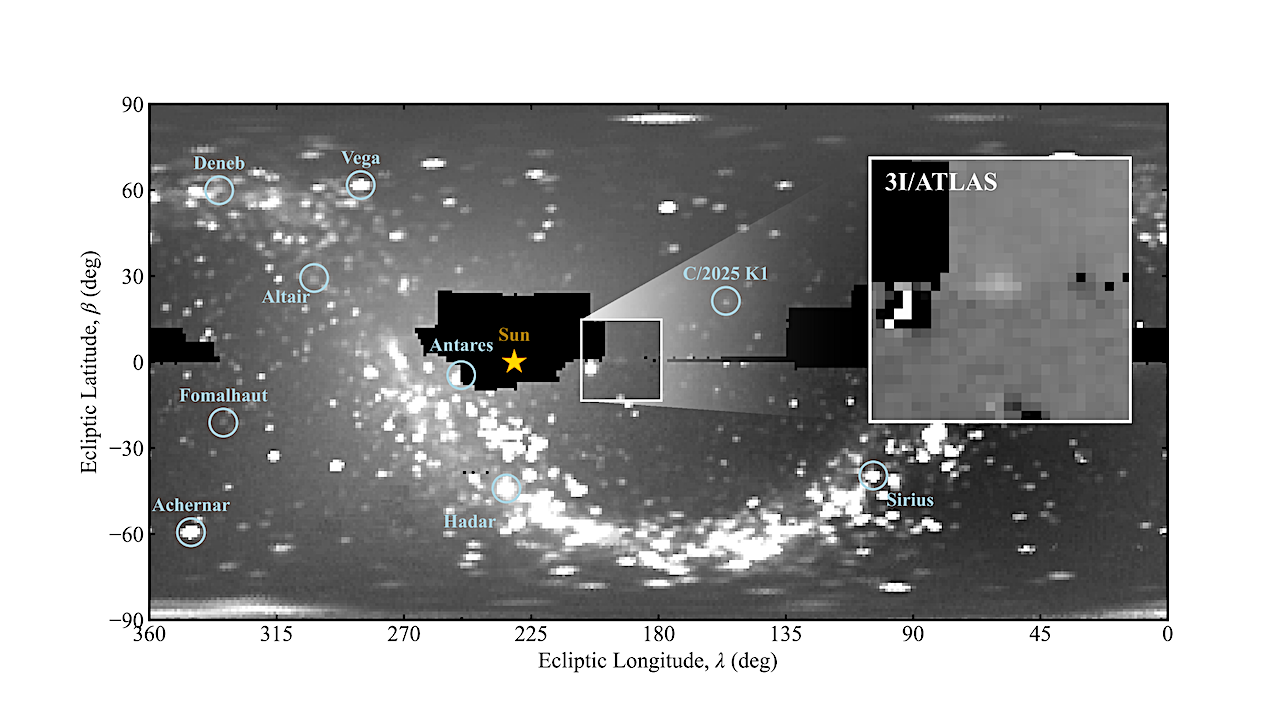
Representative SWAN full-sky Lyman-α map (2025 Nov 13), showing the simultaneous detection of comet C/2025 K1 (ATLAS) and numerous UV-bright stars. The zoomed inset displays the differential image centered on

This artist’s impression shows the star TRAPPIST-1 with two planets transiting across it. ExoMiner++, a recently updated open-source software package developed by NASA, uses artificial intelligence to help find new
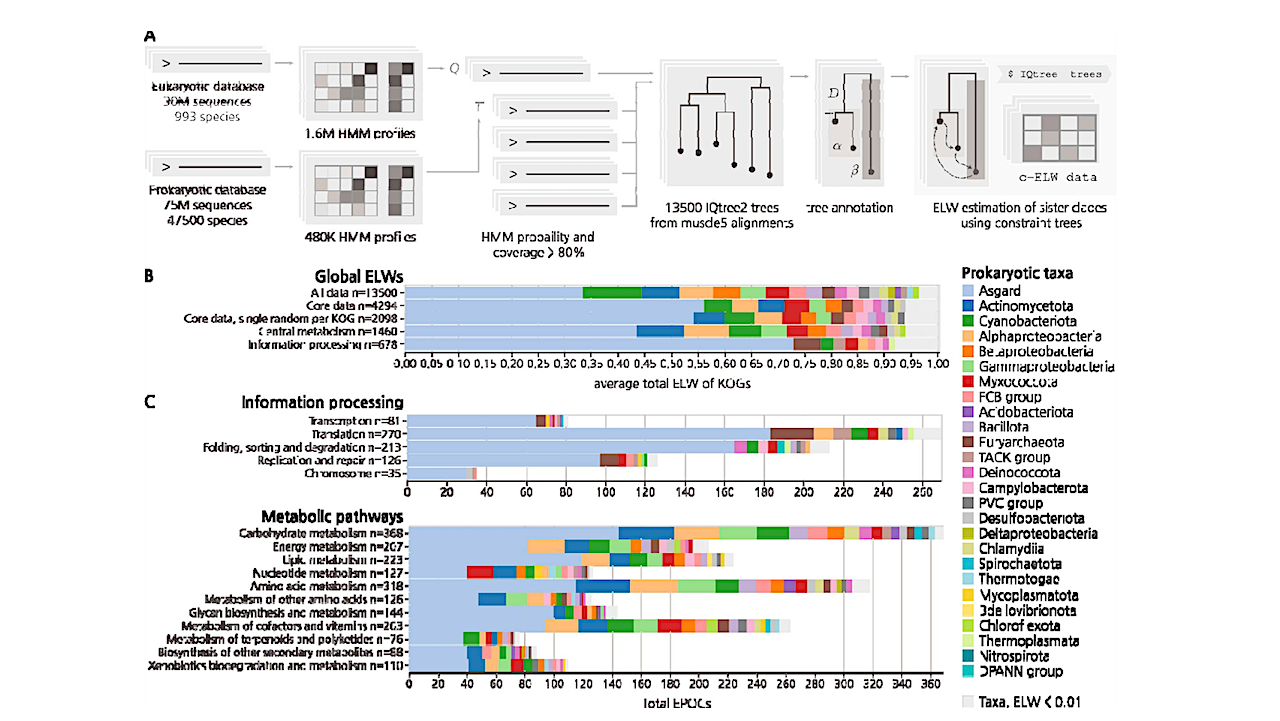
A) Simplified EPOC generation and processing pipeline. From left to right, one eukaryotic and one prokaryotic sequence database transformed into HMMs. The query of eukaryotic against prokaryotic HMMs generated 13,500
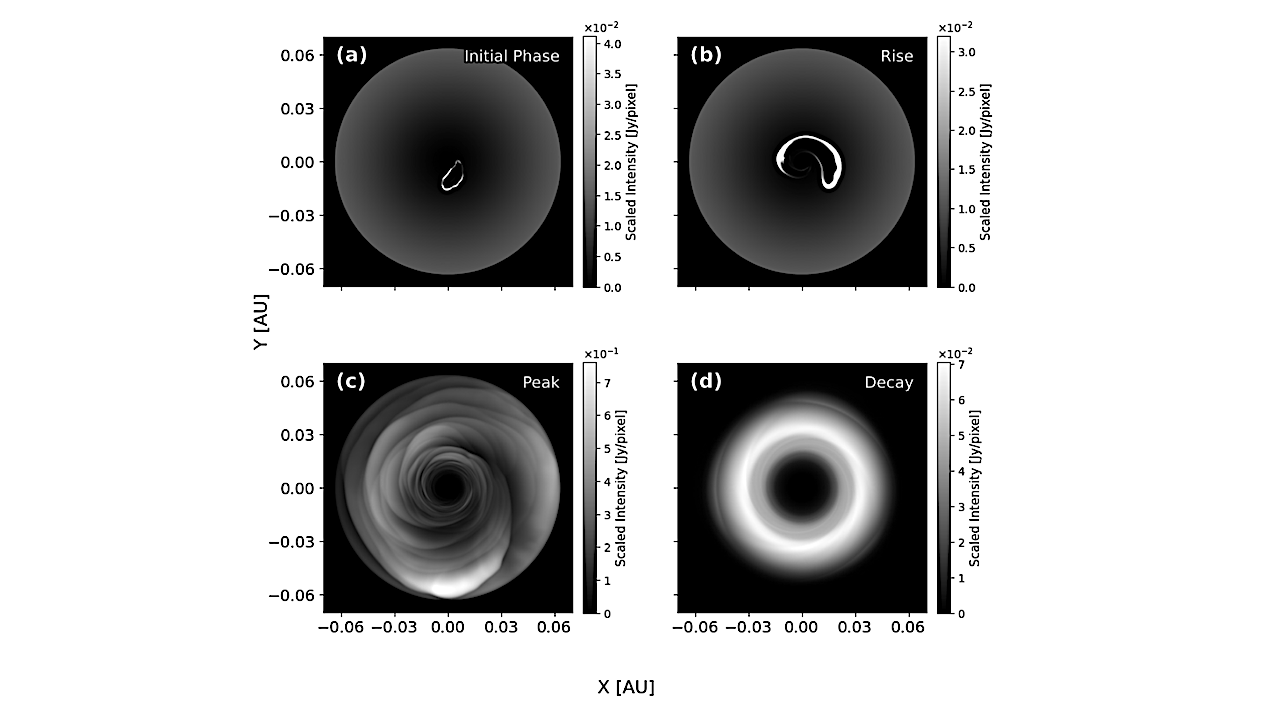
Synthetic imaging of the fiducial Jupiter TDE at λ = 1.0 µm observed from d = 140 pc. The four panels show the morphological evolution from the initial compact debris
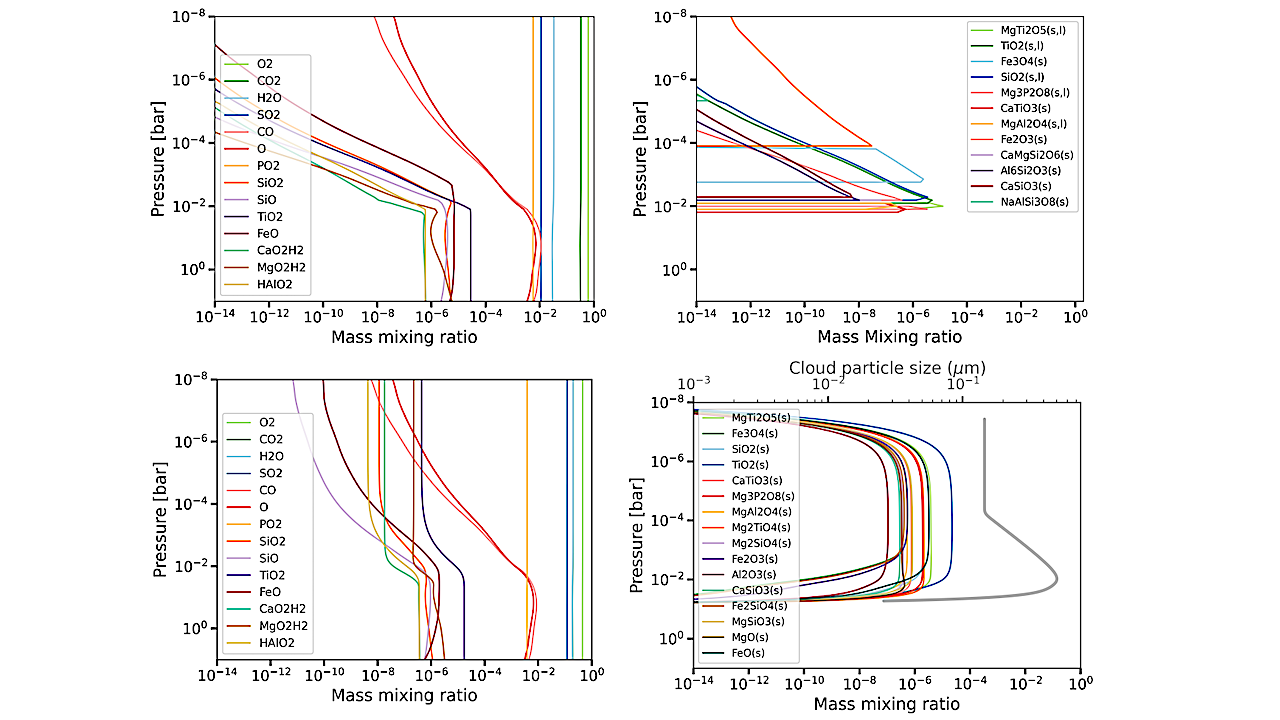
Mass mixing ratios and condensate/cloud of the O2/CO2 atmosphere – model 5. The 15 major gas phase species are shown in the left hand side column and the solid and

NASA ROSES-2026 — Astrobiology.com Historically the new omnibus ROSES solicitation was released in February but proposals to the programs from the prior year’s ROSES that were rolling submissions (no due
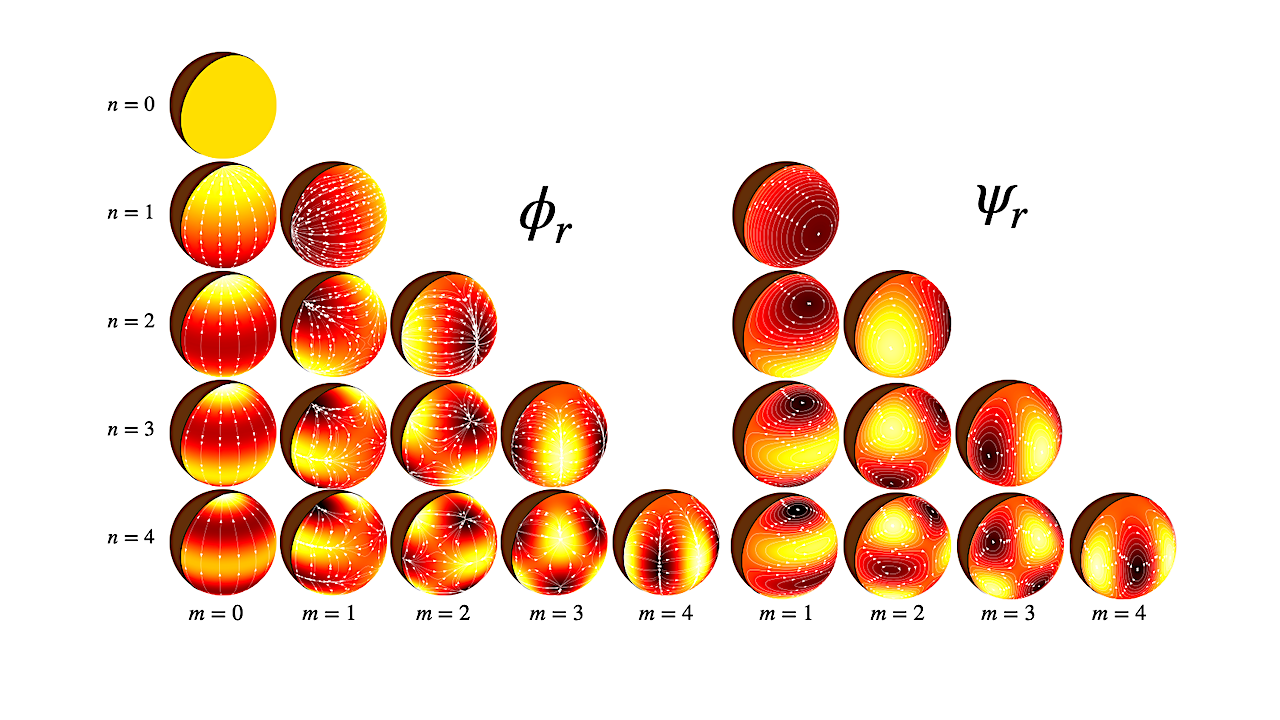
Eigenfunctions describing tidal lava flows on a hemispherical dayside magma ocean. The nightside is masked in brown. Left half shows the scalar potential functions ϕr, computed by taking the real