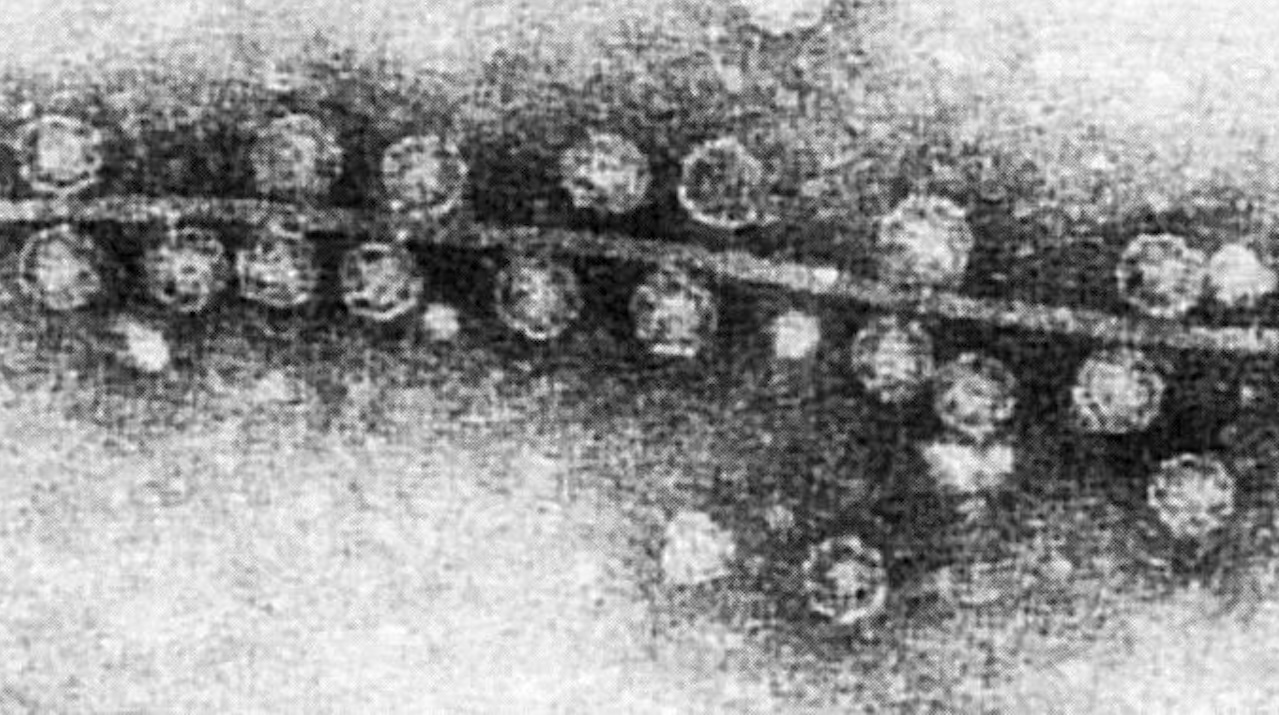
Transmission electron micrograph of the bacteriophage Qβ attached to sex pilus of the bacterium Escherichia coli — Wikpedia Introduction Microgravity is a critical environmental factor in space that can alter

Transmission electron micrograph of the bacteriophage Qβ attached to sex pilus of the bacterium Escherichia coli — Wikpedia Introduction Microgravity is a critical environmental factor in space that can alter
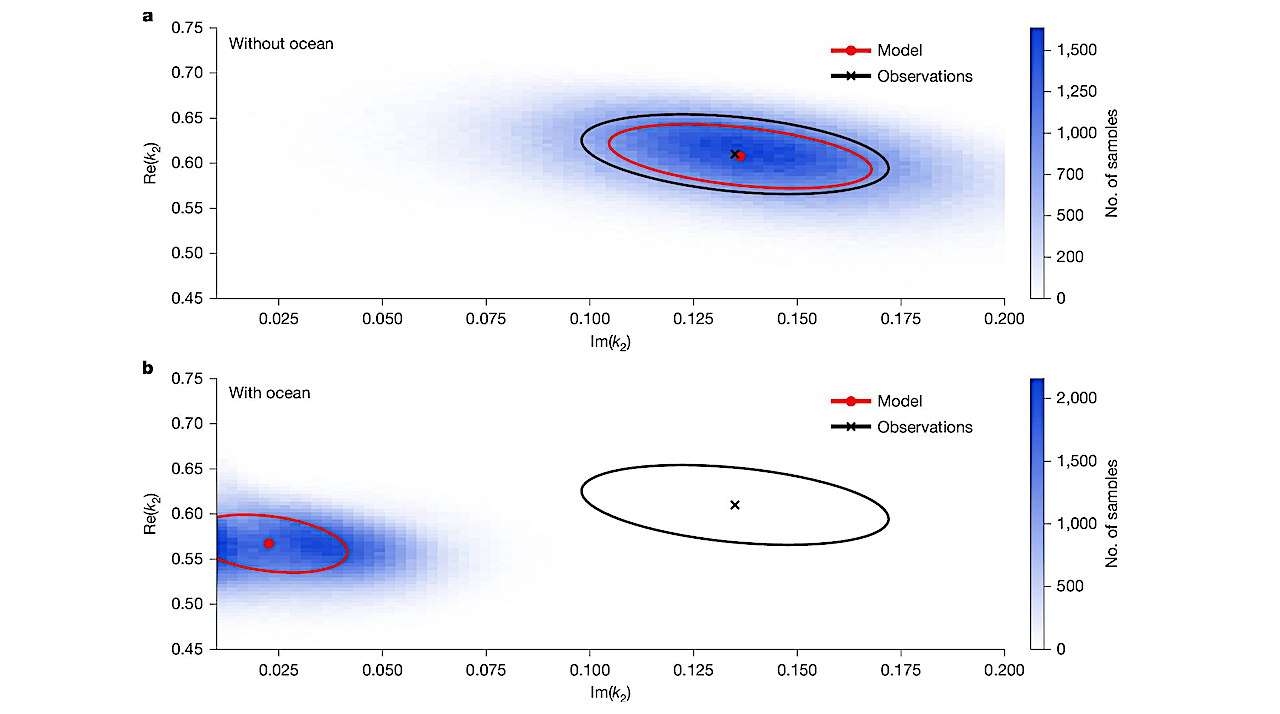
Histograms and uncertainty ellipse (red) for computed Re(k2) and Im(k2) compared with the observed uncertainty ellipse (black) for the interior models of Titan without (a) and with (b) an ocean.

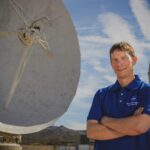
Stephen Scheidt and Zach Morse of NASA’s Goddard Instrument Field Team photograph the inside of a cave in ultraviolet light, Hawaii, September 2022. NASA/Caela Barry Editor’s note: This story is
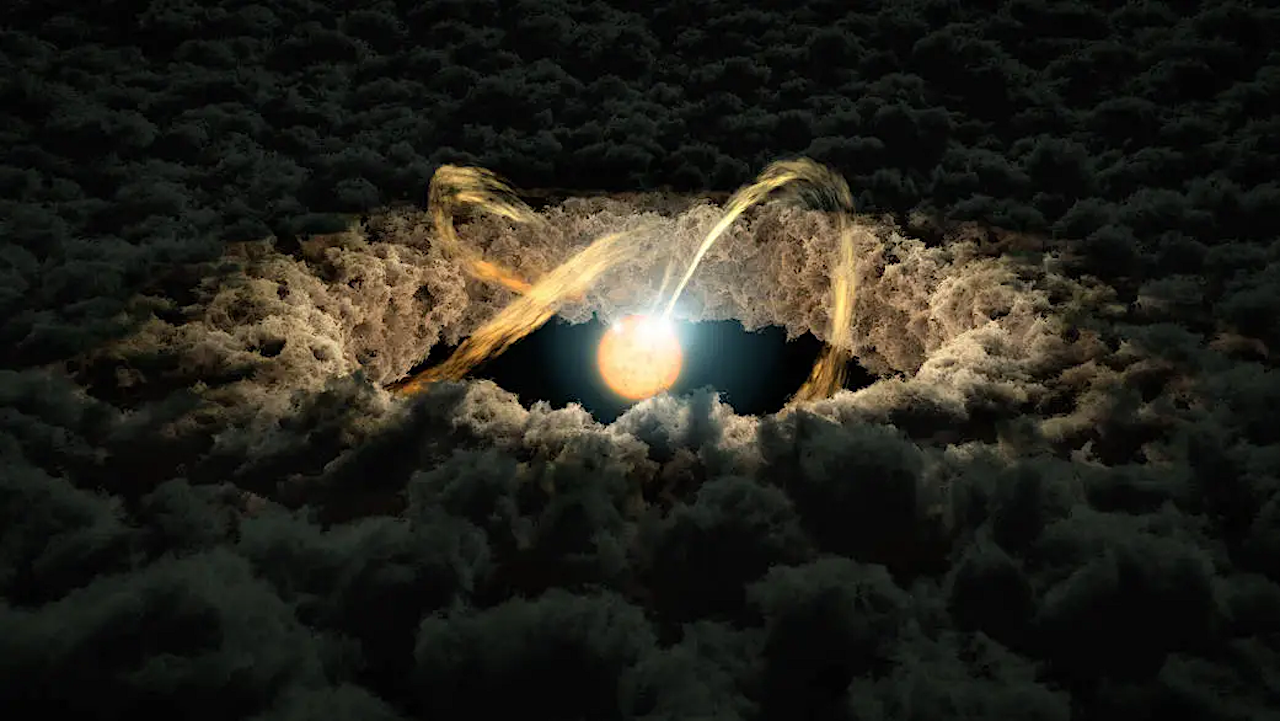
This illustration shows a star surrounded by a protoplanetary disk. A new study uses data from NASA’s Spitzer Space Telescope and four ground-based telescopes to determine the distance from a
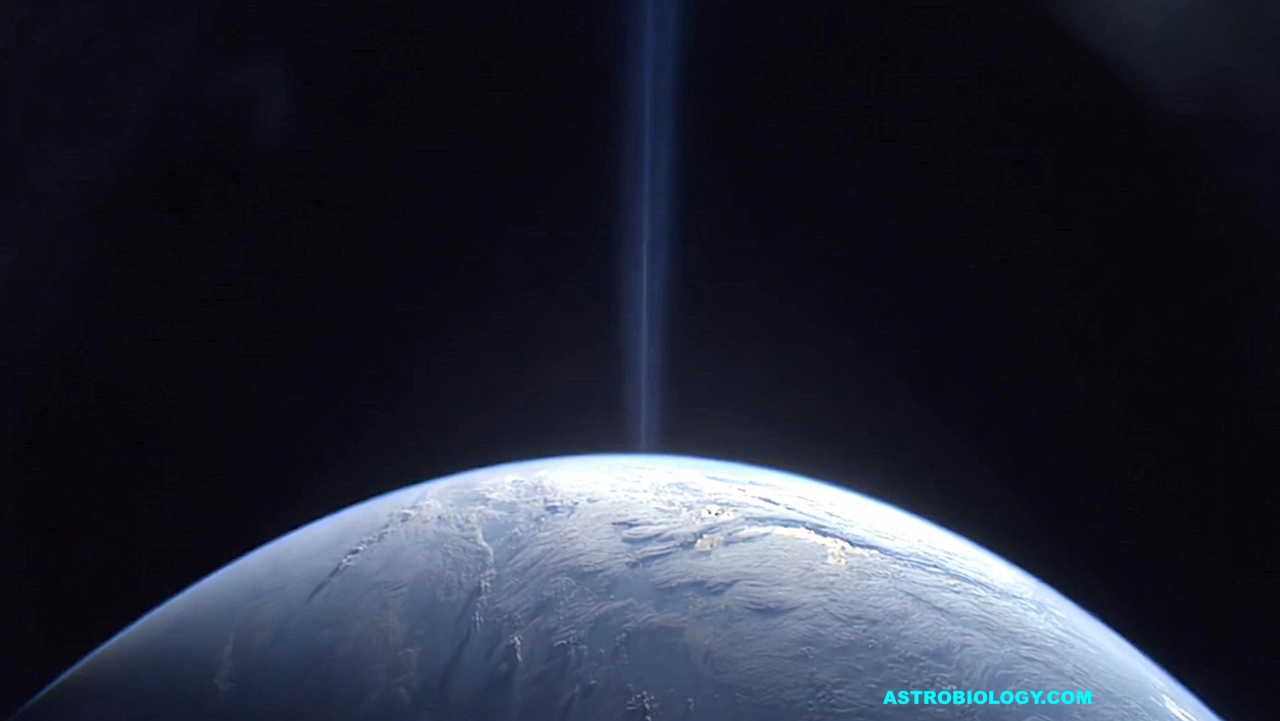
Optical SETI – Grok via Astrobiology.com The searches for other life and for intelligence are fundamental problems that science faces today. Most searches so far have been focused on radio,
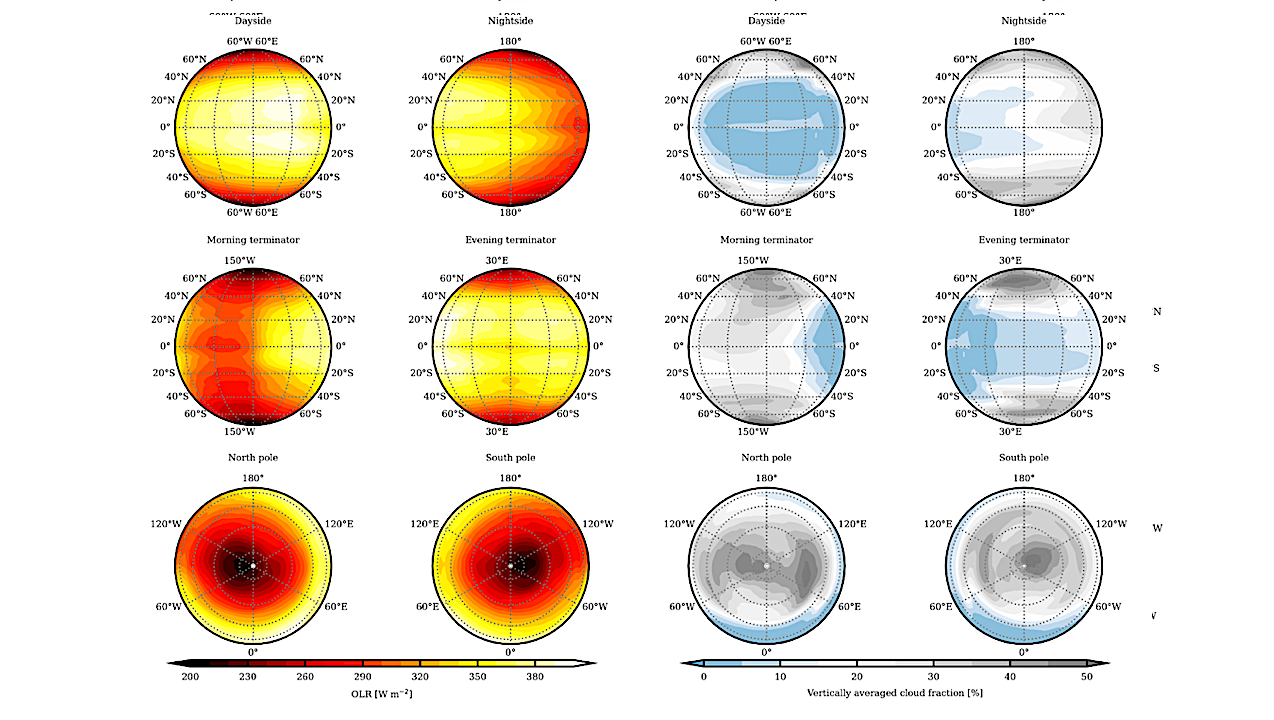
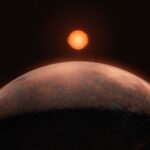
Outgoing longwave radiation of six potentially visible hemispheres of the planet. Teegarden’s Star is one of the most promising targets for the first observations of LIFE, as a non-transiting
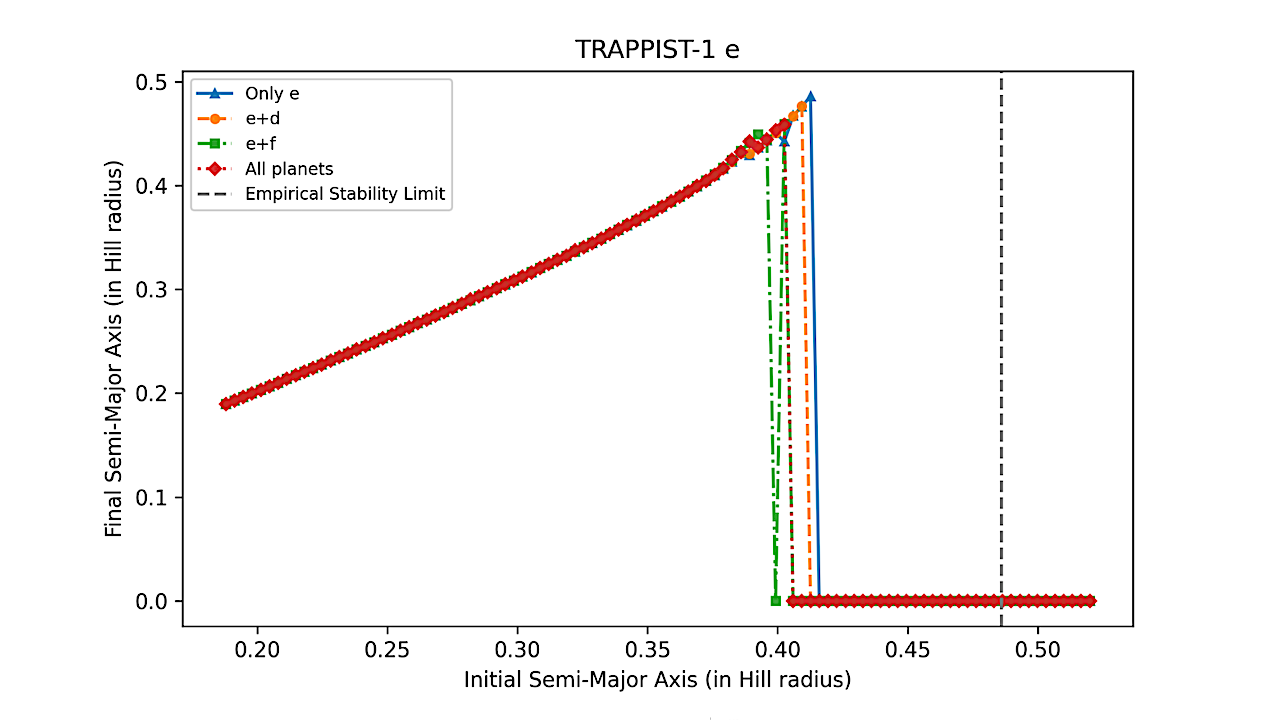
Final semi-major axes of satellites versus their initial orbital distance (in Hill radii) for TRAPPIST-1 e. — astro-ph.EP We investigate the dynamical stability of potential satellites orbiting the seven planets
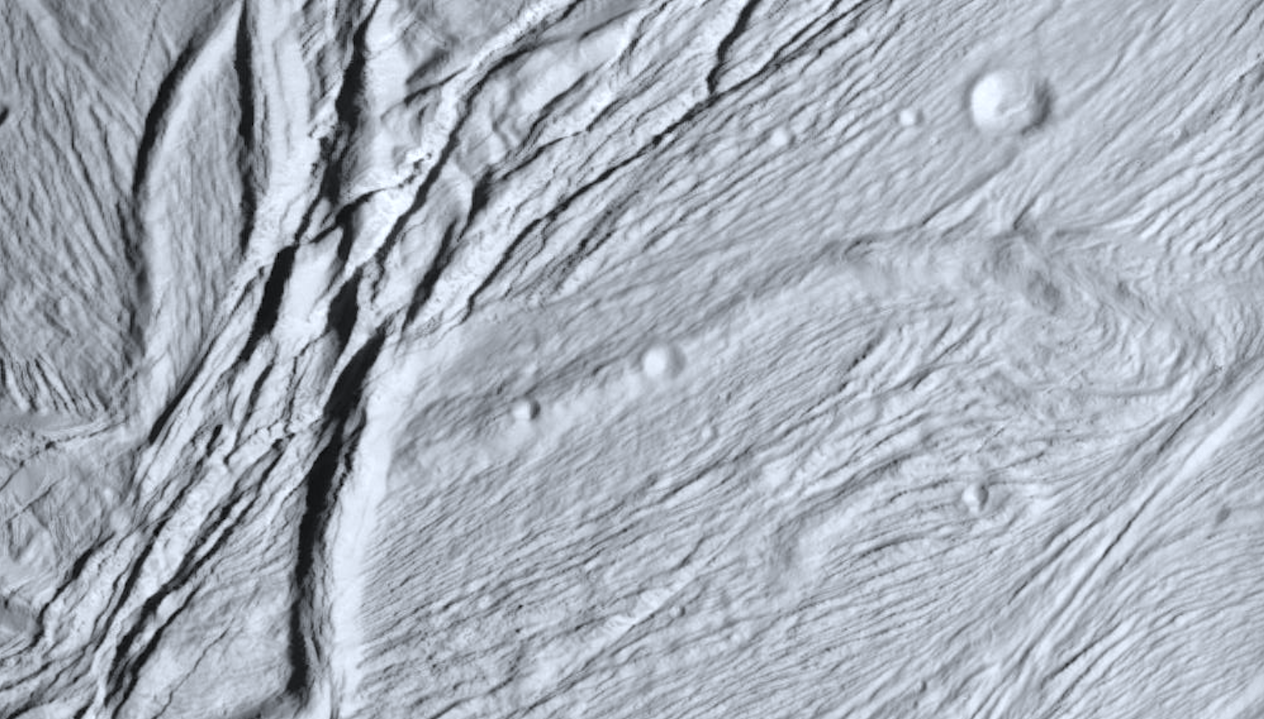
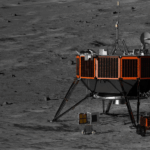
Cassini Views Enceladus Up-Close — NASA source Saturn’s ice-covered moon Enceladus may host a subsurface ocean with biologically relevant chemistry. Plumes released from this ocean preserve information on its chemical
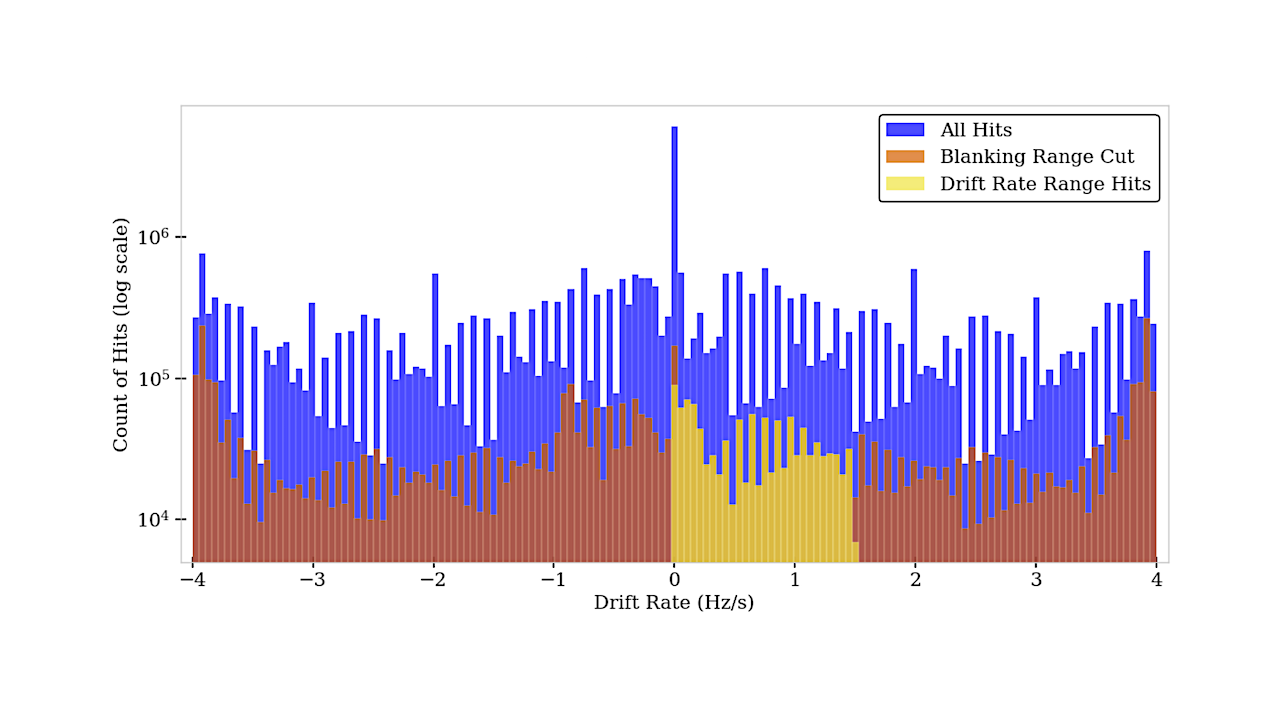
The distribution of the ∼ 74 million hits from this survey across drift rate. Note the peak of hits around 0 Hz/s (expected because most RFI transmitters are in the

The abstract in PubMed or at the publisher’s site is linked when available and will open in a new window. In case you missed it: A Science Strategy for the