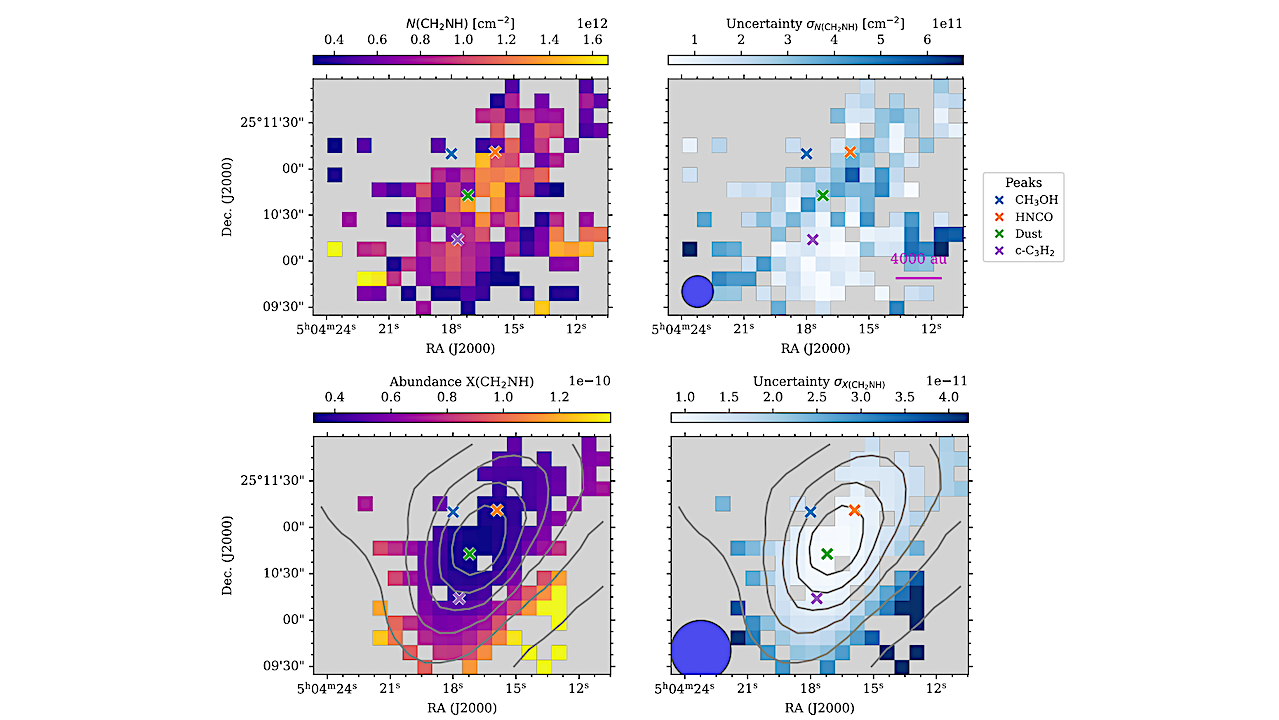
Upper panels: The column density N(CH2NH) and column density uncertainty map of L1544 assuming Tex = 10 K. Lower panels: The CH2NH abundance map and abundance uncertainty map, calculated with

Upper panels: The column density N(CH2NH) and column density uncertainty map of L1544 assuming Tex = 10 K. Lower panels: The CH2NH abundance map and abundance uncertainty map, calculated with
Inouye Solar Telescope image of a solar flare on August 8, 2024. (Image credit: NSF/NSO/AURA, CC-BY) Stellar magnetic activity, manifested through spots (faculae and flares), fundamentally shapes the exoplanets’ environments.
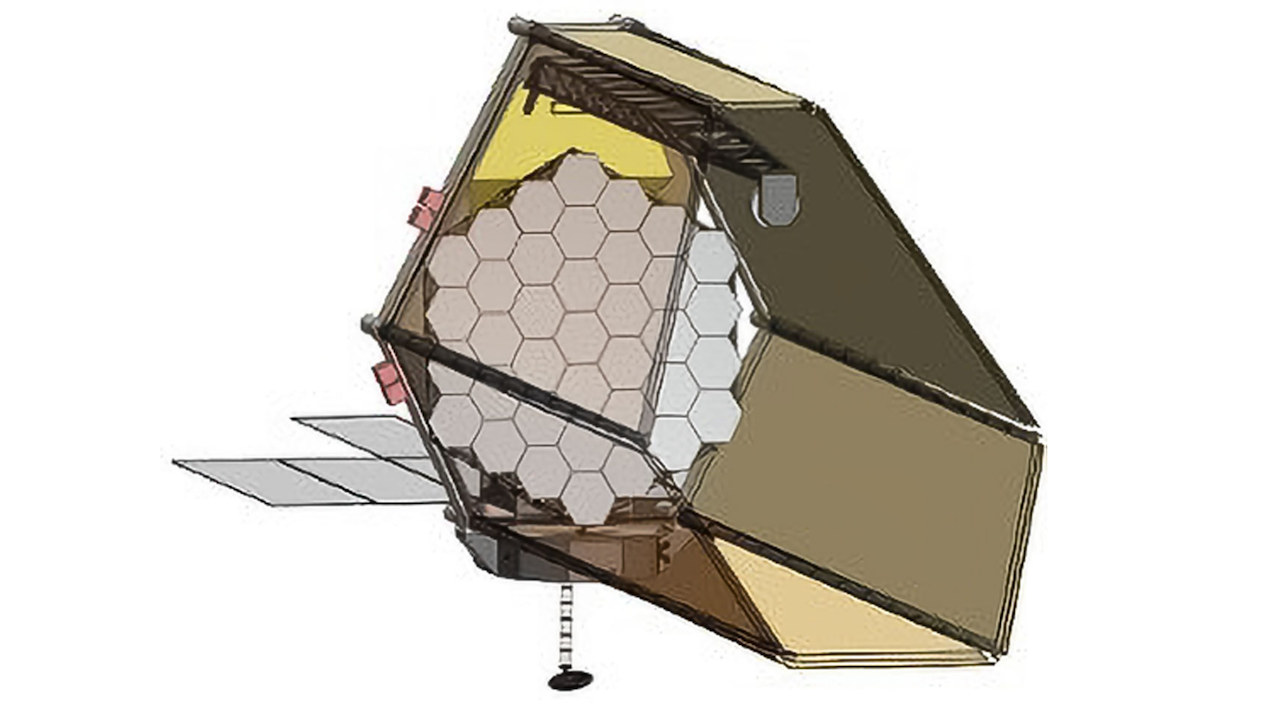
A possible architecture for HWO under study by the HWO Technology Maturation Project Office. This design has an 8-meter inscribed diameter filled by 37 hexagonal segments — larger than JWST.
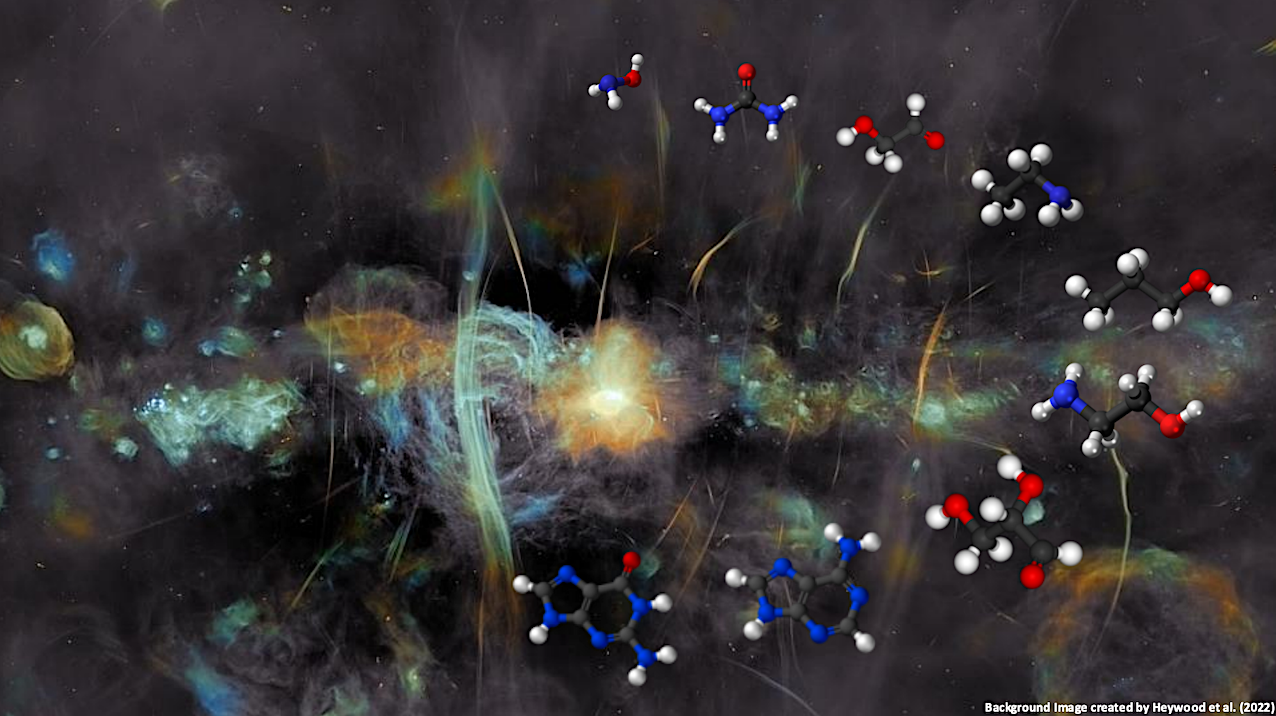
Graphical abstract — astro-ph.IM Contrary to popular belief, the interstellar medium (ISM) is not empty; it is filled with atoms, dust particles, and molecules. Some of these molecules may have
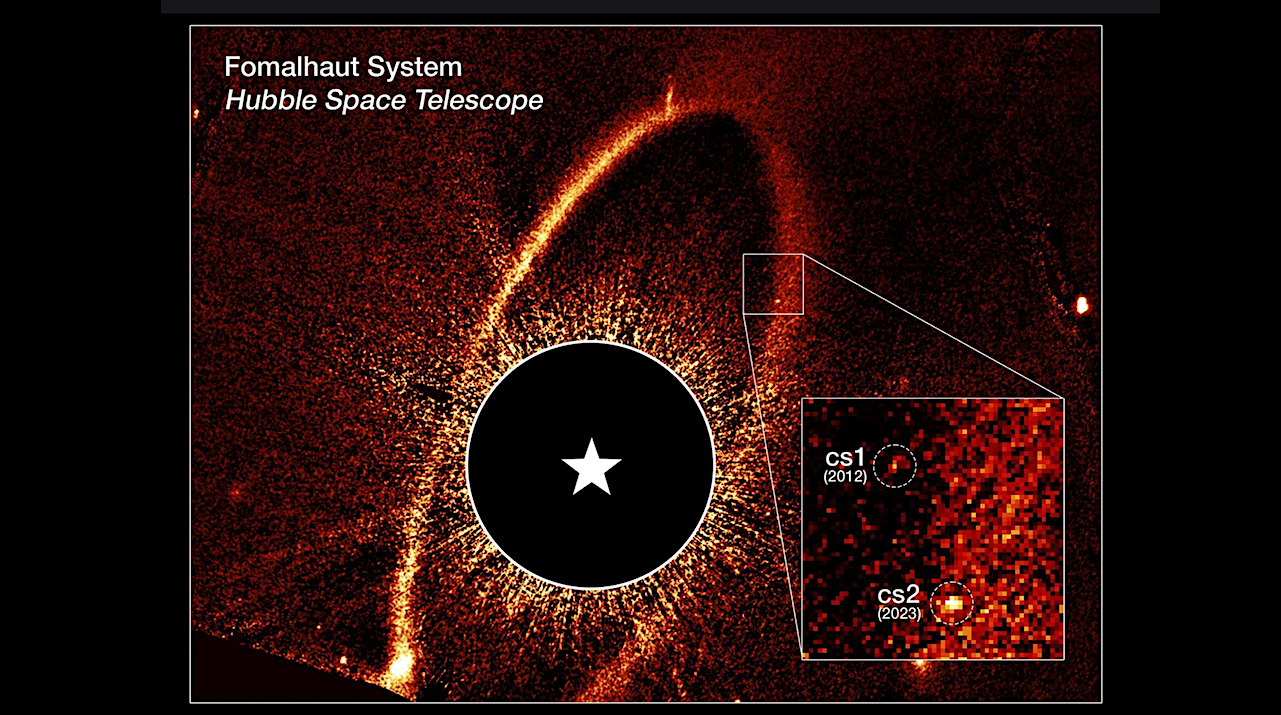
This composite Hubble Space Telescope image shows the debris ring and dust clouds cs1 and cs2 around the star Fomalhaut. Fomalhaut itself is masked out to allow the fainter features
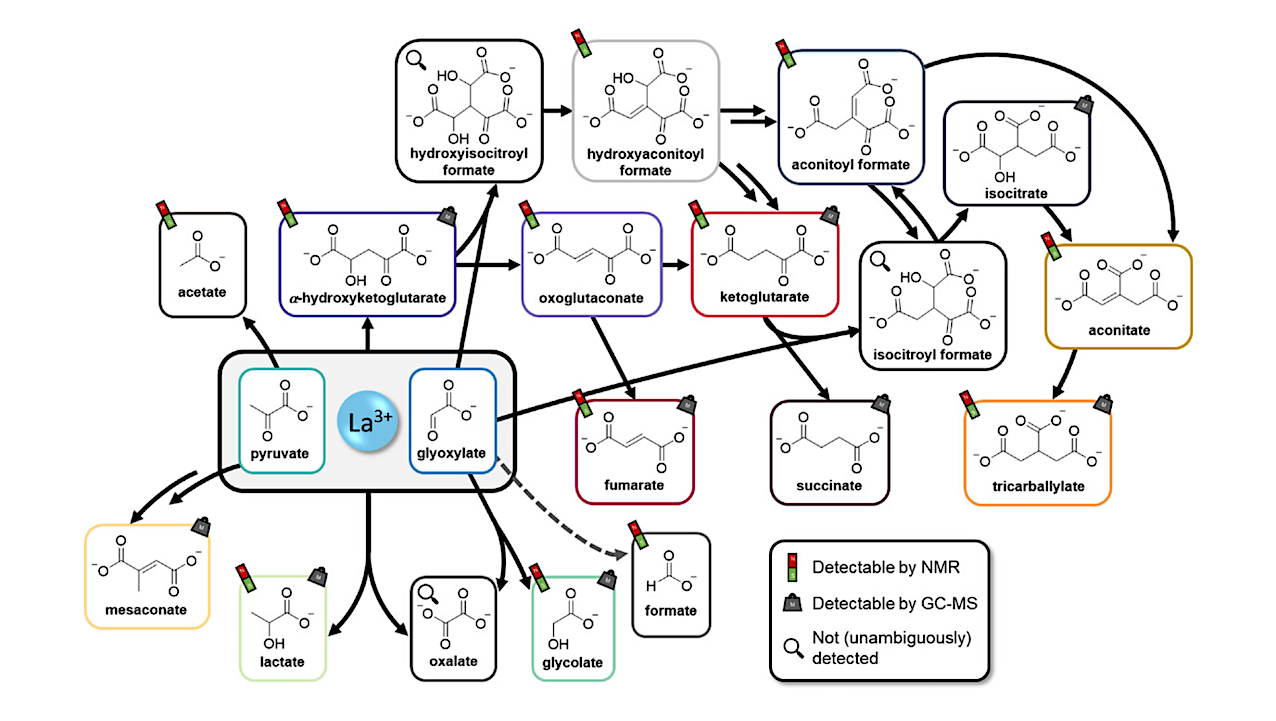
Reaction network arising from the La3+-mediated reaction of glyoxylate and pyruvate, including non-detected intermediates with the most probable routes represented by solid arrows requiring either one (direct arrow) or both
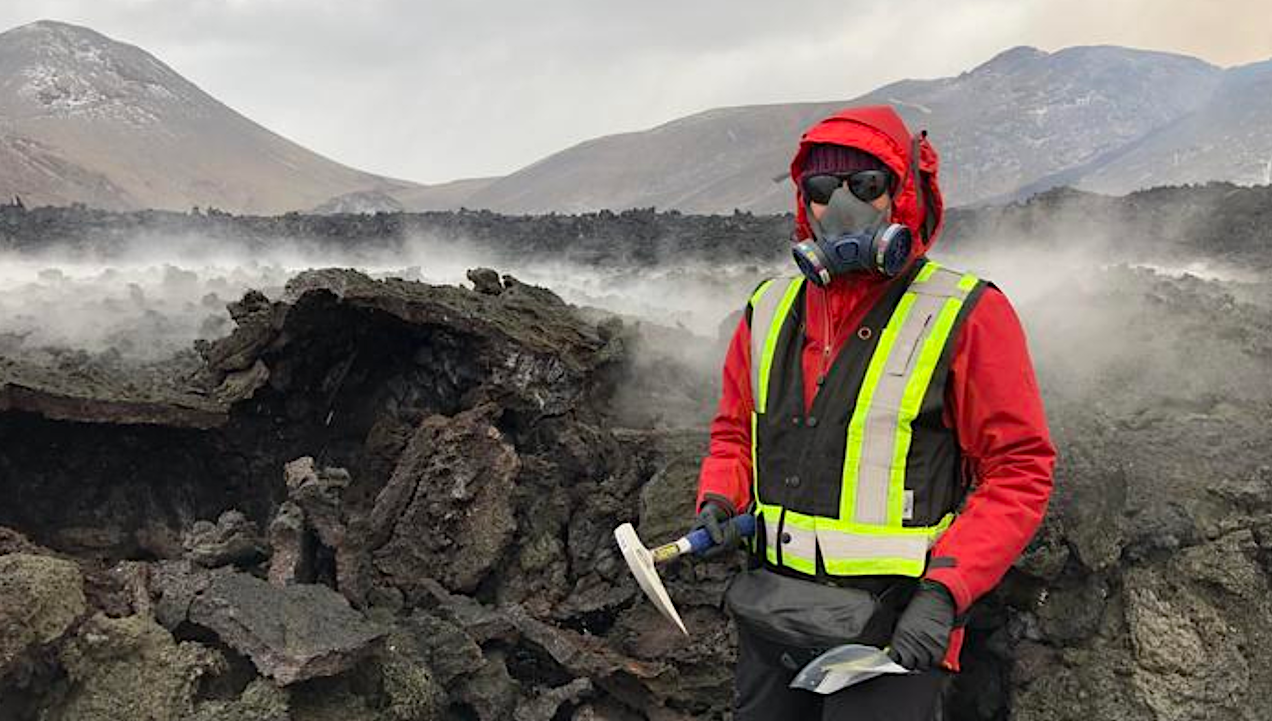
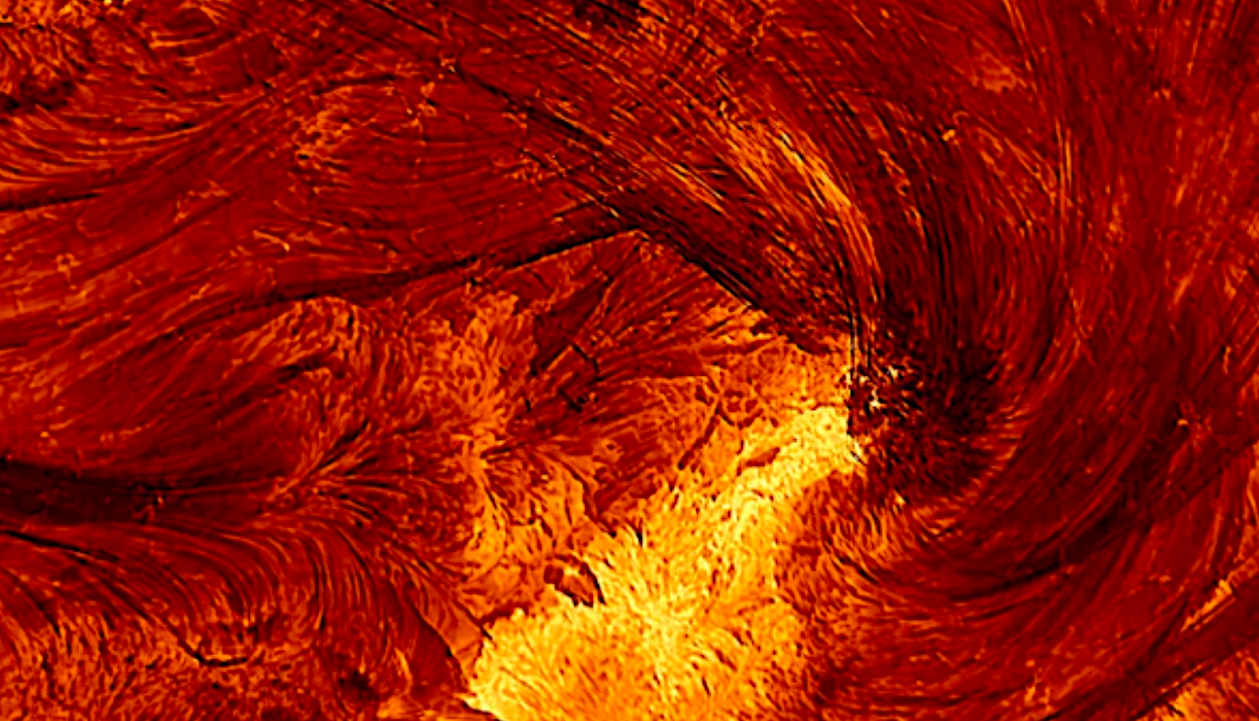
Wearing protective gear against toxic gases, Solange Duhamel stands next to a lava flow during an outing to collect samples of freshly deposited lava rock. Credit Christopher Hamilton Life has
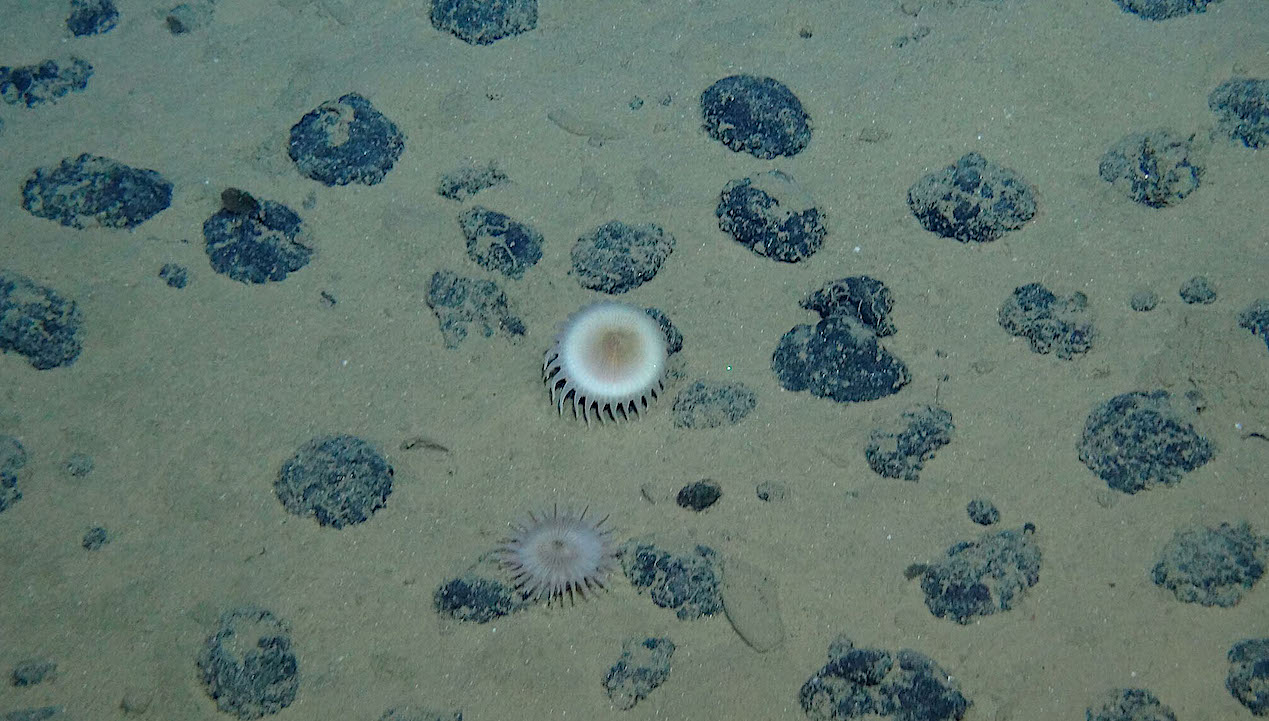
Polymetallic nodules, also called manganese nodules, on the floor of the Pacific Ocean; surprising new research suggests deep sea rocks are capable of producing oxygen without help from plants or
Long before scientists discovered that other stars in the universe host their own planetary systems, humanity had contemplated the existence of life beyond Earth. As our technology matured and we
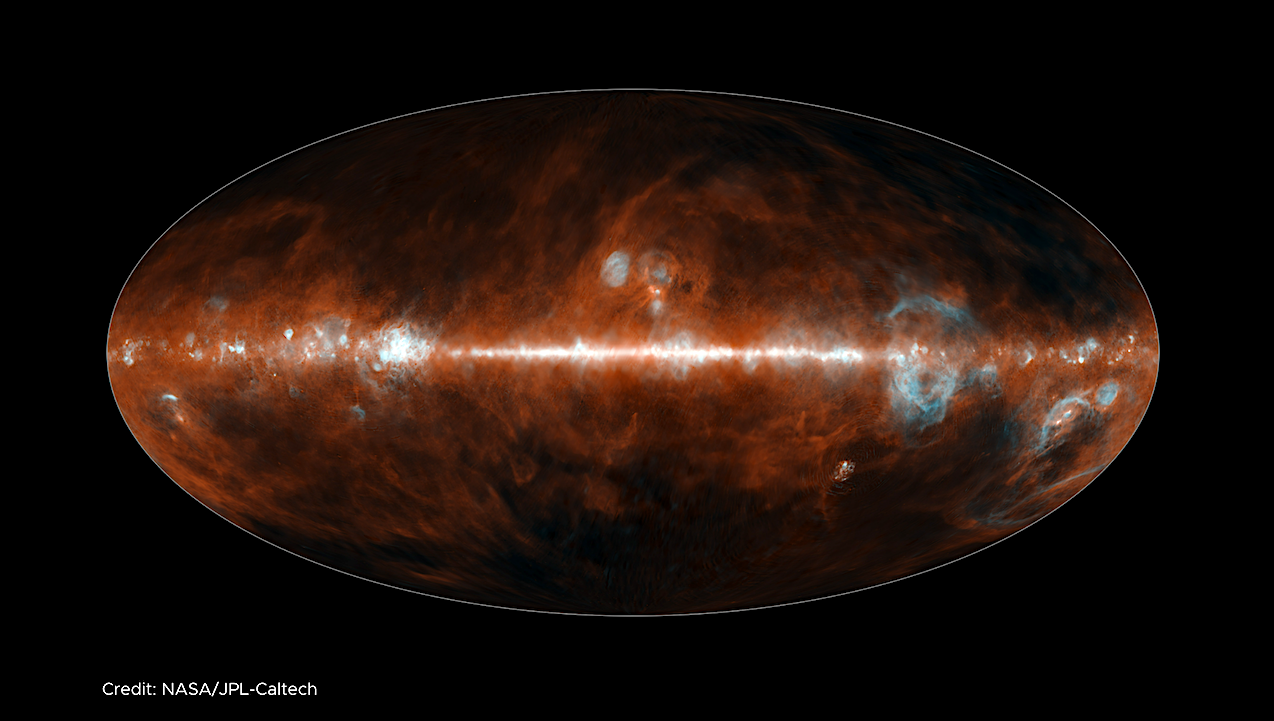
This image features only the wavelengths emitted by the prominent red clouds of a type of cosmic dust known as polycyclic aromatic hydrocarbons (PAHs), and bubbles of hydrogen gas (blue).