


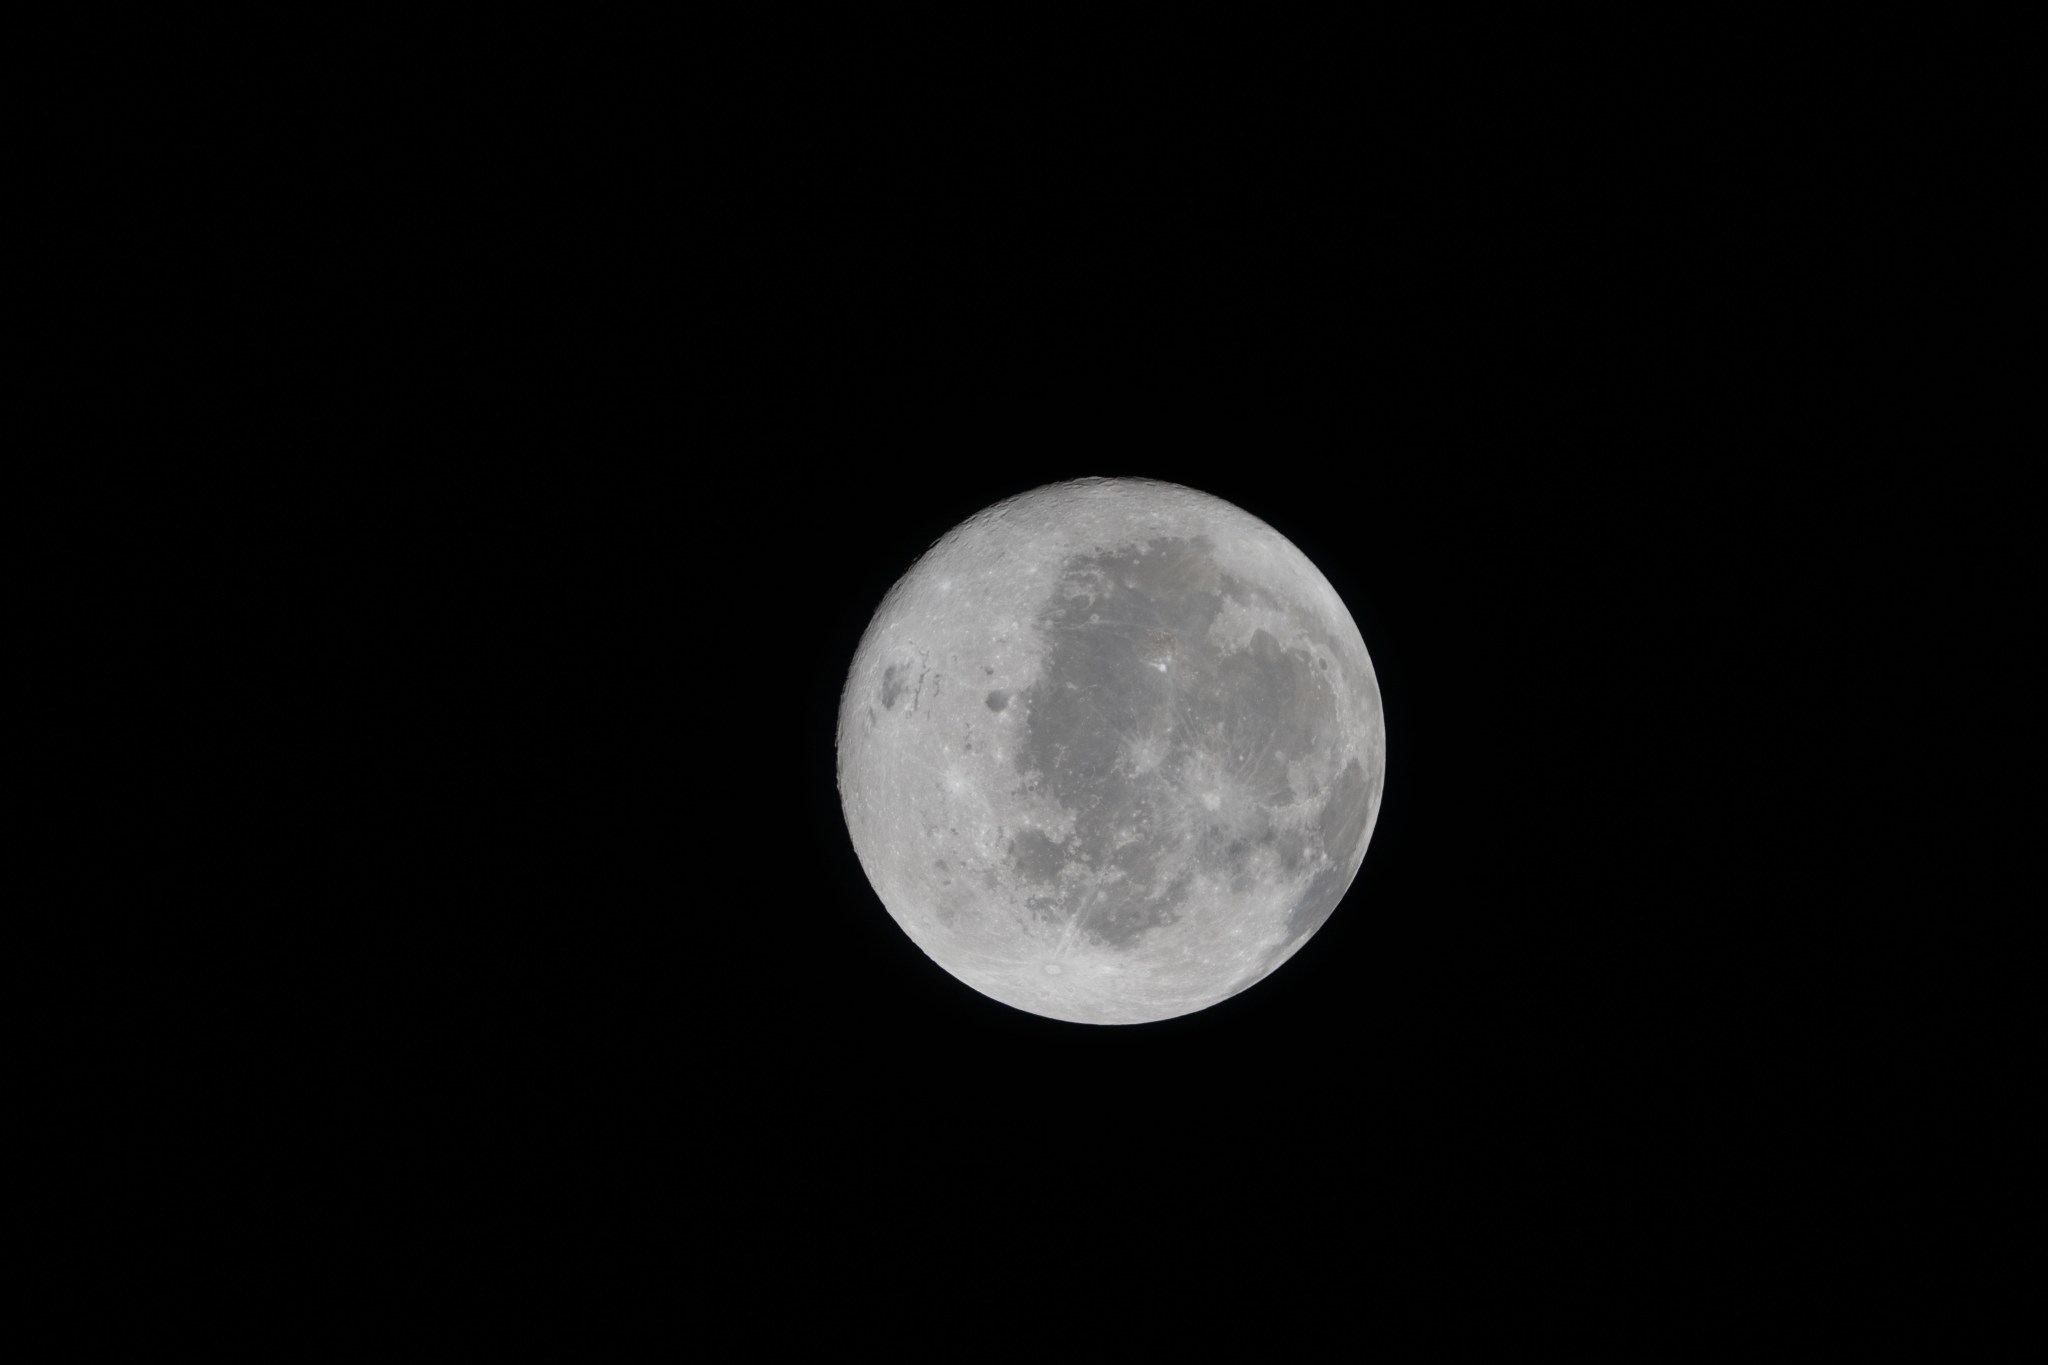
A view of the near side of the Moon, the side we always see from Earth, as seen from the Orion spacecraft. NASA The astronauts aboard NASA’s Orion spacecraft captured


Greetings, Starfighter! Director Nick Castle’s 1984 sci-fi adventure of a trailer park kid recruited to join an interstellar war against Xur and the ruthless Ko-Dan Armada is still a fantastic

The Lyrid meteor shower is nearing peak activity! Here’s the best time to hunt for shooting stars as well as a guide on where to find them in the spring

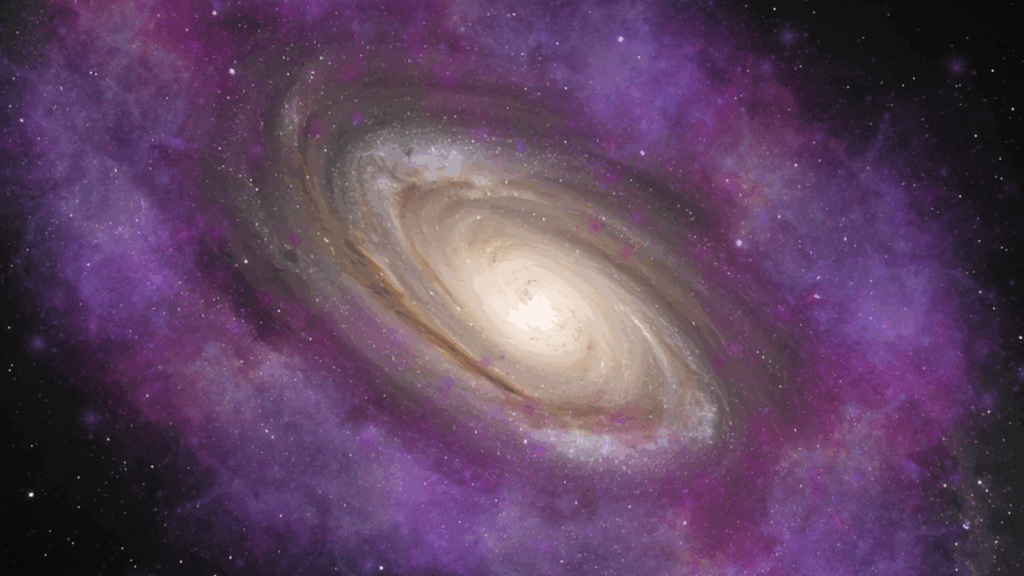
Our universe is full of mysteries, but few are as perplexing as the dark, tiny galaxies that hover around larger ones like the Milky Way. Small, dim, and almost invisible,

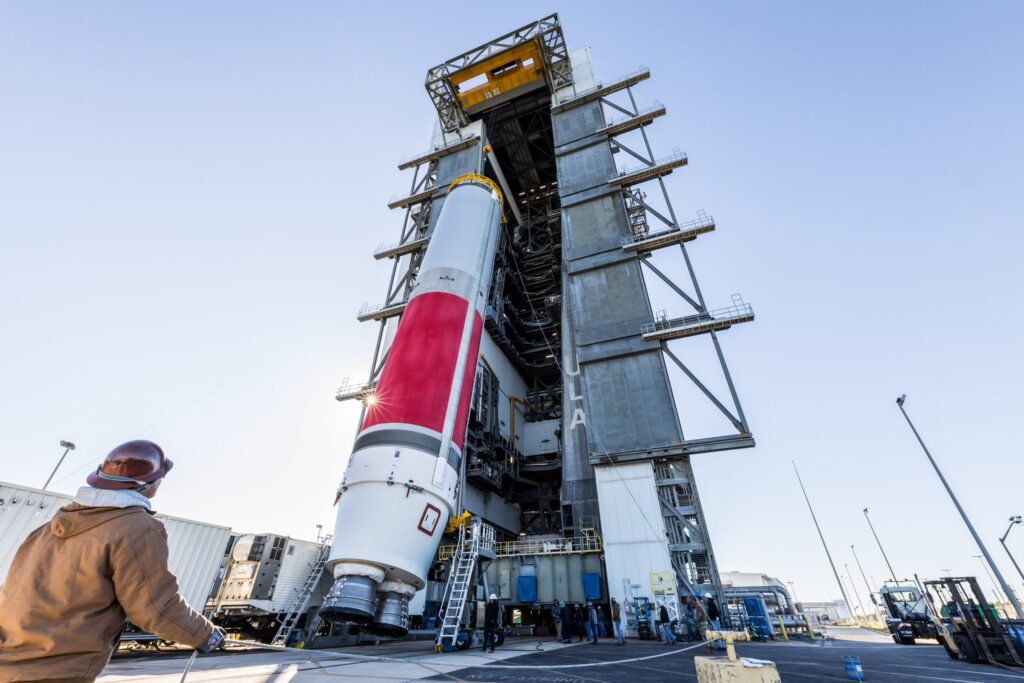
HELSINKI — China is rapidly building a broad, diverse satellite manufacturing base capable of producing thousands of spacecraft annually, but faces bottlenecks in launch and uncertain demand. The country has

Unleash Your Inner Astronaut with the Ezcosplay Women’s NASA Graphic T-Shirt Ladies and gentlemen, fellow seekers of the cosmic unknown, allow me to introduce you to a wearable piece of
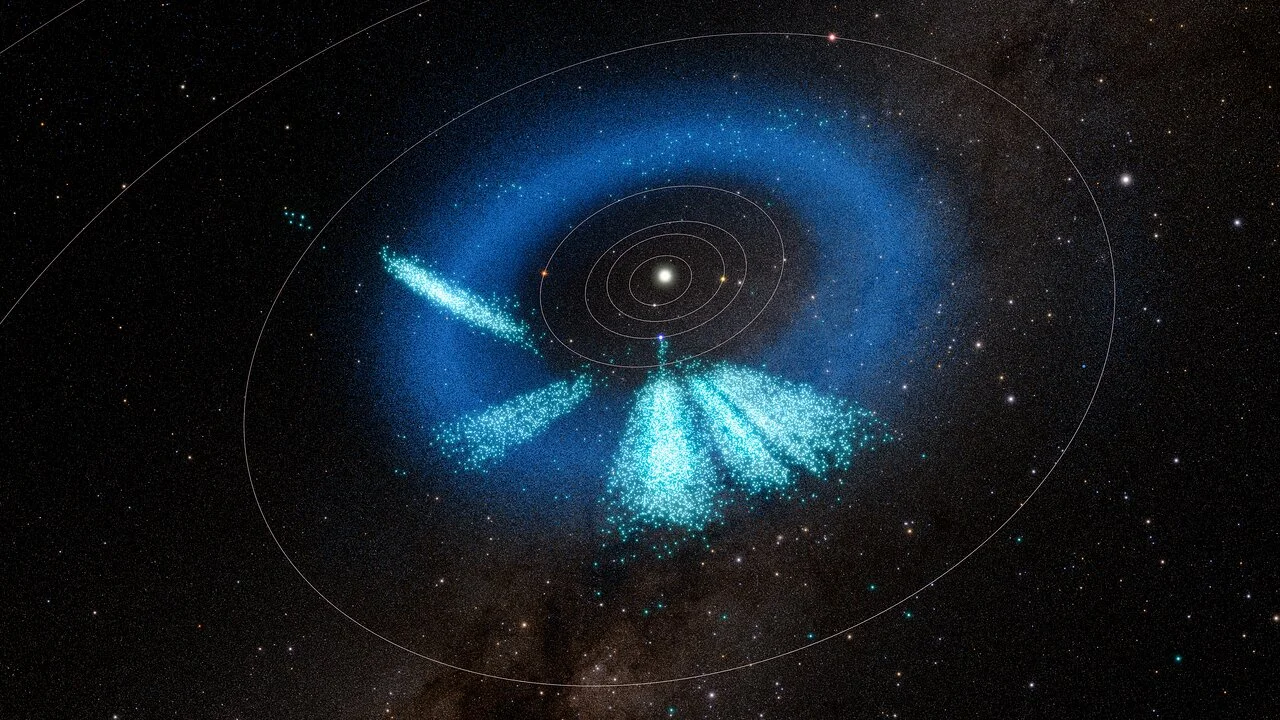
Rubin’s largest asteroid haul yet, gathered before the Legacy Survey of Space and Time even begins, is just the “tip of the iceberg”
A view of the near side of the Moon, the side we always see from Earth, as seen from the Orion spacecraft. NASA The astronauts aboard NASA’s Orion spacecraft captured
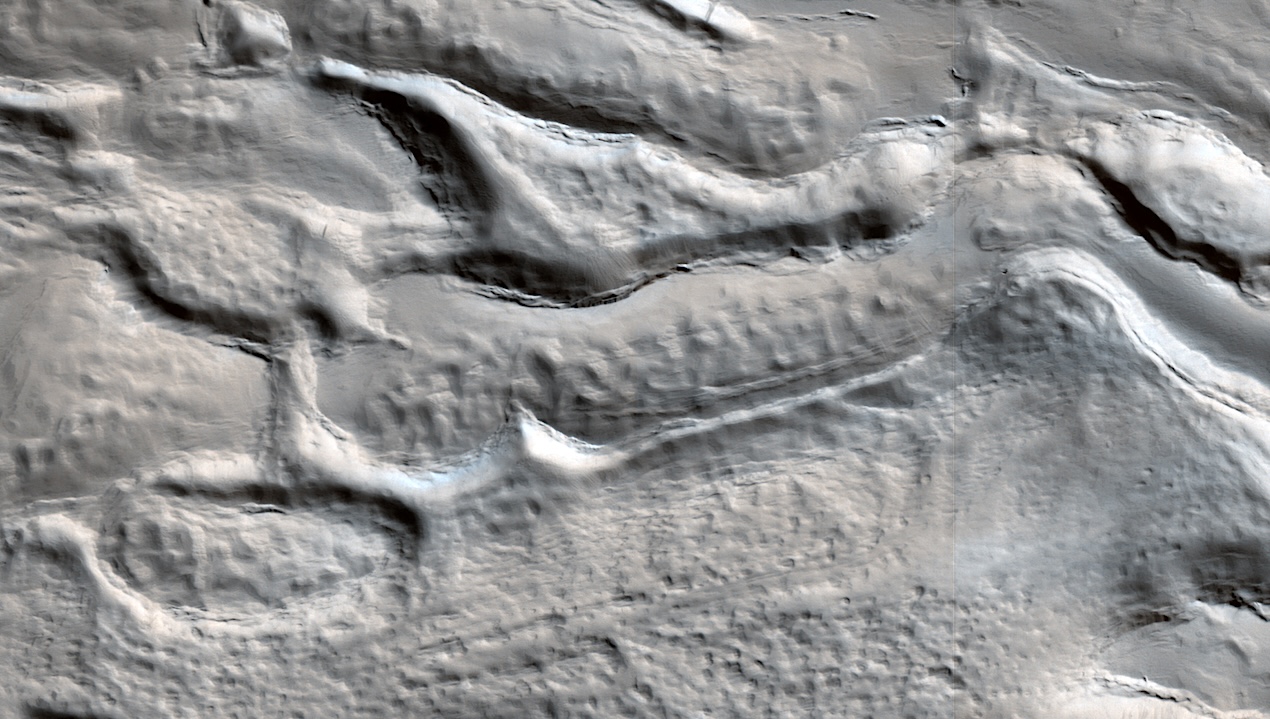
ID: ESP_049028_2065 date: 10 January 2017 altitude: 287 km NASA/JPL-Caltech/University of Arizona Larger image The material on the floor of this crater appears to have flowed like ice, and contains
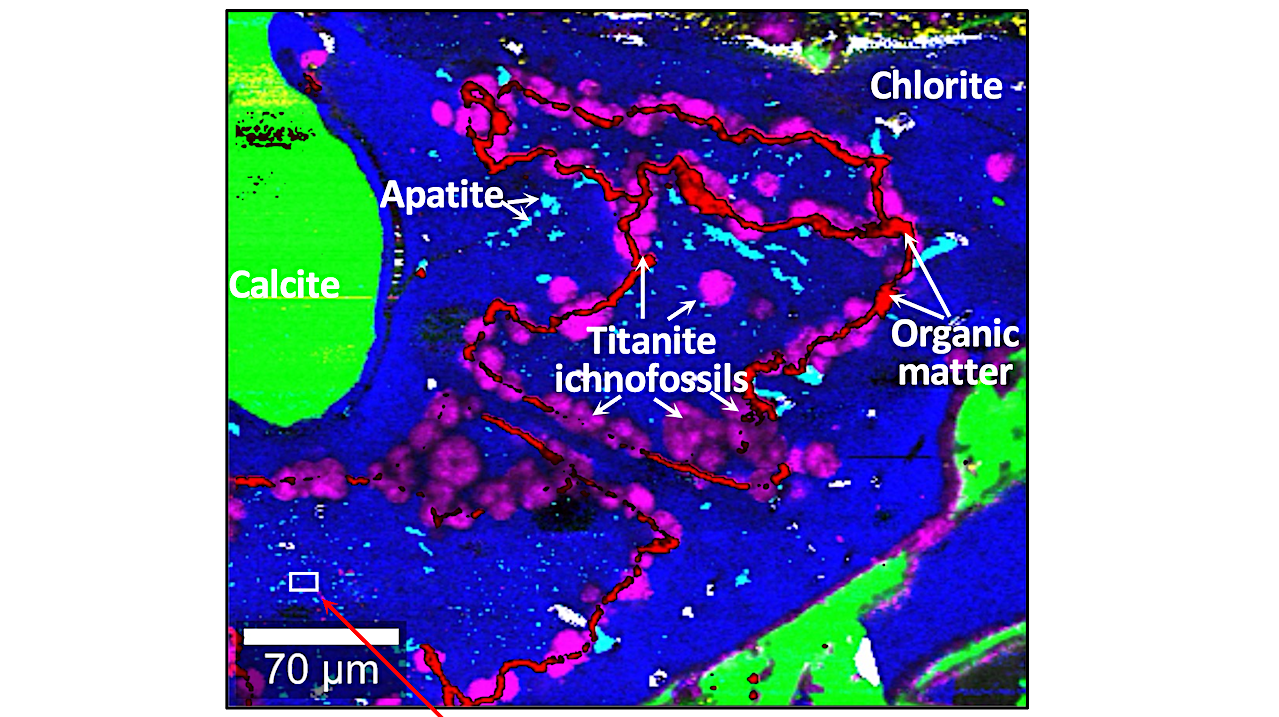
Raman images showing the distribution of OM (red) and titanite (Ttn, purple) inside spheroids immediately adjacent to apatite (Ap, turquoise) and lepidocrocite (Lpc, white) embedded in the basaltic glass fragment
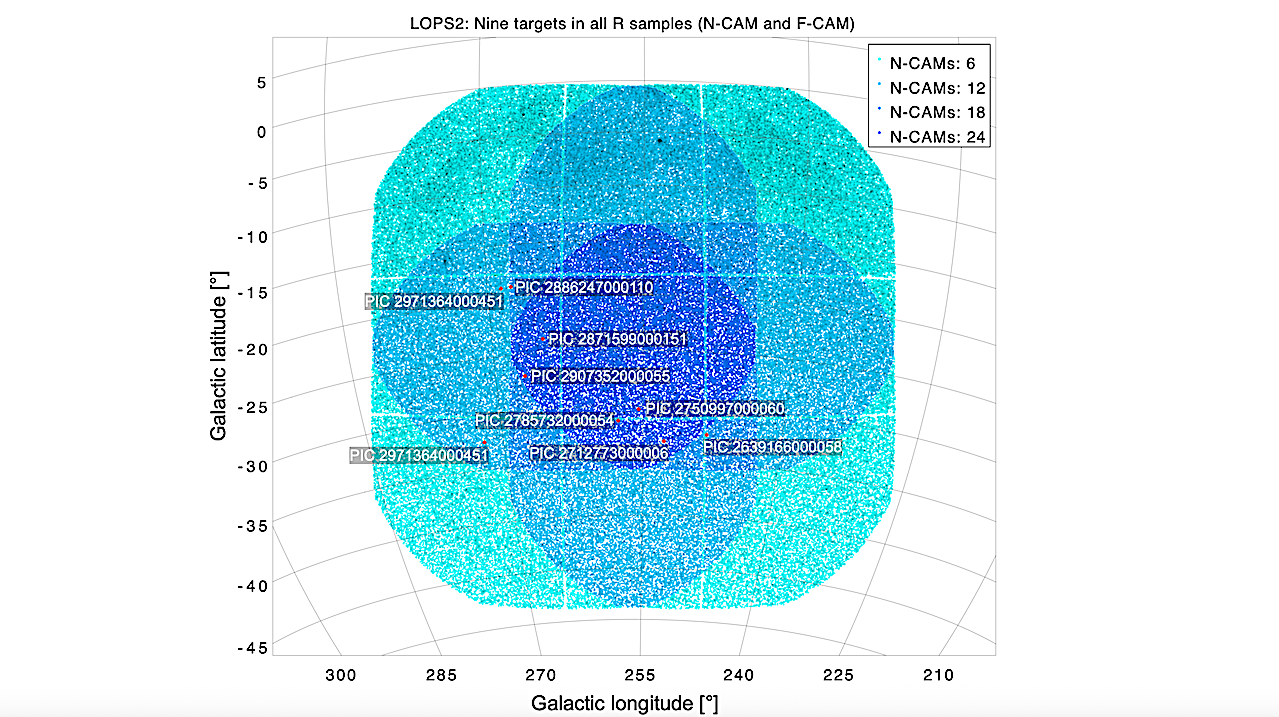
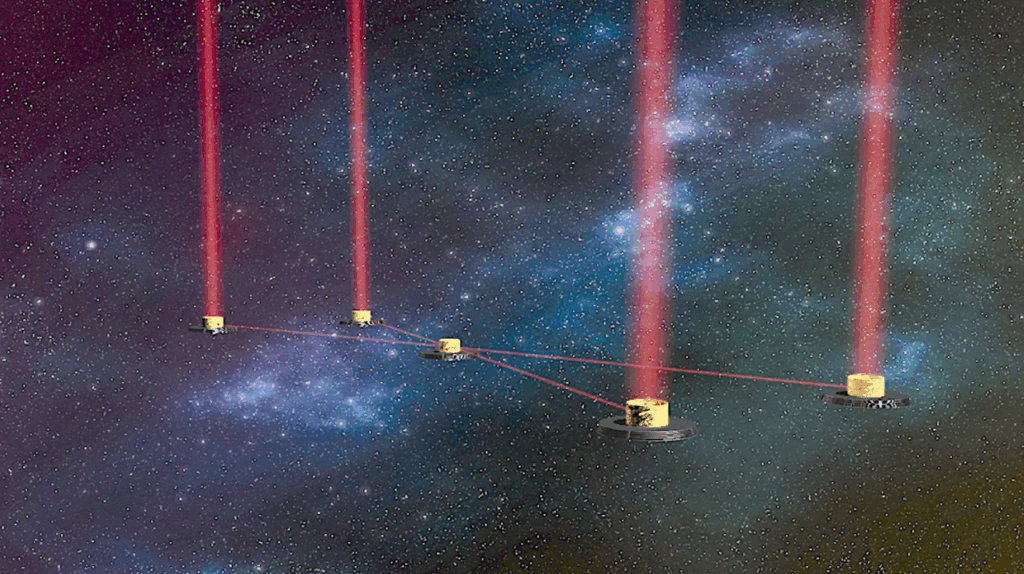
Sky plot of nine cPIC targets that are present in all stellar reference samples. Their PIC names are indicated with labels. — astro-ph.IM A few weeks after launch, the PLATO
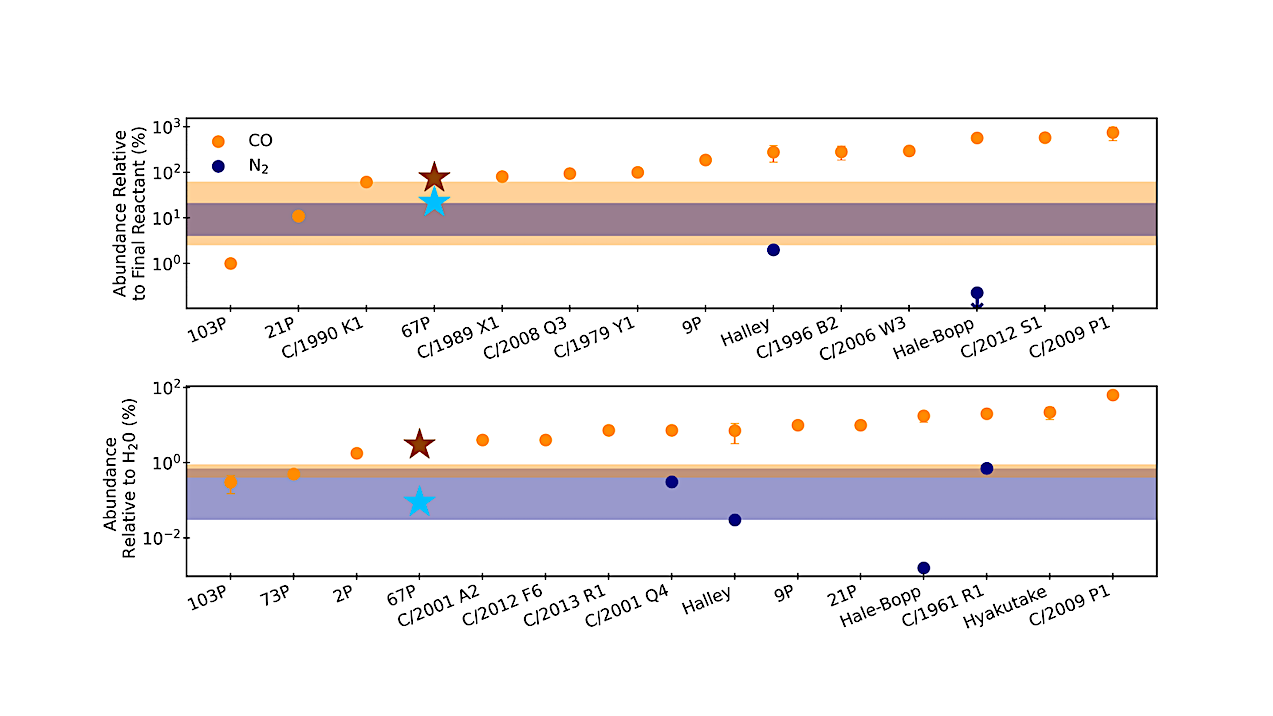
A summary of the CO and N2 reported in various comets with respect to parent molecule (top) and with respect to water (bottom). The CO/CO2 ratios are reported by O.
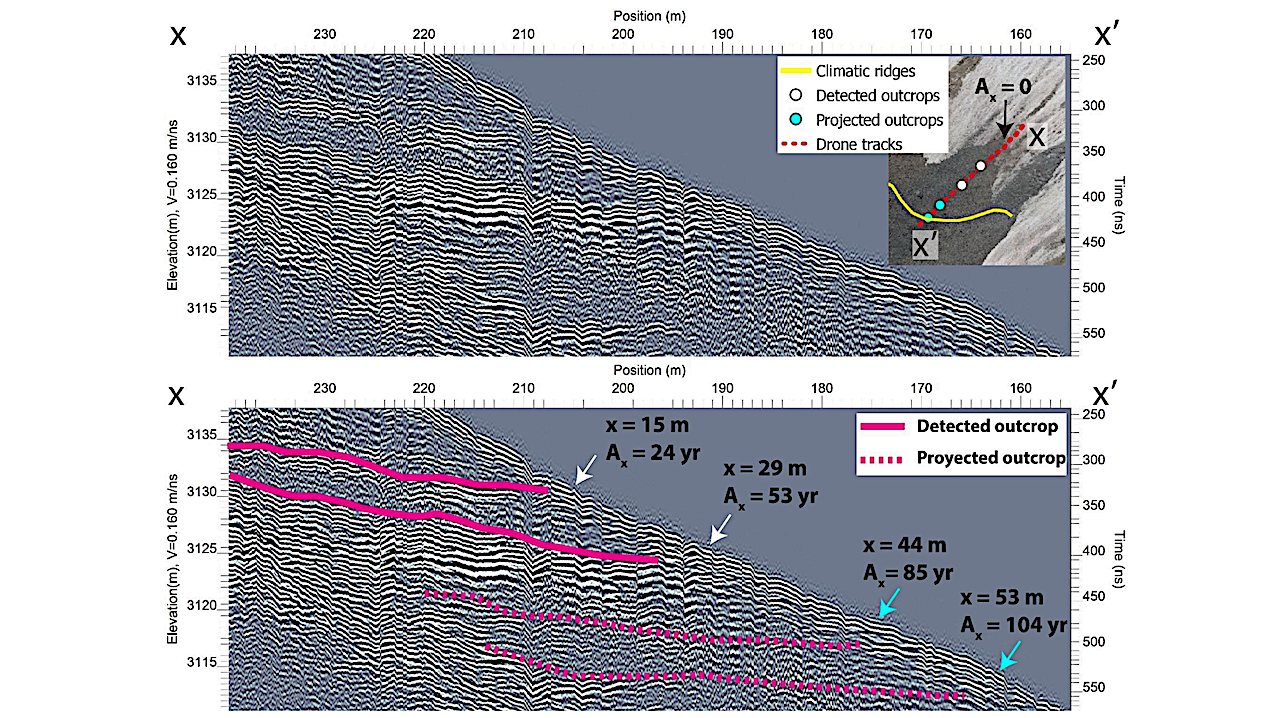
Terrain corrected DGPR profile at Galena Creek Rock Glacier. Location of the profile is shown in Fig. 3A. Uninterpreted data (top) and interpreted internal debris layers (bottom), with detected and
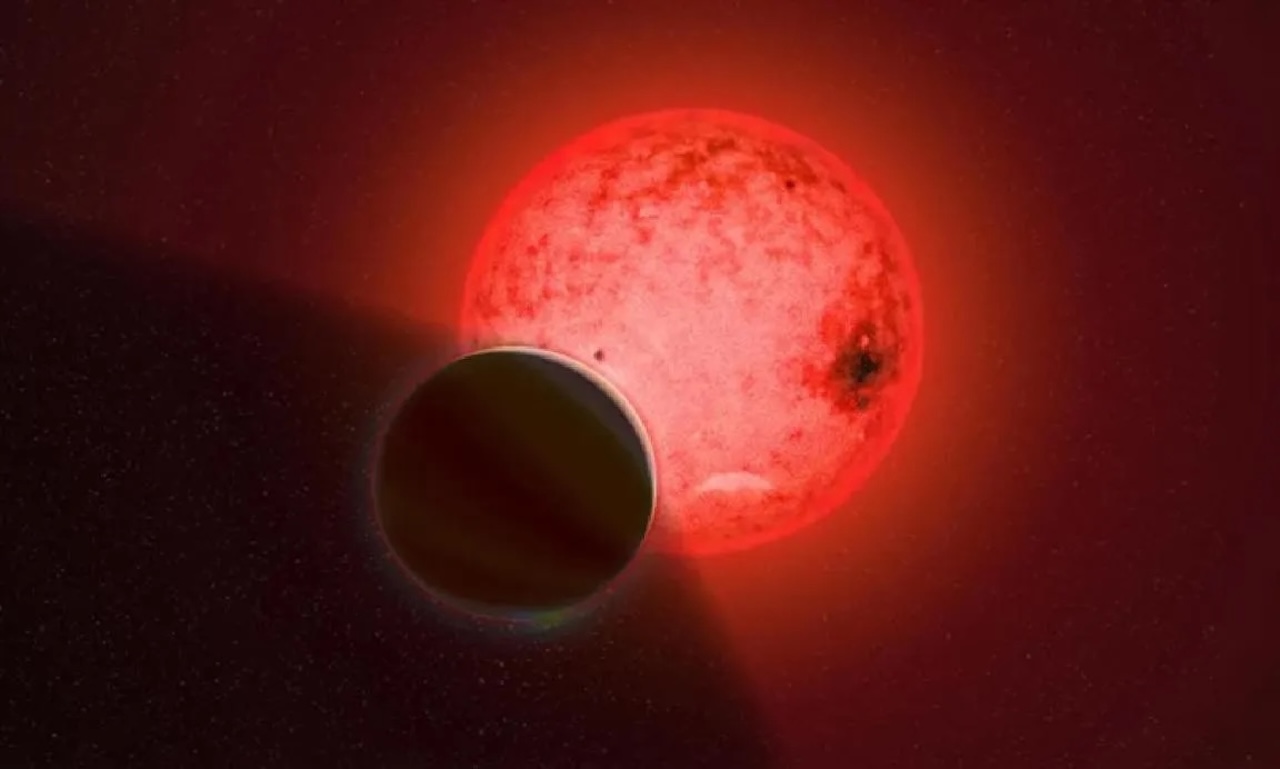
Artist’s conception of the gas giant planet TOI-5205 b orbiting a small, cool red dwarf star. Image courtesy of Katherine Cain, Carnegie Science. Massive exoplanet reveals new insights into the
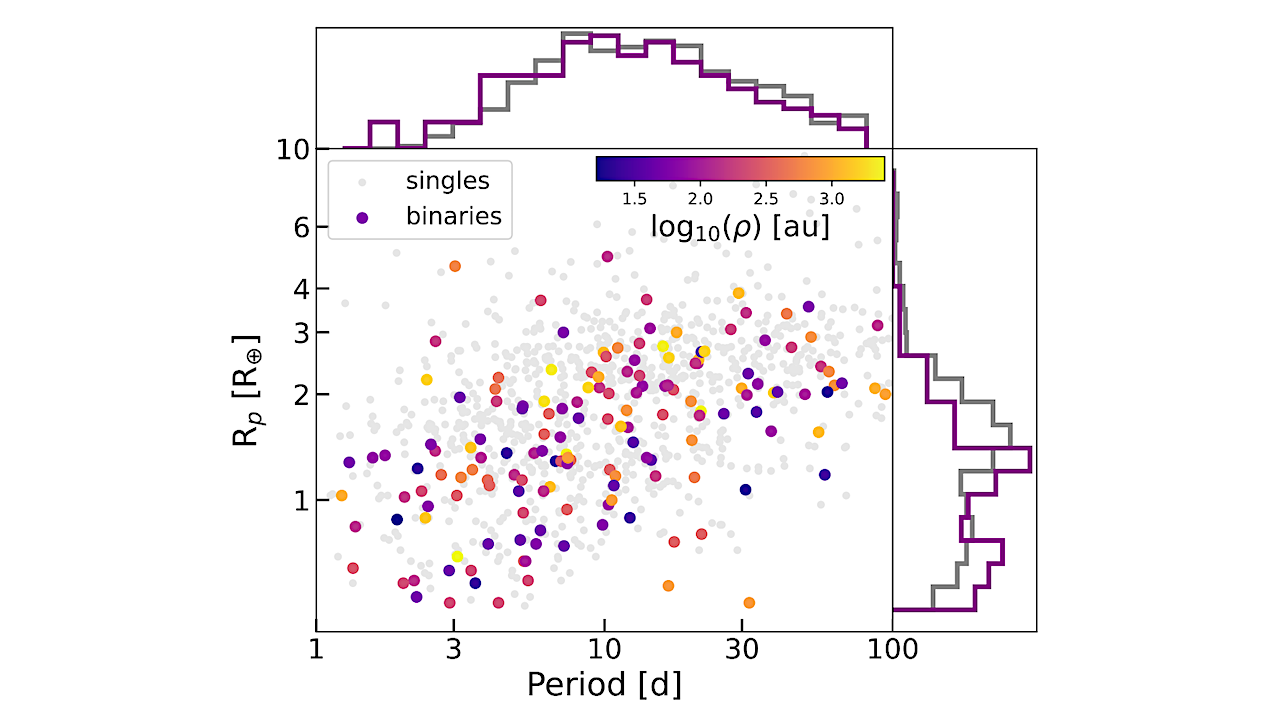
Period-radius plot for planets in single-star (gray points) and binary-star (colored points) systems considered in this work. Colors correspond to log10(ρ), i.e. the projected physical binary separation in au. We
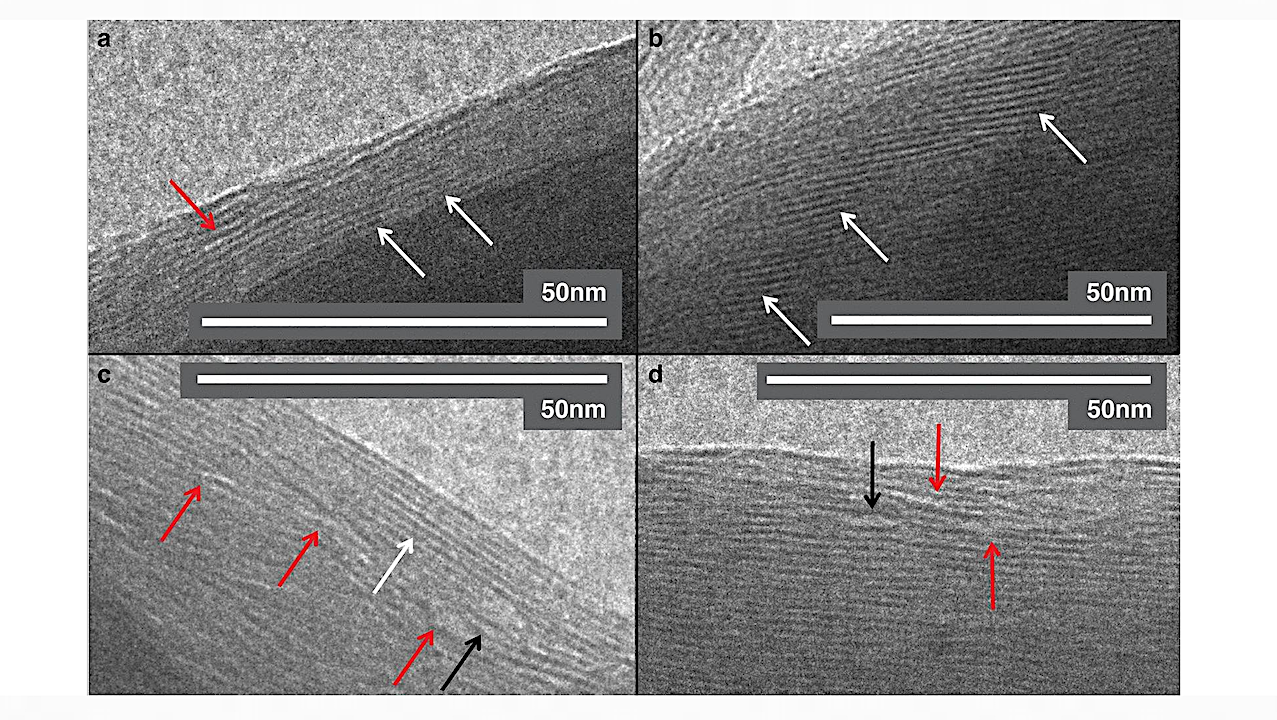
TEM images of Ca-MMT’s ordered and distorted layered structures including nanocavities after exposure to amino acids. a Control sample showing characteristic layering; ordered yet with slight distortions, considered as ordered
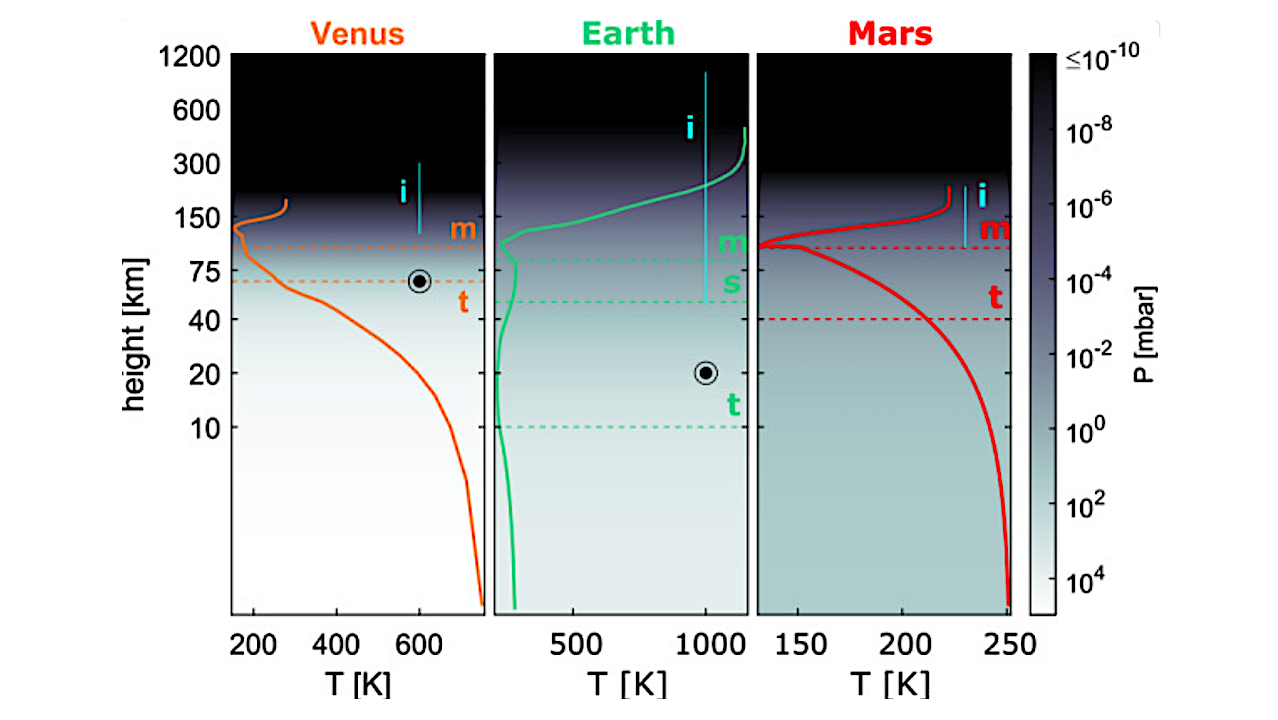
Height scales of atmospheres of Solar System’s terrestrial planets. The solid lines show the temperature profiles against altitude, while the background colour reflects the atmospheric pressure. Horizontal dashed lines denote