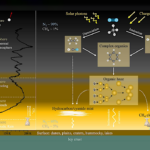
Illustration of the thermal structure of Titan’s atmosphere and its atmospheric processes. It illustrates the high-altitude photochemistry of N2 and CH4, leading to the formation of more complex organic molecules,

Illustration of the thermal structure of Titan’s atmosphere and its atmospheric processes. It illustrates the high-altitude photochemistry of N2 and CH4, leading to the formation of more complex organic molecules,
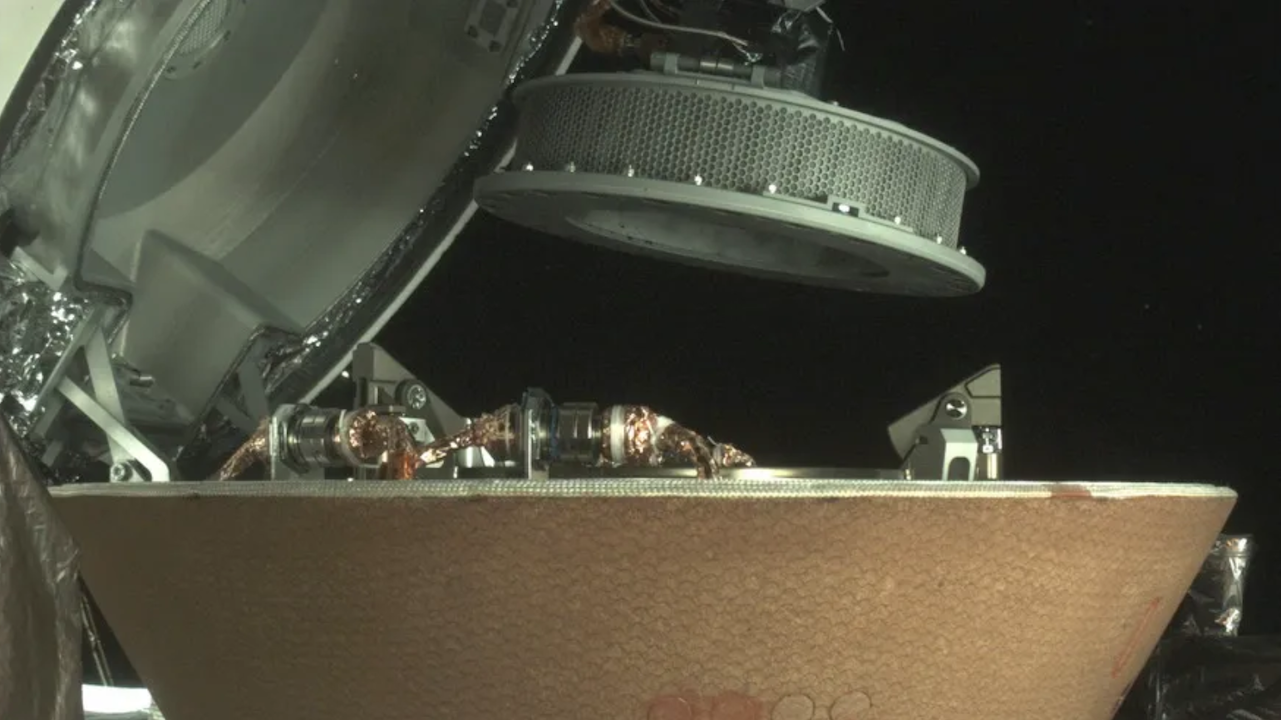
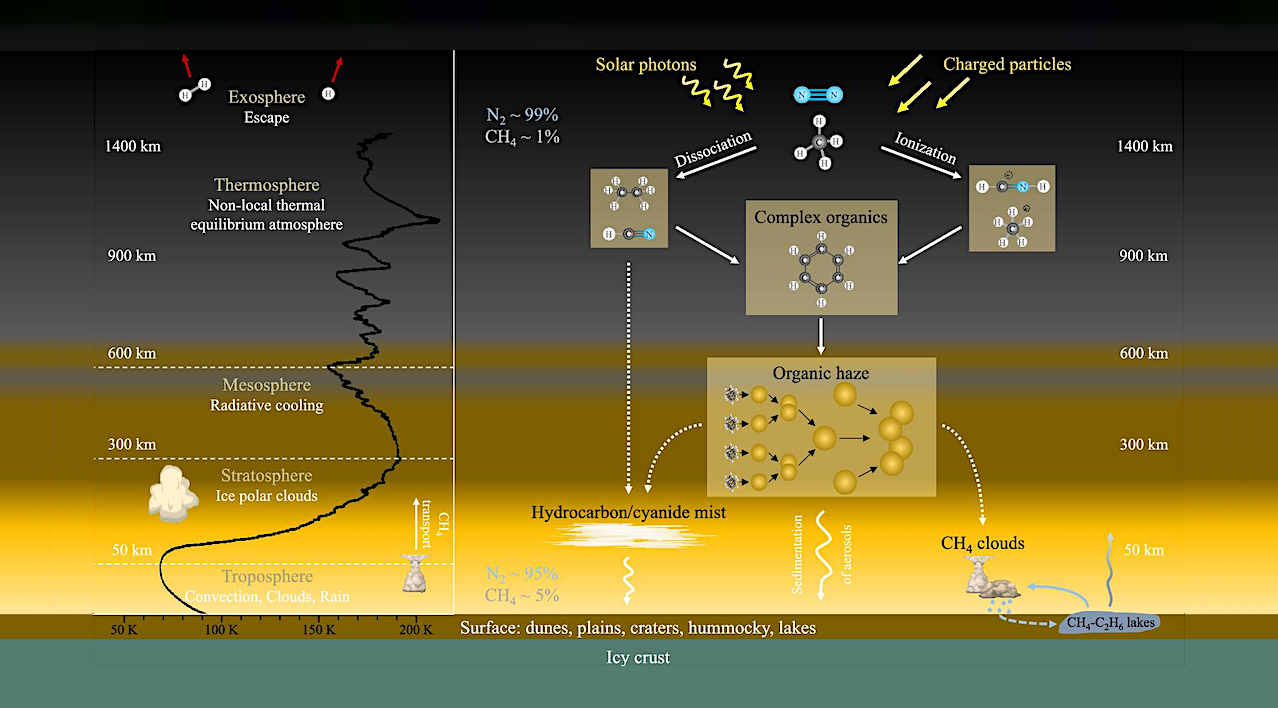
Canister containing material collected from asteroid Bennu placed inside the OSIRIS-REx sample return capsule. Credit: NASA/GSFC/Univ. of Arizona/Lockheed Martin Studying asteroids addresses a number of unknowns in planetary science. Investigating
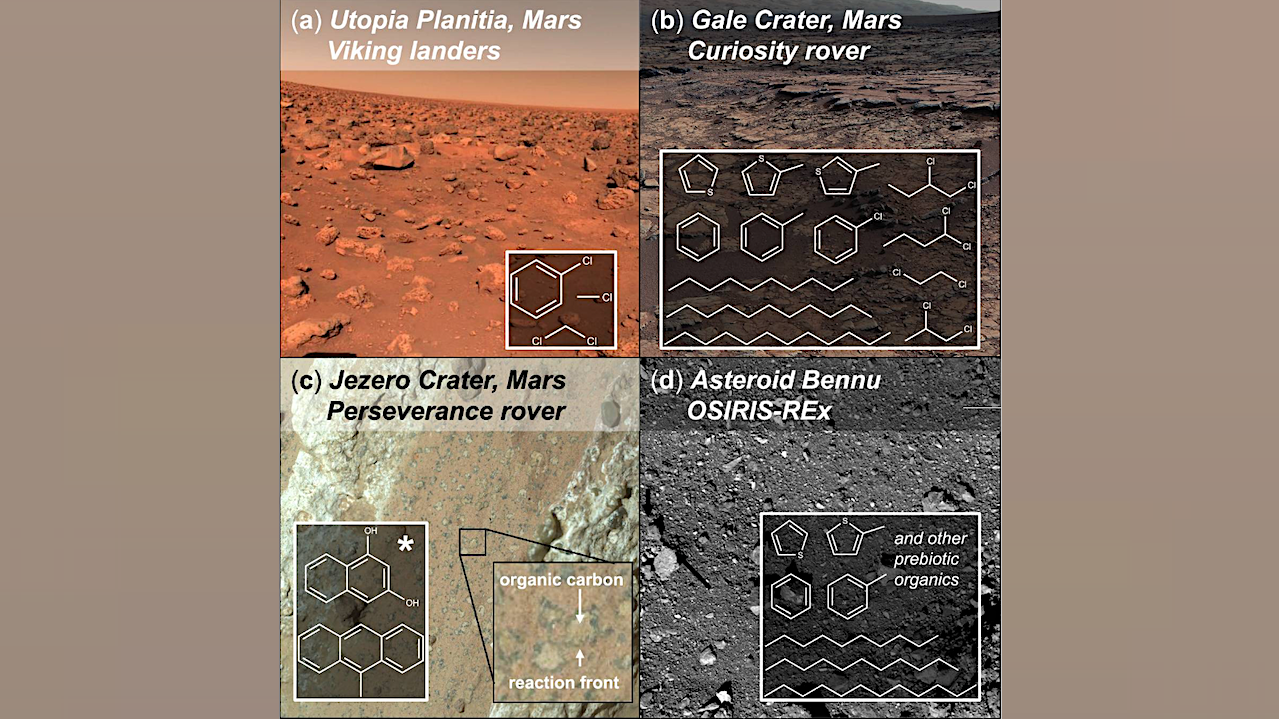
a The Viking 1 & 2 landers detected chlorinated breakdown products likely formed through interactions between organics and oxychlorine anions during thermal volatilization utilized for analysis11,12, b the Curiosity rover
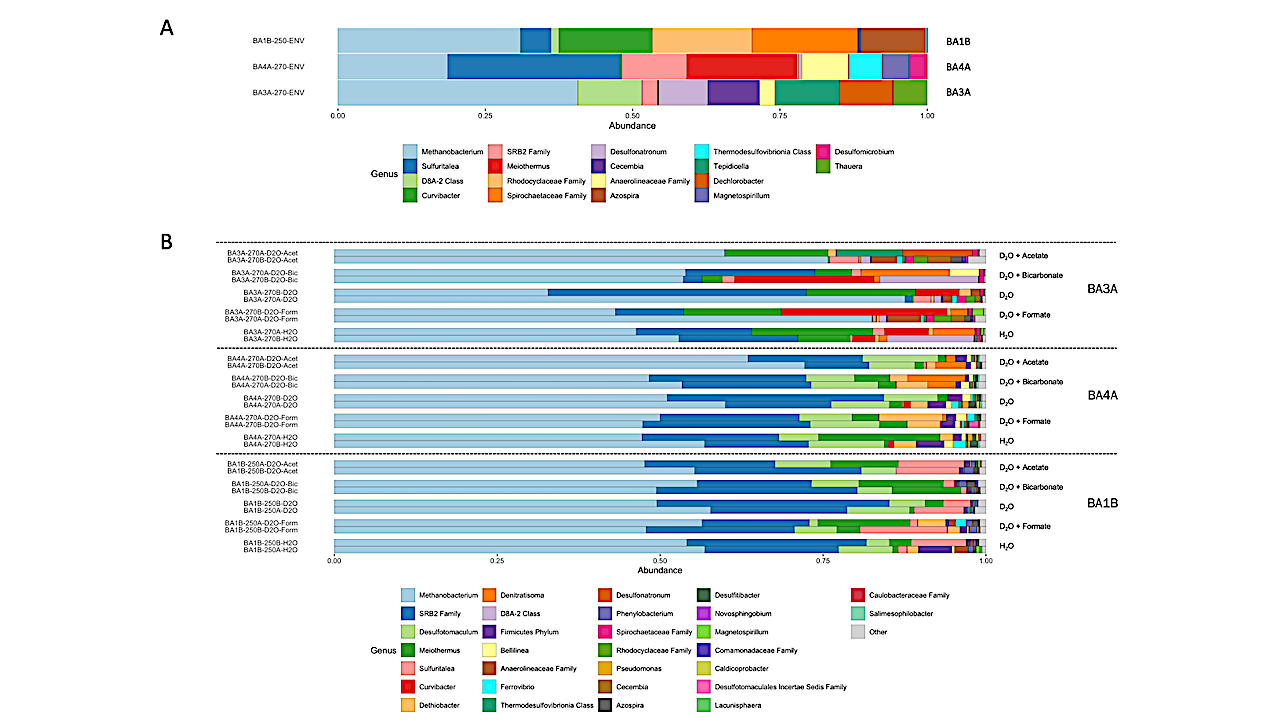
16S rRNA amplicon sequencing data of fluids collected from each borehole (A) prior and (B) post 2H incubation. Horizontal bars show relative abundance of 16S rRNA amplicon sequencing variants. Sample
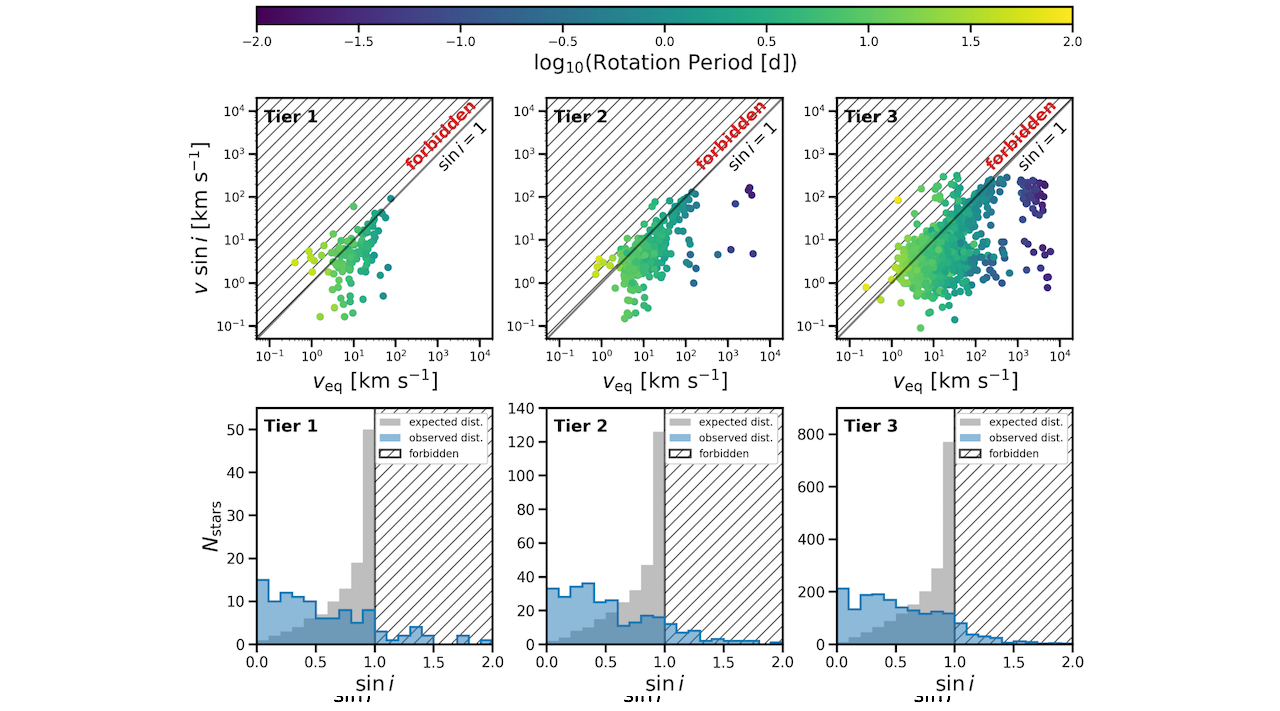
Upper panels: Equatorial rotational velocity (veq) vs. projected rotational velocity (v sin i) for stars in Tiers 1, 2, and 3. The v sin i values are taken directly from
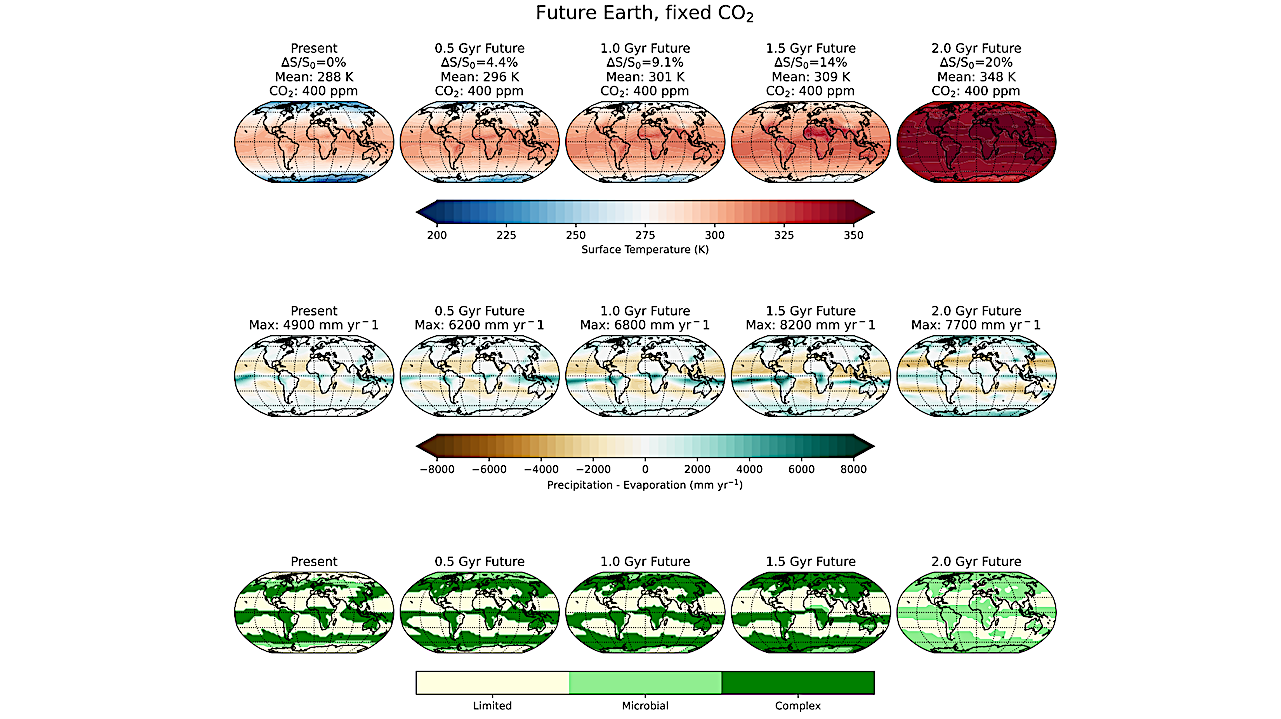
ExoCAM simulations of Earth from the present up to 2.0 Gyr in the future, assuming CO2 remains fixed at 400 ppm. The top row shows surface temperature, the middle row
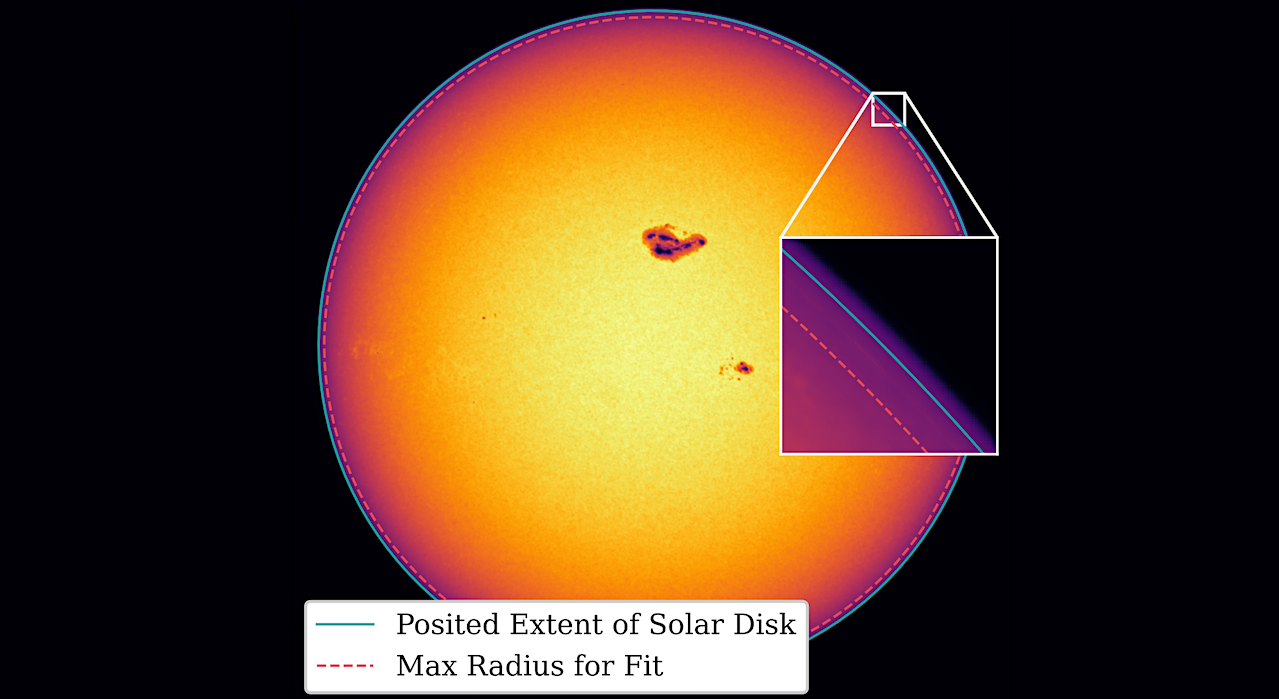
A demonstration of the limitations of the PSPT data processing pipeline, which did not process the limb uniformly with the rest of the Solar disc. The solid blue line is
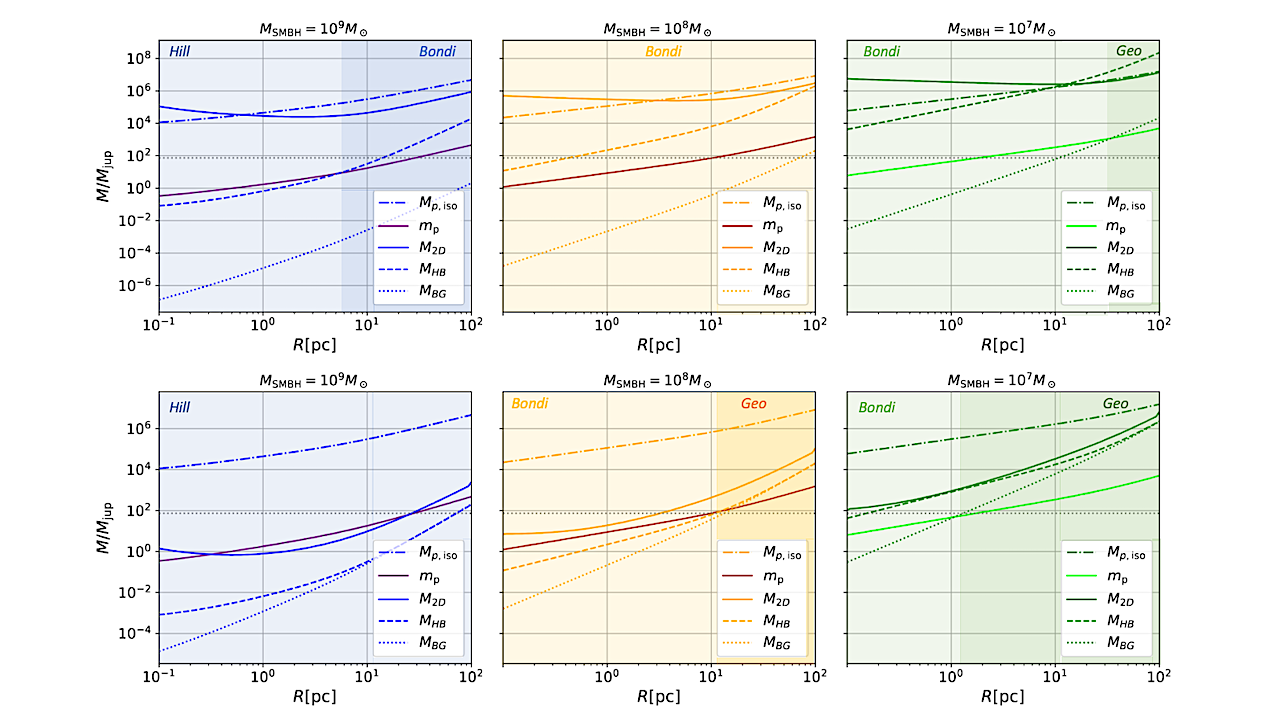
Transition between different accretion regimes as shown by the shading and top labels. From left to right the panels show central AGN masses of 109, 108 and 107 𝑀⊙. The
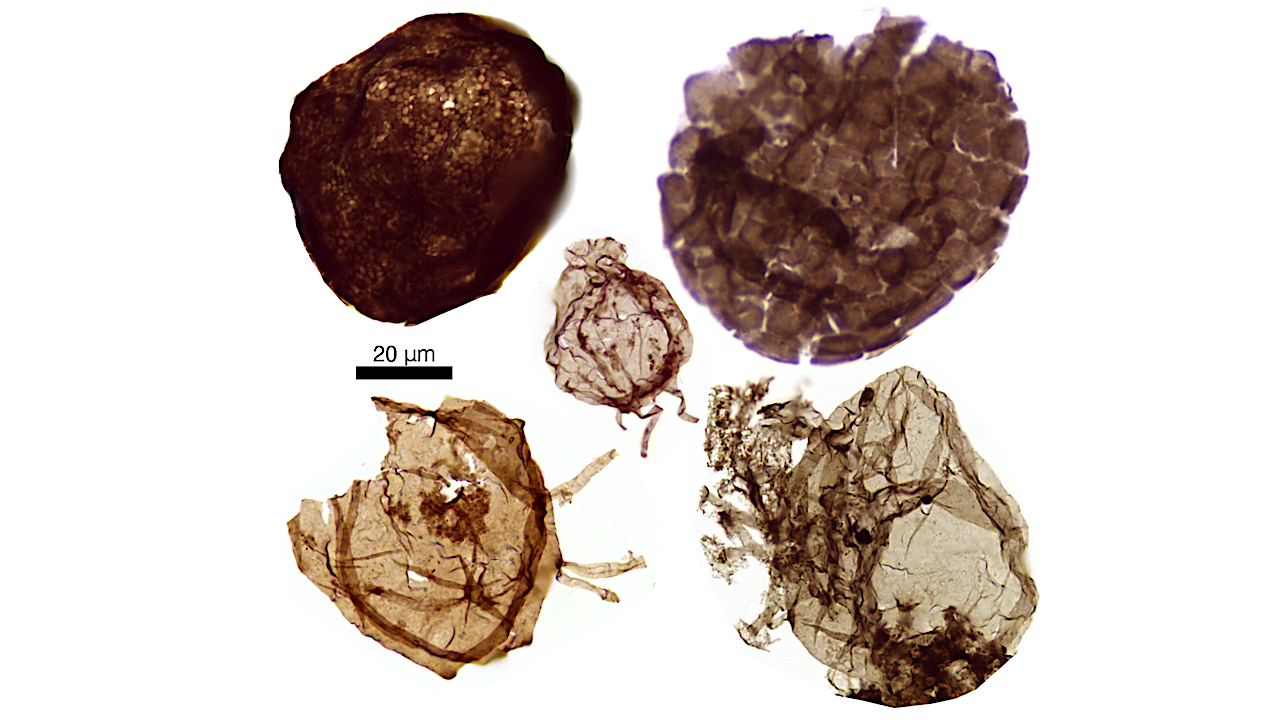
Microfossil by Researcher Max Lechte. Credit – LA Reidman McGill University The earliest known eukaryotes, the ancestors of all complex life on Earth, lived in oxygenated, shallow marine environments nearly
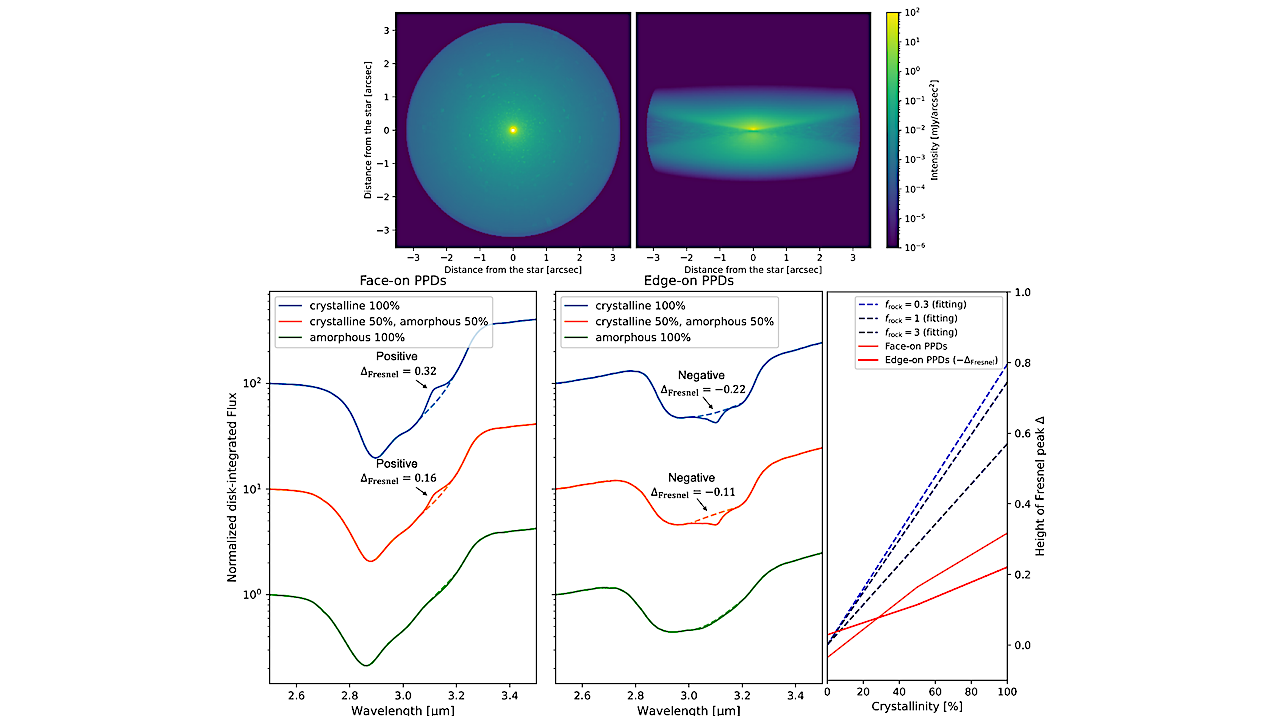
Protoplanetary disk images (top row) and scattered-/transmitted-light spectra (bottom-left and bottom-middle) obtained from the radiative-transfer simulations, together with the crystallinity dependence of their Fresnel-feature heights (bottom-right). For the edge-on case,