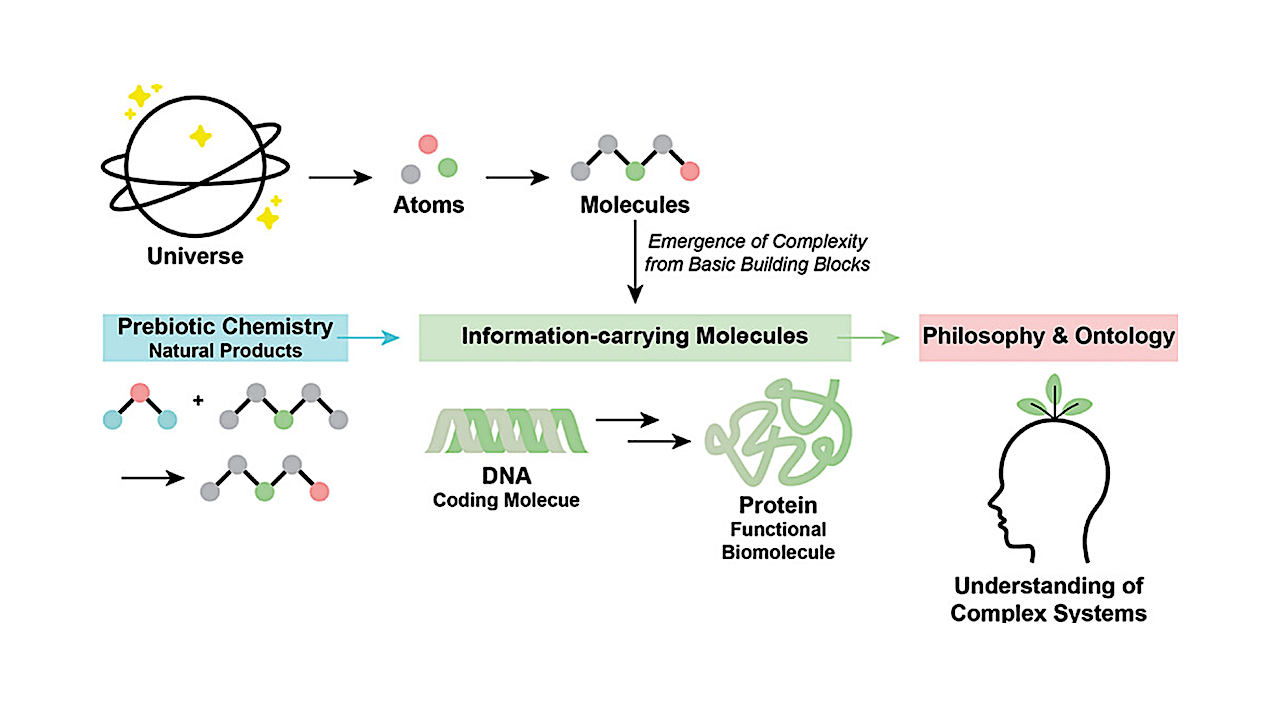
Chemistry, biology, and philosophy each contribute in distinct but complementary ways to understanding the origin of life. These contributions show how complexity arises from basic building blocks and how prebiotic

Chemistry, biology, and philosophy each contribute in distinct but complementary ways to understanding the origin of life. These contributions show how complexity arises from basic building blocks and how prebiotic
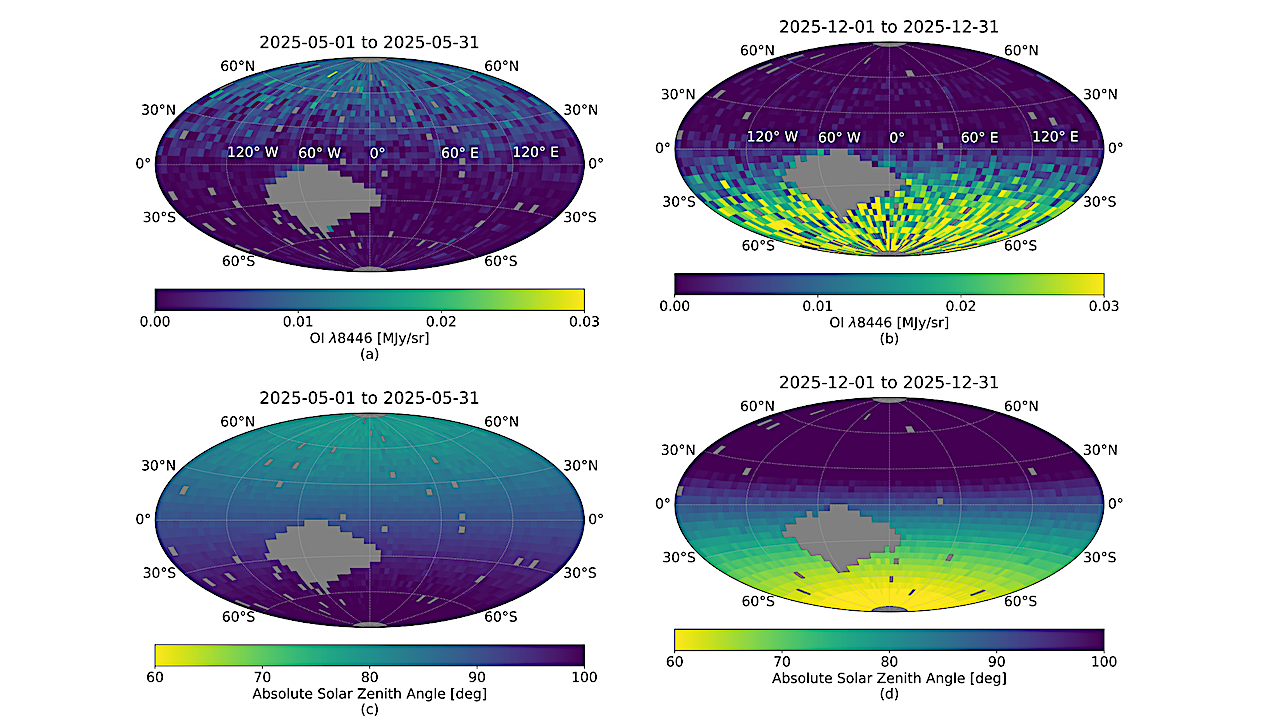
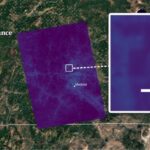
One-month snapshots of the 2-D distribution in terrestrial coordinate of the oxygen emission in (a) May and (b) December 2025. The measured emission is averaged over 31 days in latitude
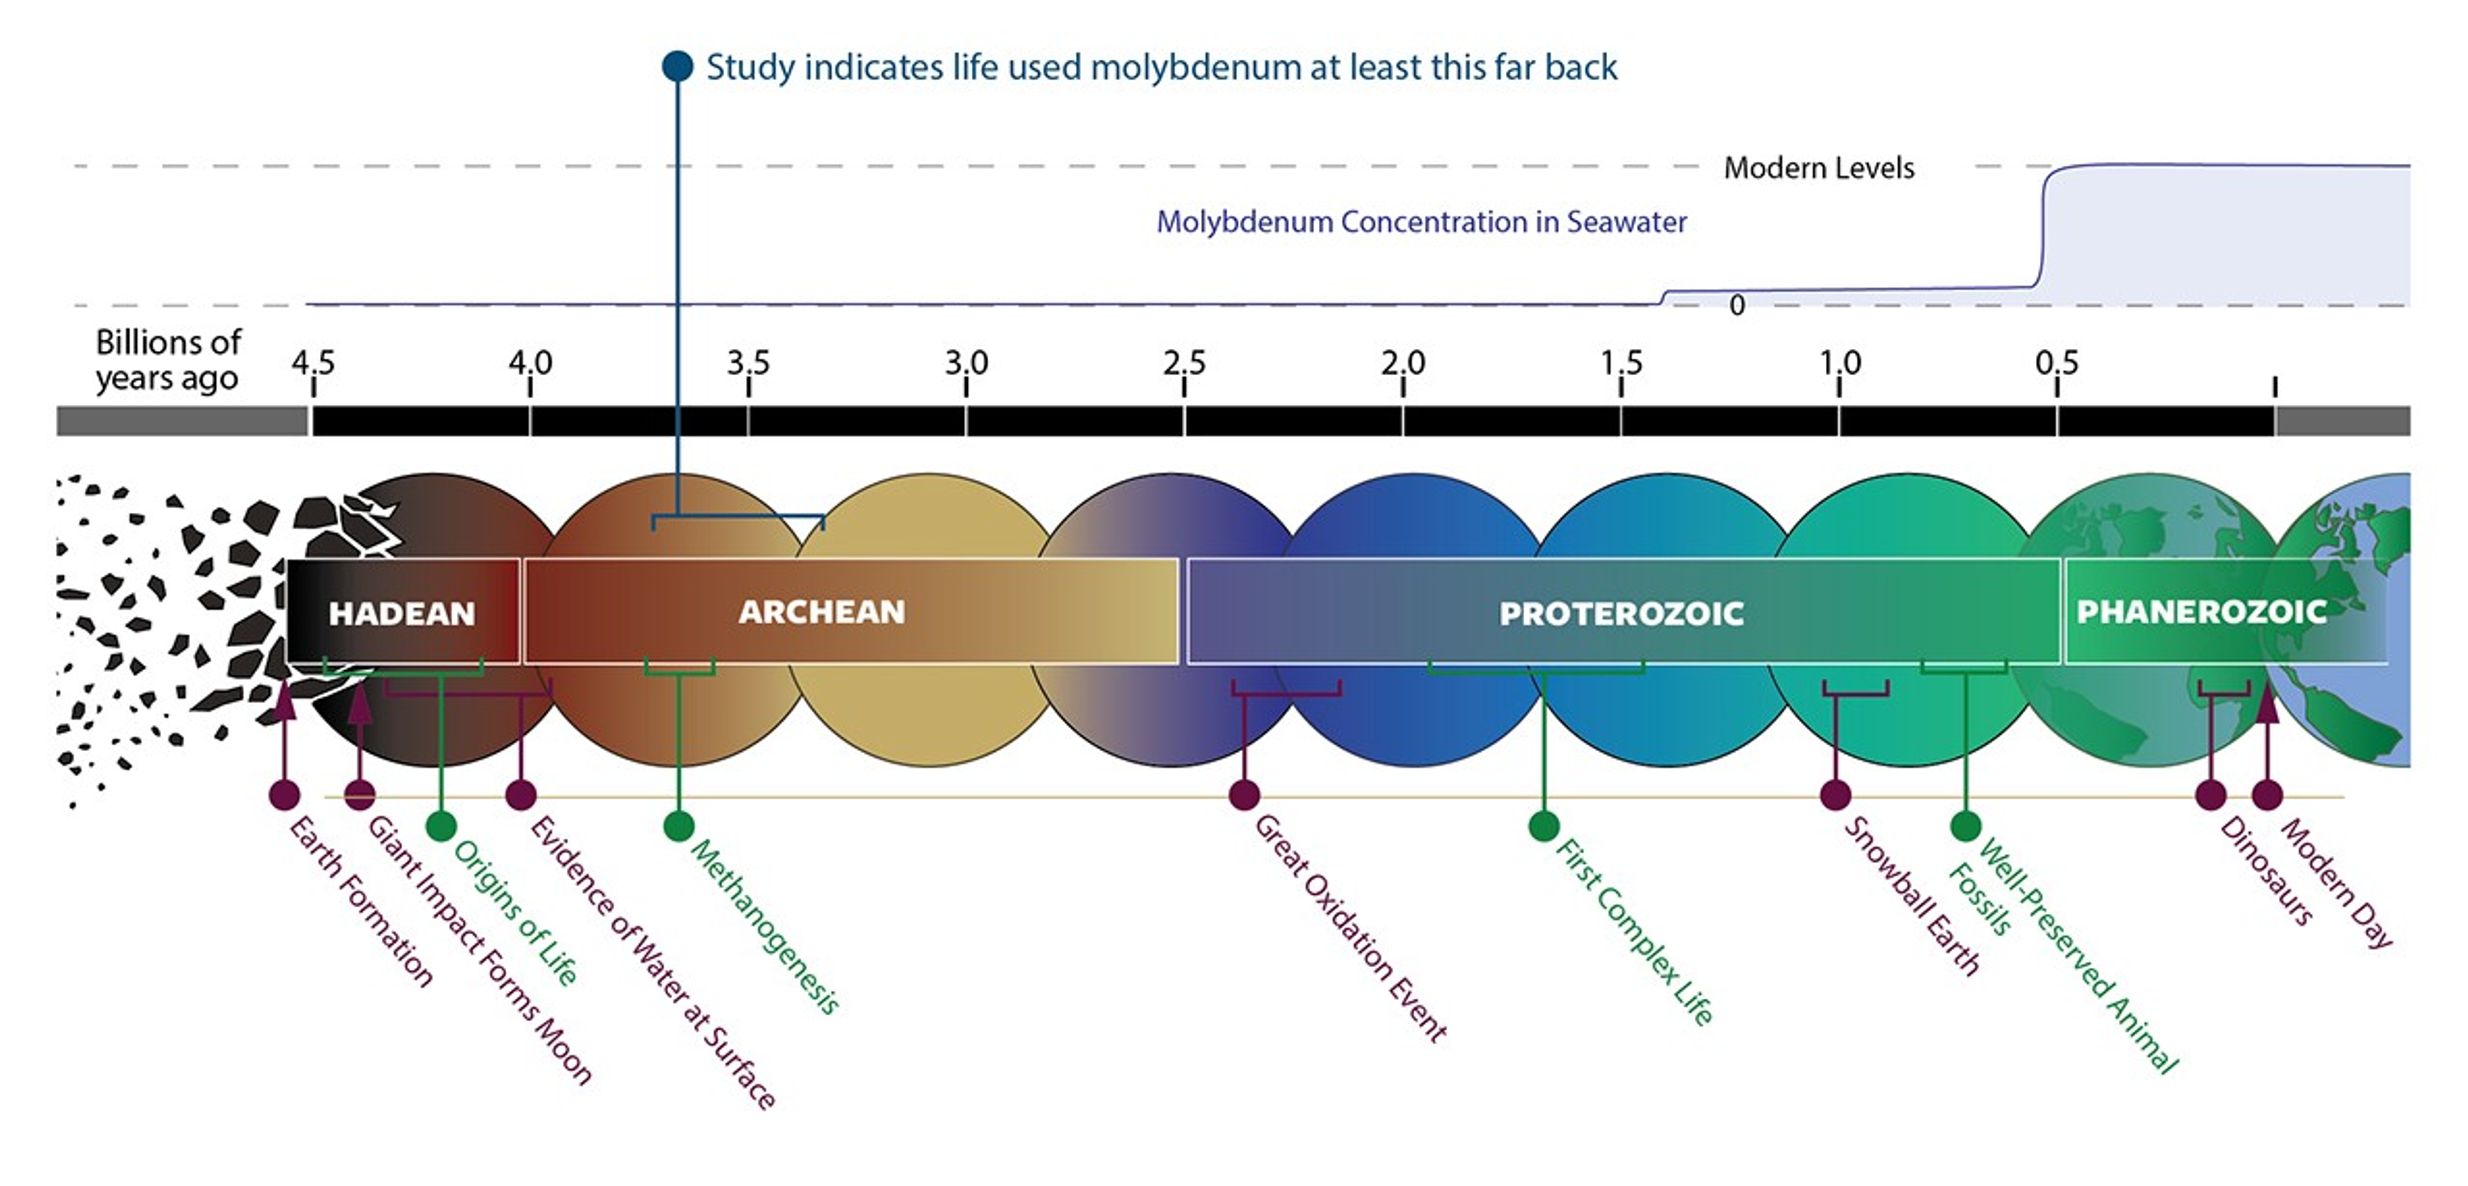
5 min read NASA Research Shows Early Life Relied on Rare Metal Timeline of Earth’s history in billions of years. The new study indicates that life used molybdenum as far
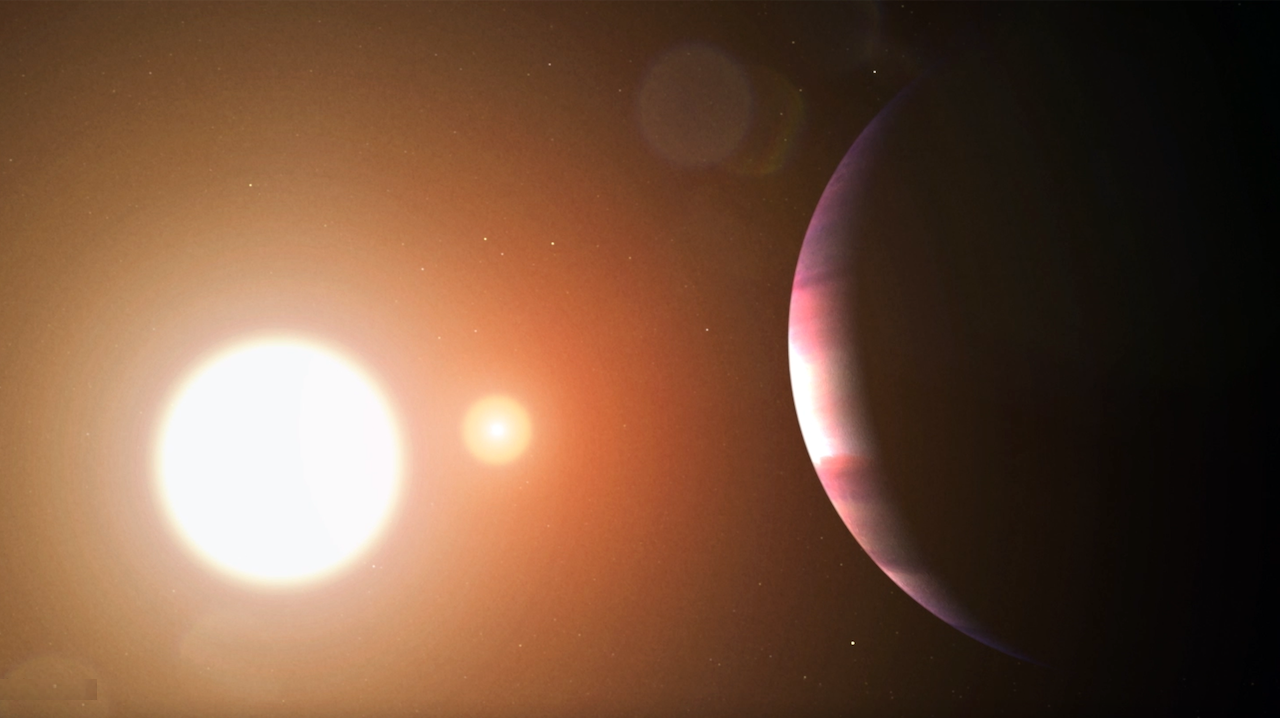
A gas giant planet looms in the foreground at right, illuminated by a pair of stars, in this artist’s concept of a world in a binary system. NASA’s TESS (Transiting

Keith Cowing Biologist, Explorers Club Fellow, ex-NASA Space Biologist and Payload integrator, Editor of NASAWatch.com and Astrobiology.com, Lapsed climber, Explorer, Synaesthete, Former Challenger Center board member 🖖🏻 Follow on Twitter
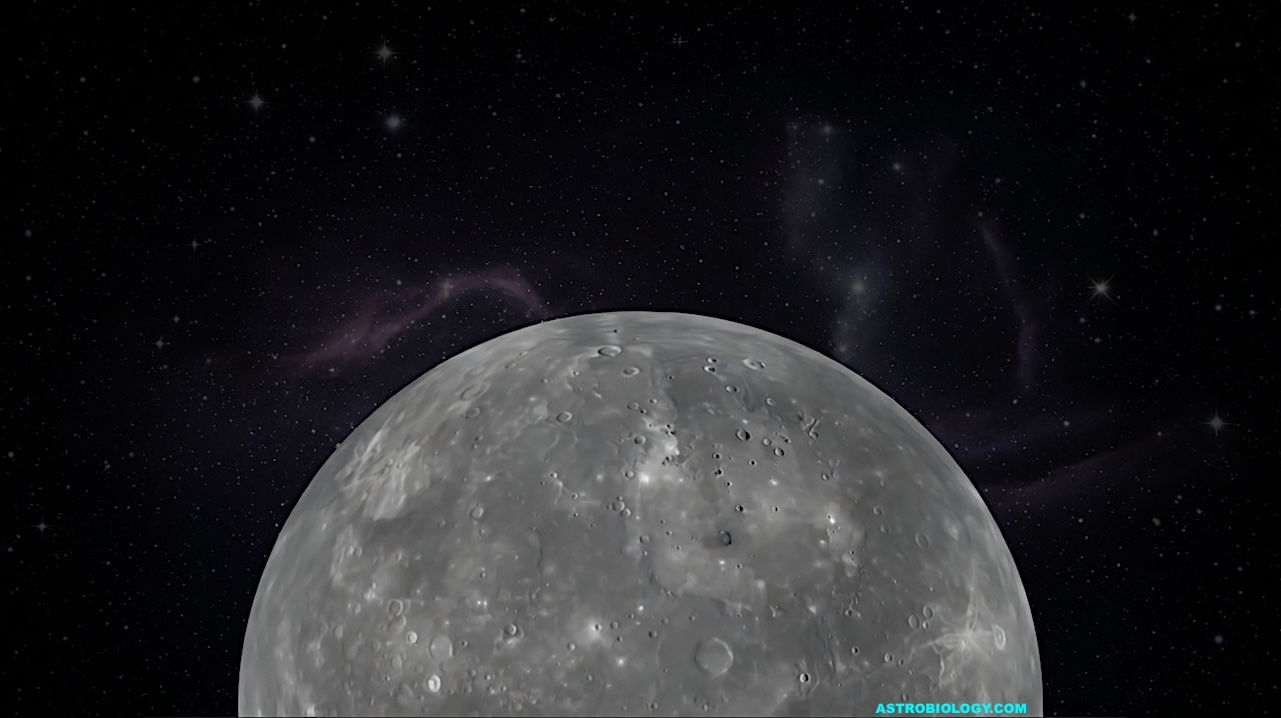
IMAGE – modified image of Mercury using Grok via Astrobiology.com Using MIRI (Mid Infrared Instrument) on board the James Webb Space Telescope (JWST), a team of researchers led by former
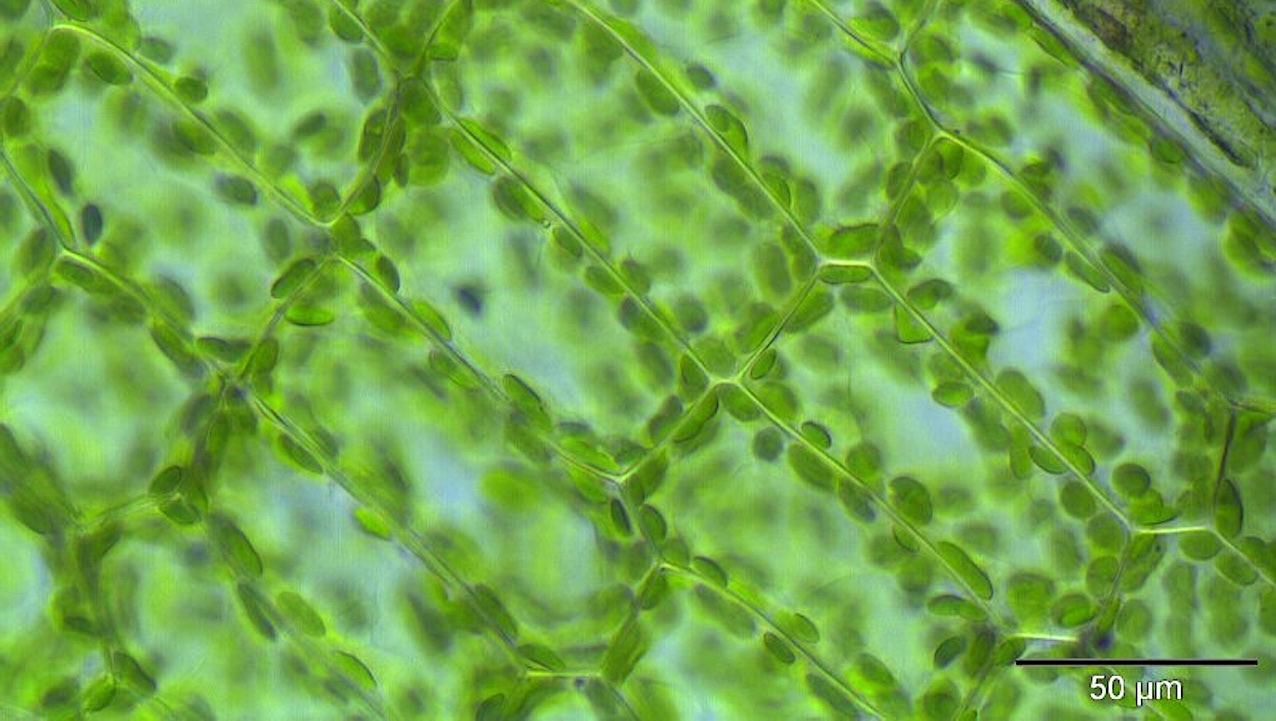
Light micrograph of a moss’s leaf cells at 400X magnification photographed by Kristian Peters CC BY-SA 3.0 Source Cell walls are a crucial structure of plant life, protecting cells from
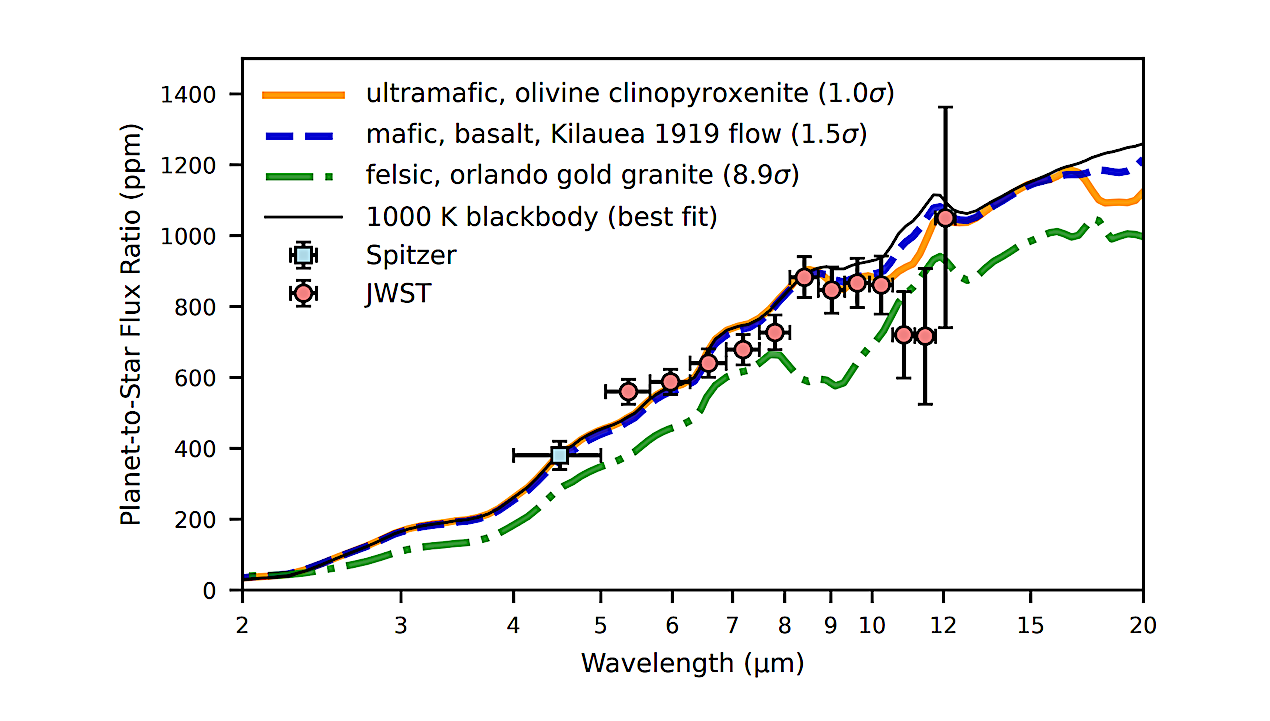
The measured planet-to-star flux ratio as a function of wavelength compared to a range of solid slab surfaces. The observations were taken using Spitzer (blue square-shaped marker) and JWST (red
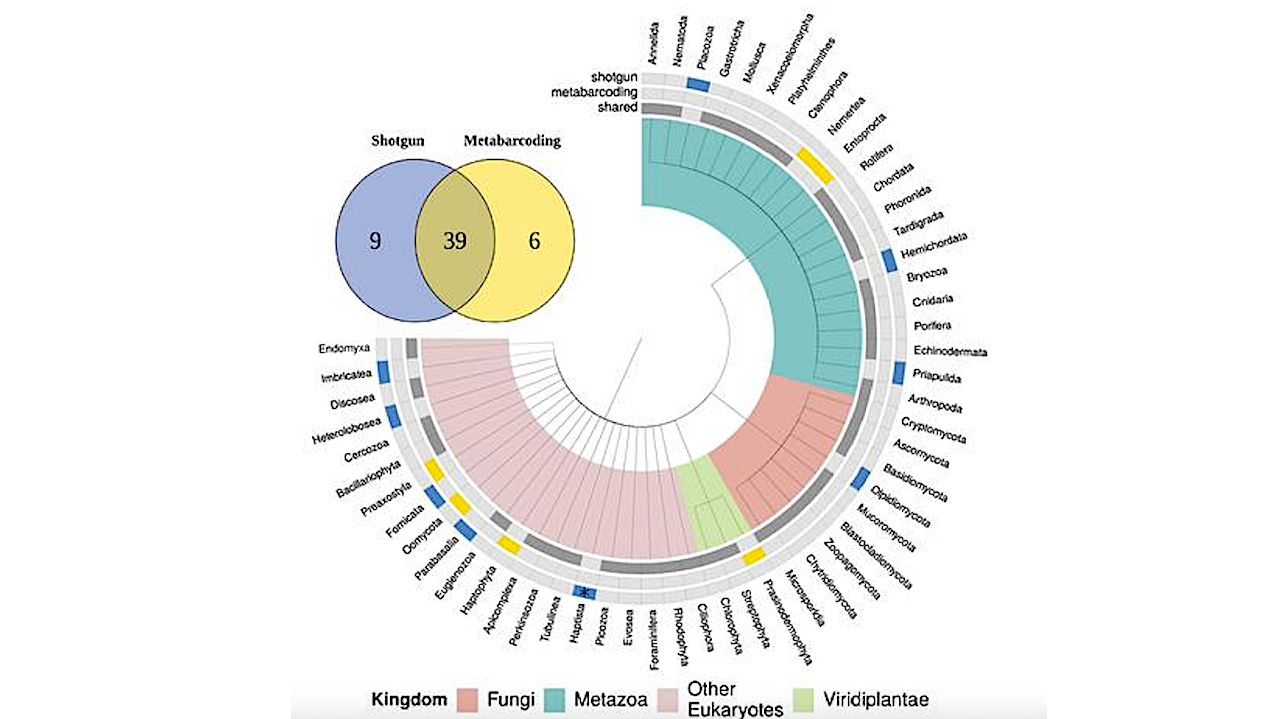
Cladogram of the full set of eukaryotic phyla identified by shotgun sequencing and metabarcoding. Branch colors represent kingdoms (blue, Metazoa; red, Fungi; green, Viridiplantae; pink, other eukaryotes). Three surrounding rings
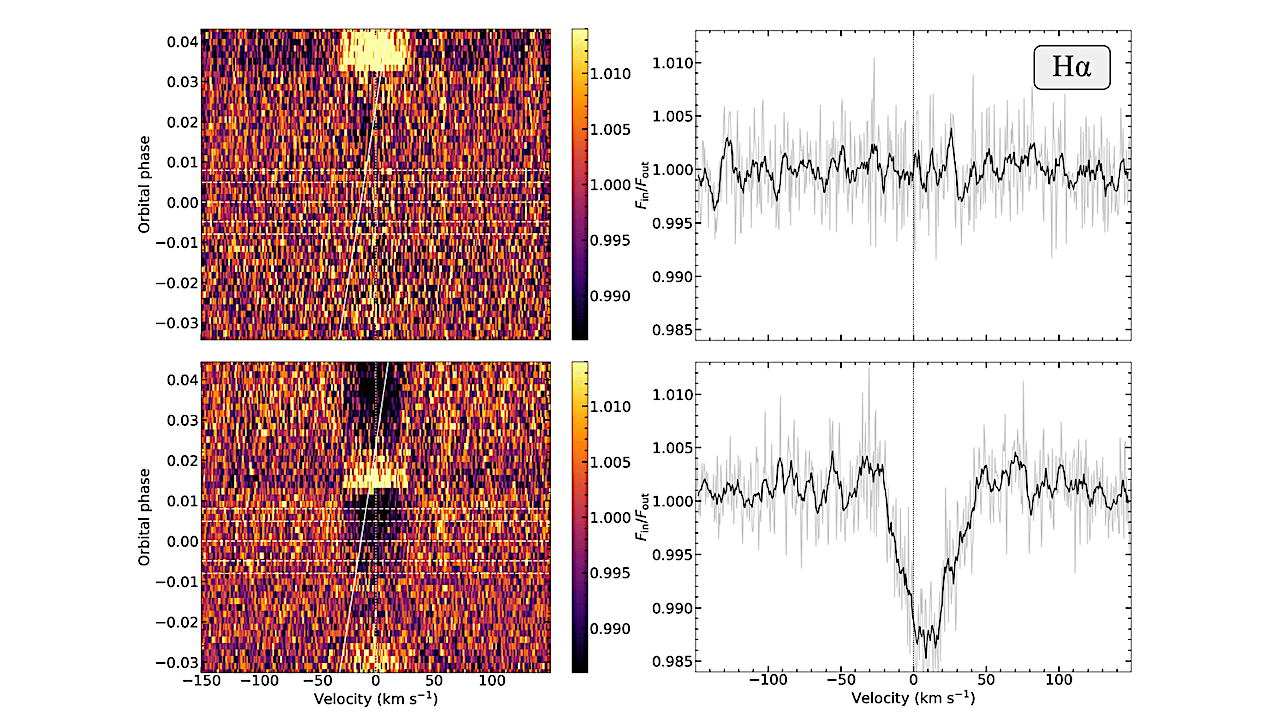
Left: T1 (top) and T2 (bottom) tomography maps in the stellar rest frame around the Hα line. A 3-pixel moving average was applied along the velocity axis to smooth the