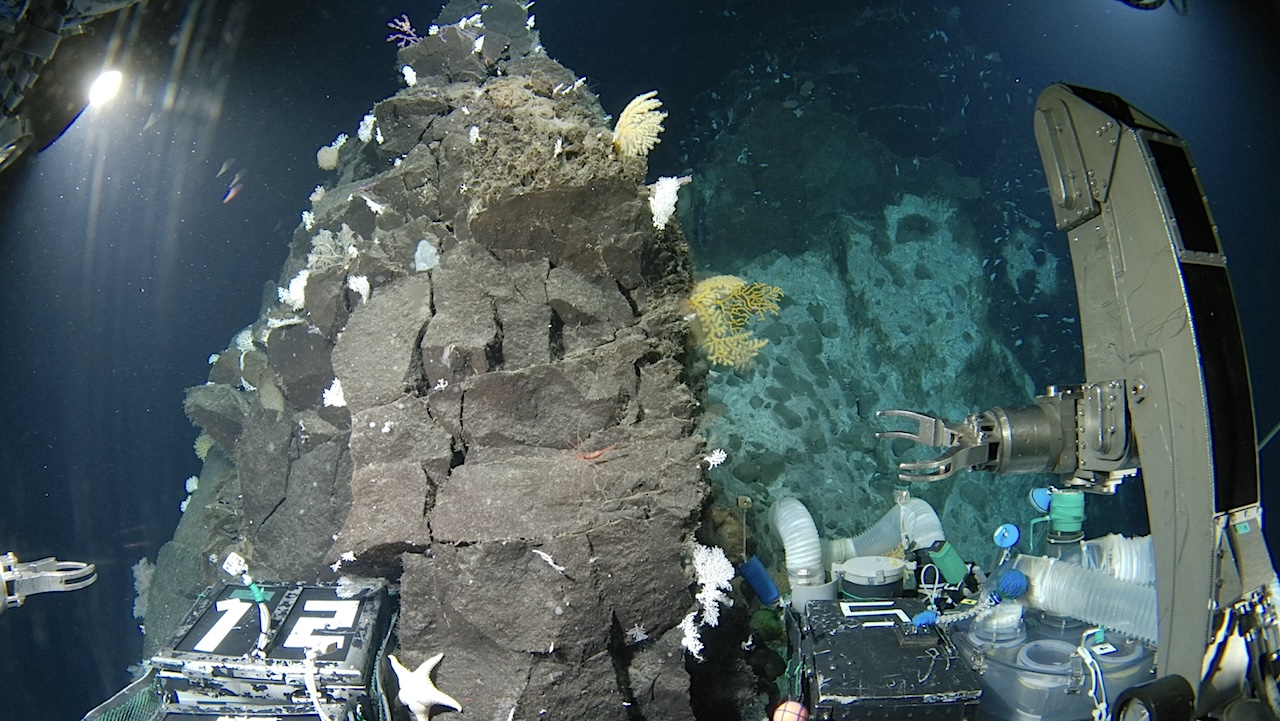
Credit: The Nippon Foundation-Nekton Ocean Census/©JAMSTEC Japan has led a major international effort to explore and document new life in the deep ocean. Following the Nippon Foundation–Nekton Ocean Census Expedition

Credit: The Nippon Foundation-Nekton Ocean Census/©JAMSTEC Japan has led a major international effort to explore and document new life in the deep ocean. Following the Nippon Foundation–Nekton Ocean Census Expedition
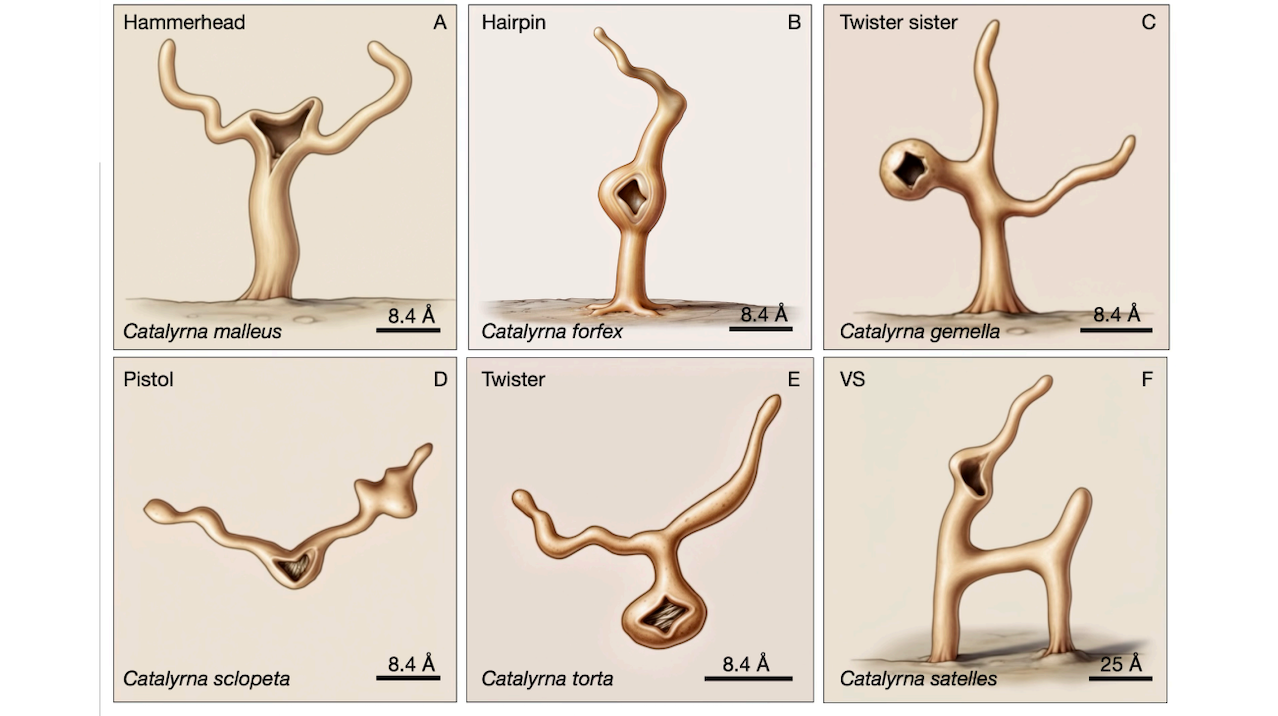
Artistic renderings of representative small self-cleaving ribozymes. Structures are shown in their native, substrate-free, trans-acting forms to emphasize intrinsic architectural organization rather than the catalytic conformation adopted during cleavage. Each
Space-based Sunshade – University of Innsbruck An international research team including Stefan Kimeswenger, astrophysicist at the University of Innsbruck, has tested a new approach to studying Earth-like exoplanets. The idea
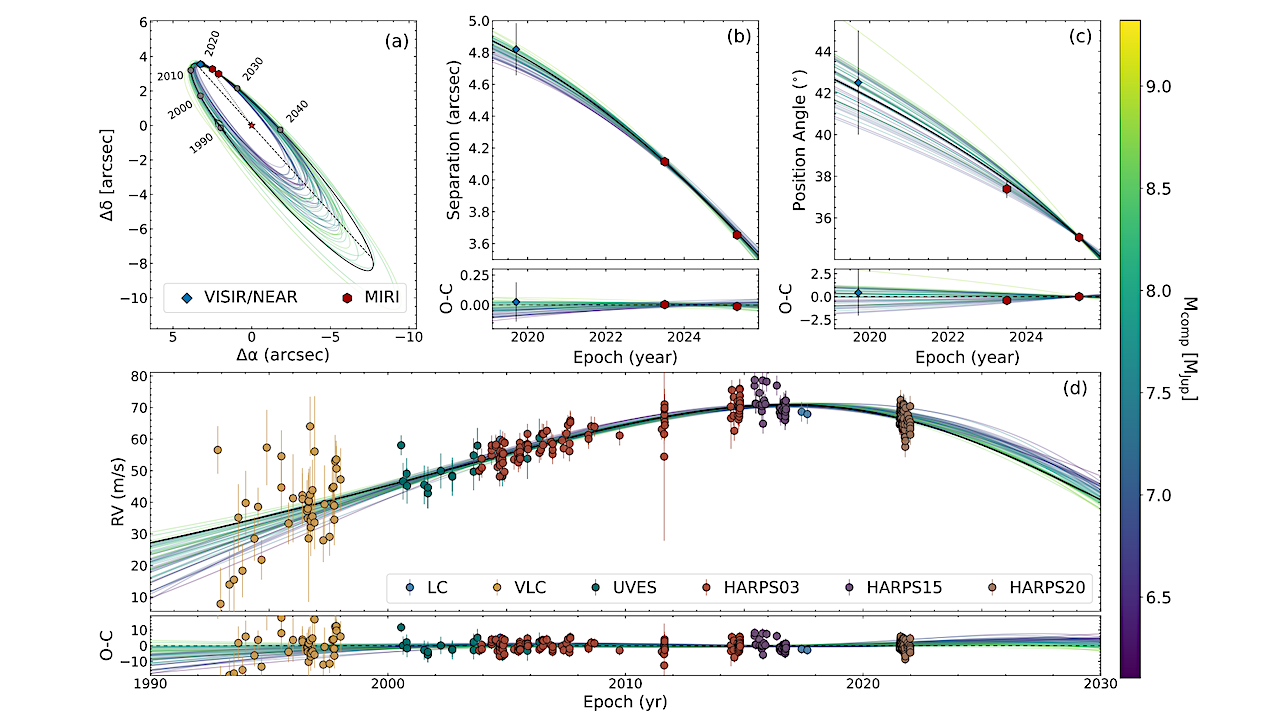
Best-fit orbit solutions. Here we show the on-sky orbit traced by Eps Ind Ab in panel (a); the evolution of on-sky separation and position angle of the planet during our
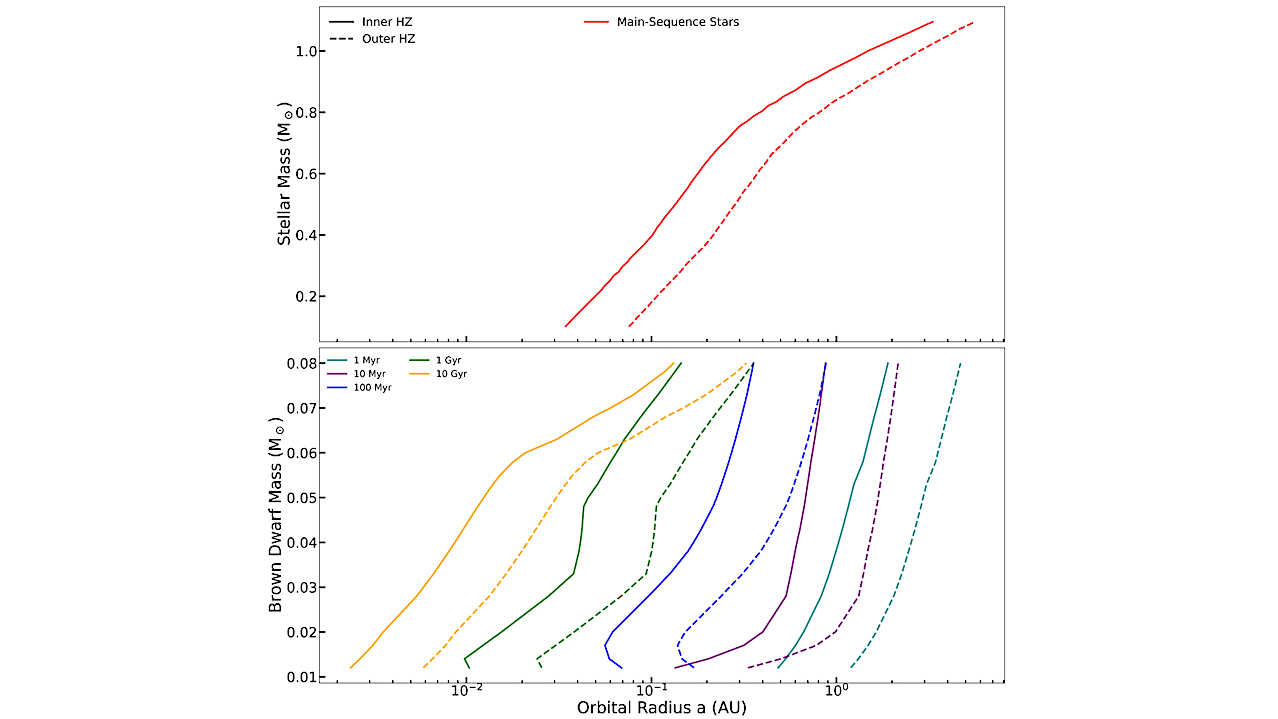
The top panel are the inner and outer HZ limits for main-sequence stars as a function of stellar mass, according to (R. K. Kopparapu et al. 2013). The bottom panel
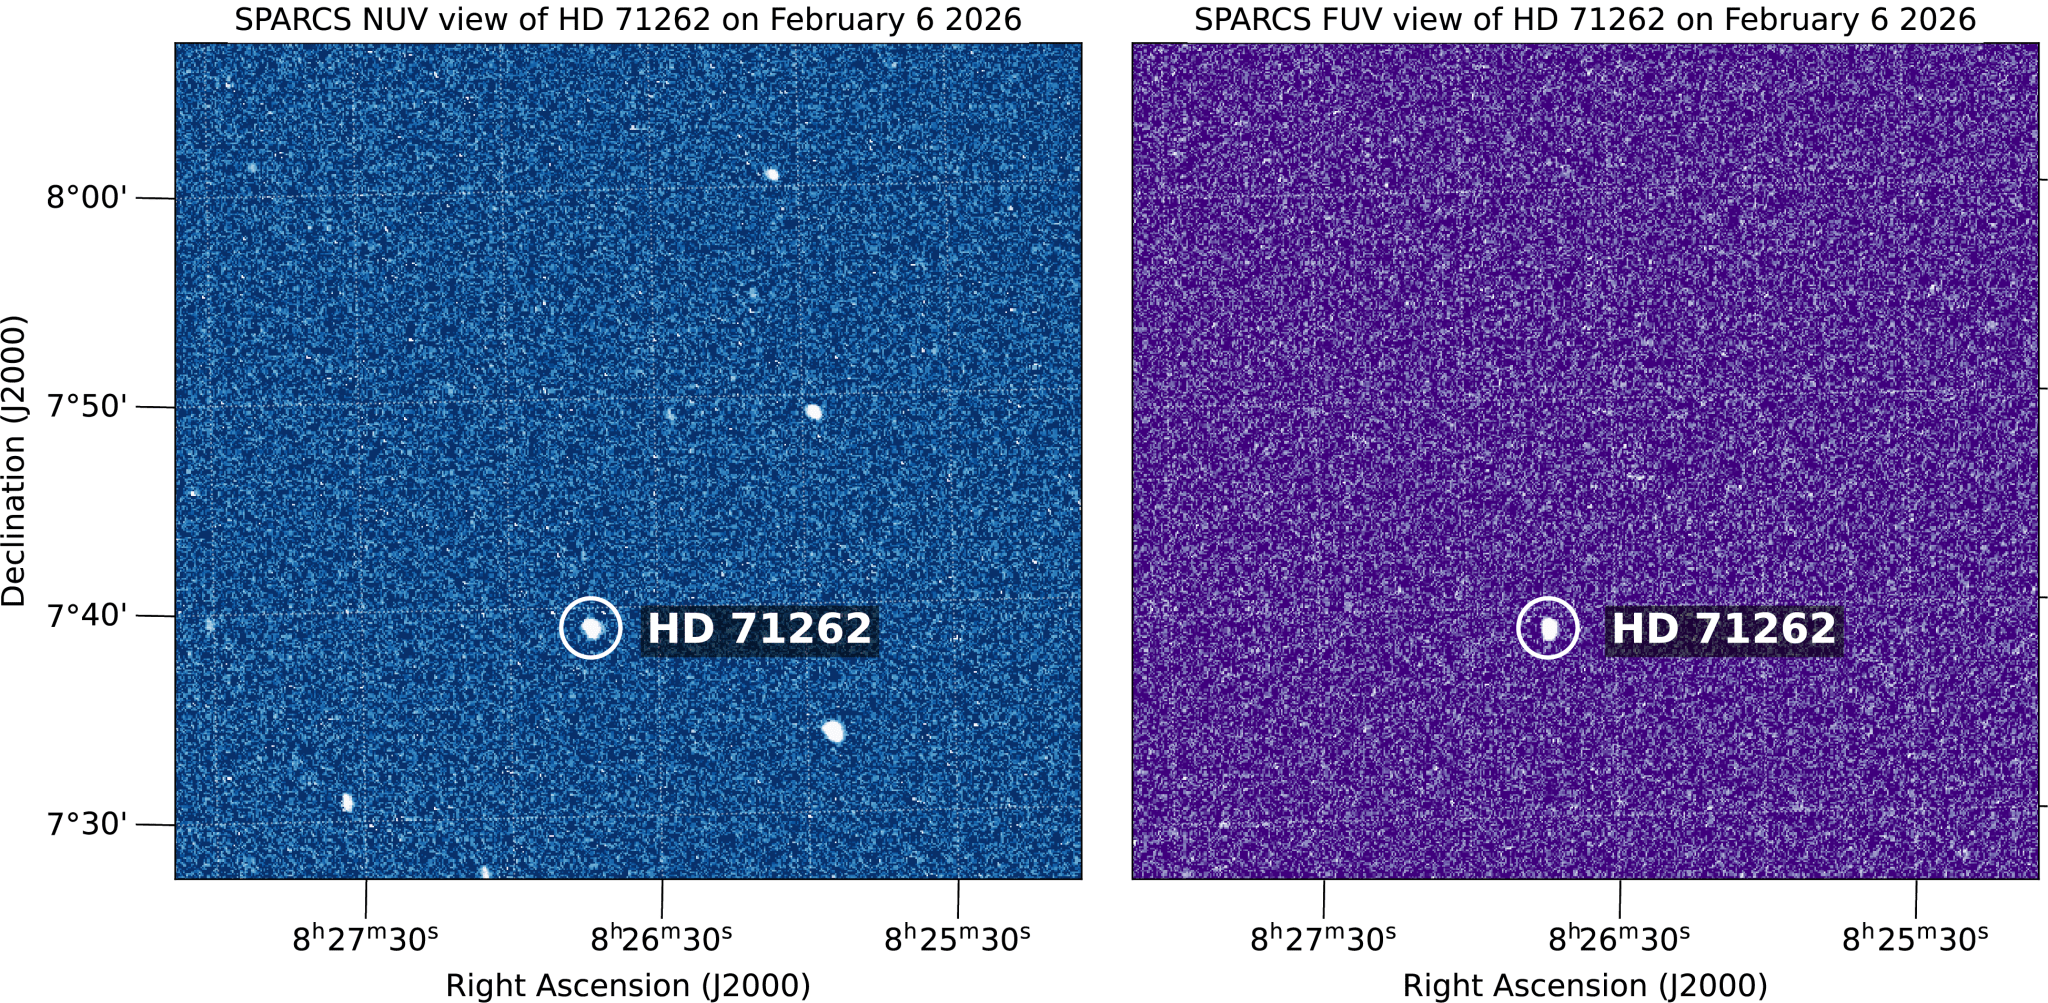
This pair of images shows stars observed Feb. 6, 2026, by the SPARCS space telescope simultaneously in the near-ultraviolet, left, and far-ultraviolet, right. The fact that one star is seen
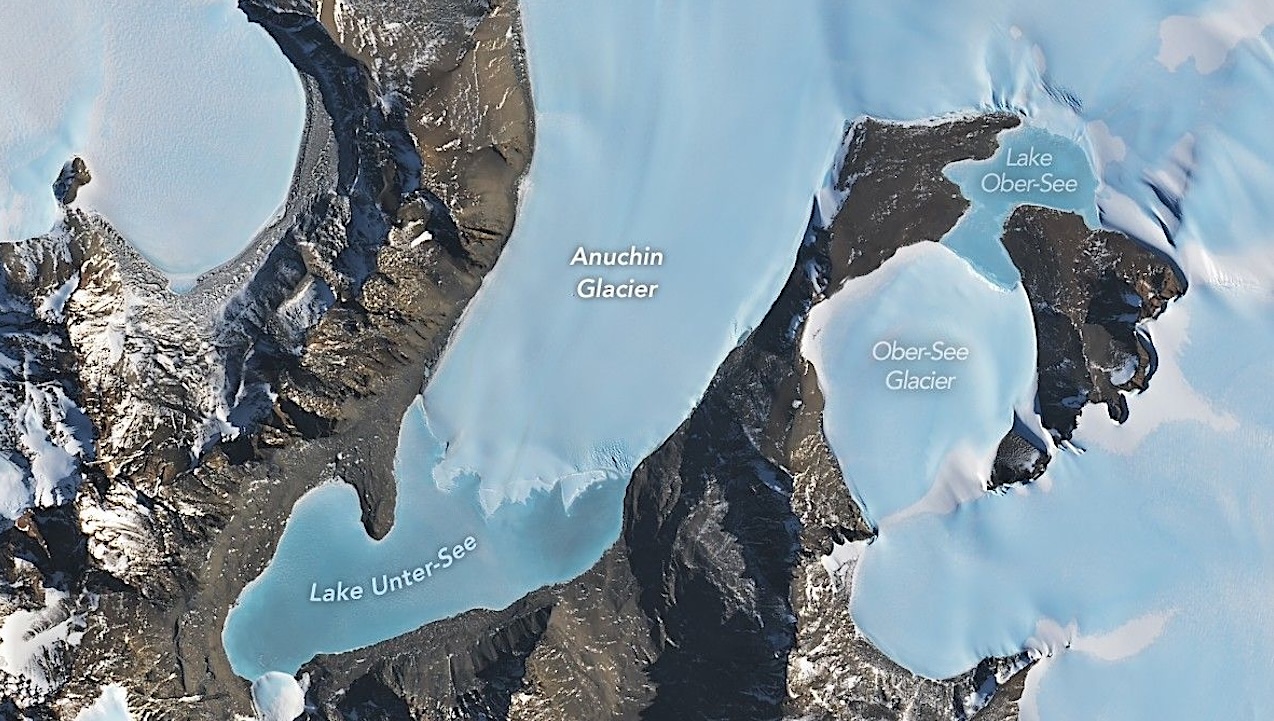
Lake Untersee, Antarctica and surrounding features – NASA/Google Earth Scientists estimate that Earth is home to more than 100 million lakes. Among the most unusual is Lake Untersee, one of
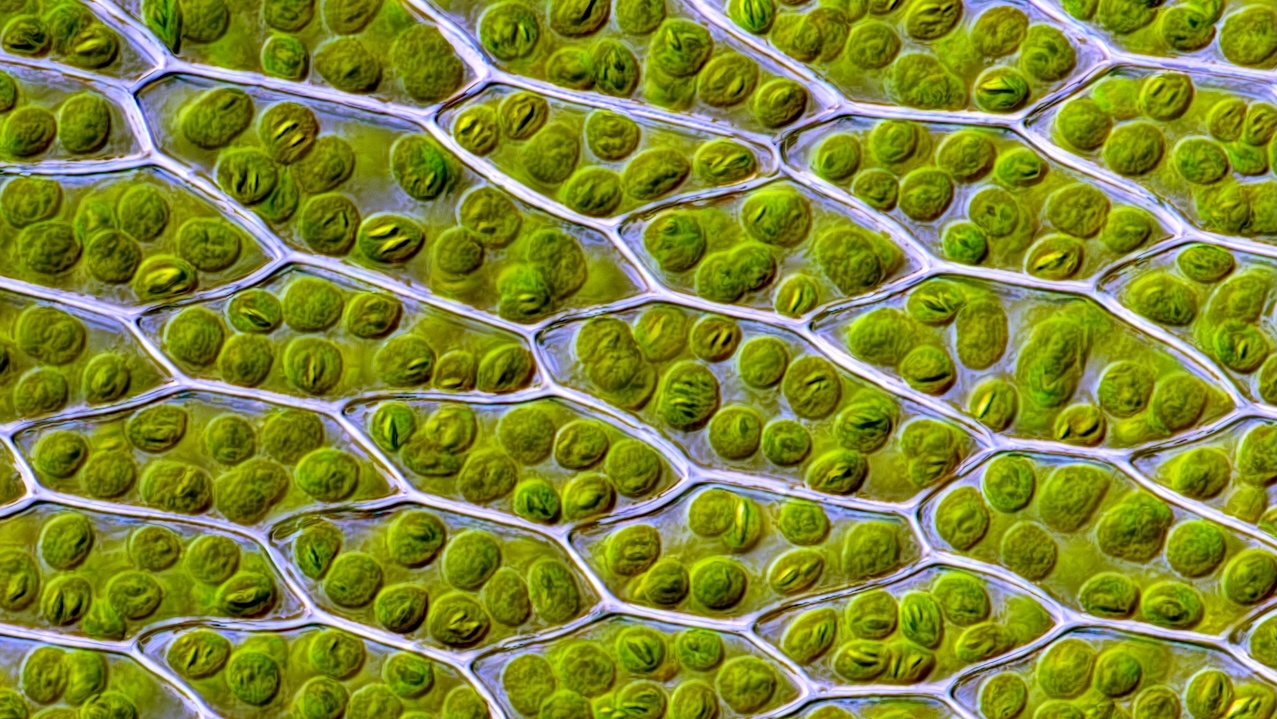
Live leaf cells of the moss Bryum capillare, showing abundant chloroplasts (green spherical bodies) and their accumulated starch granules (elongated bodies within chloroplasts). CC BY-SA 4.0 Wikipedia Research led by

The sulfur compounds give the “yellow vent” at Kueishantao, Taiwan, its characteristic yellow color. Prof. Li-Lian Liu and her research group, Department of Oceanography, National Sun Yat-sen University, Kaohsiung, Taiwan

Snowball Earth — Grok via Astrobiology.com A new study led by researchers at the Earth-Life Science Institute (ELSI) at Institute of Science Tokyo challenges a long-standing assumption about Earth’s most