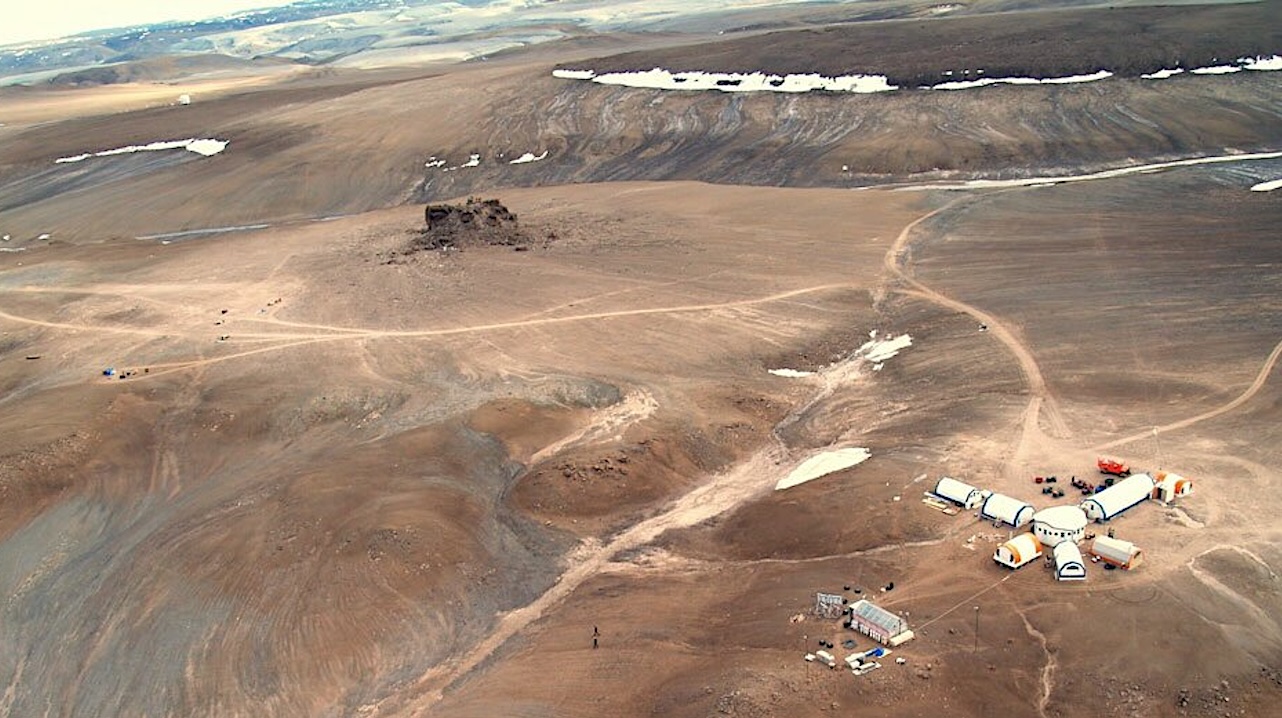
Haughton-Mars Project Base Camp – Haughton Crater, Nunavut, Canada — Mars Institute Analog environments are terrestrial environments that resemble extraterrestrial sites; this concept originated in space sciences for defining methods

Haughton-Mars Project Base Camp – Haughton Crater, Nunavut, Canada — Mars Institute Analog environments are terrestrial environments that resemble extraterrestrial sites; this concept originated in space sciences for defining methods
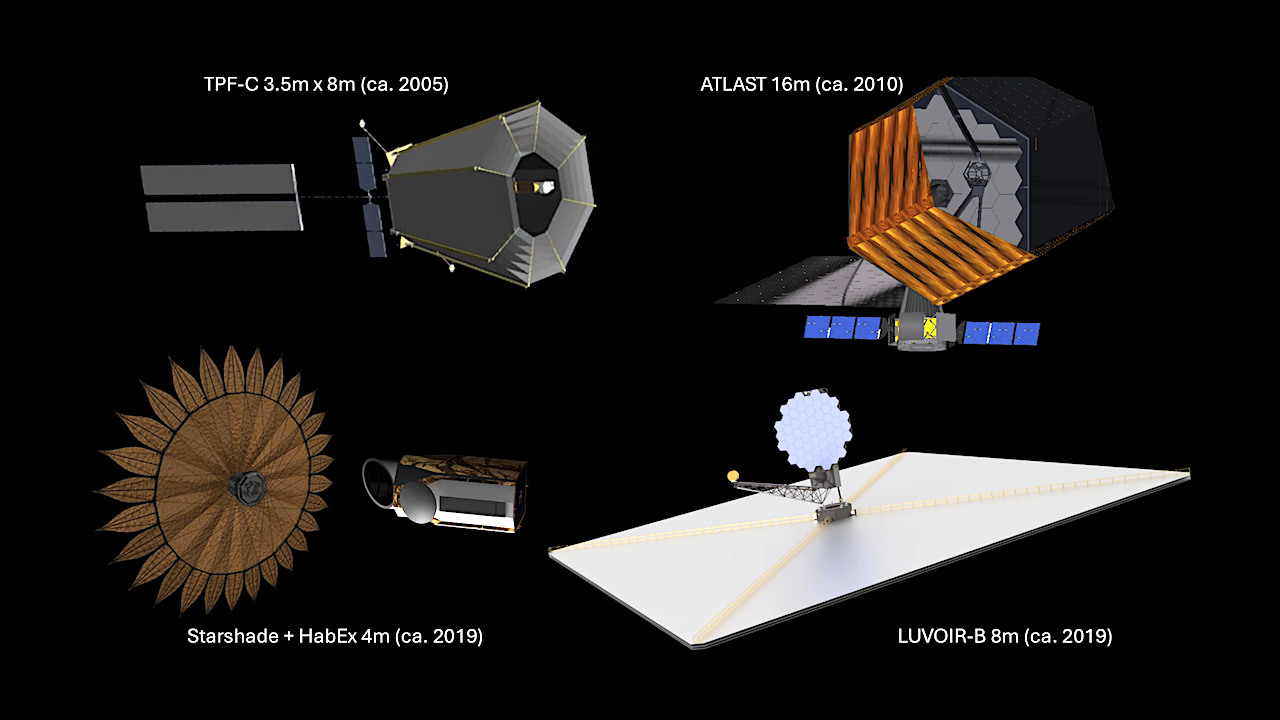
Concept drawings of four of the large-aperture direct imaging space telescopes envisioned and studied over the past 25 years. Note that the separation depicted here between the starshade and the
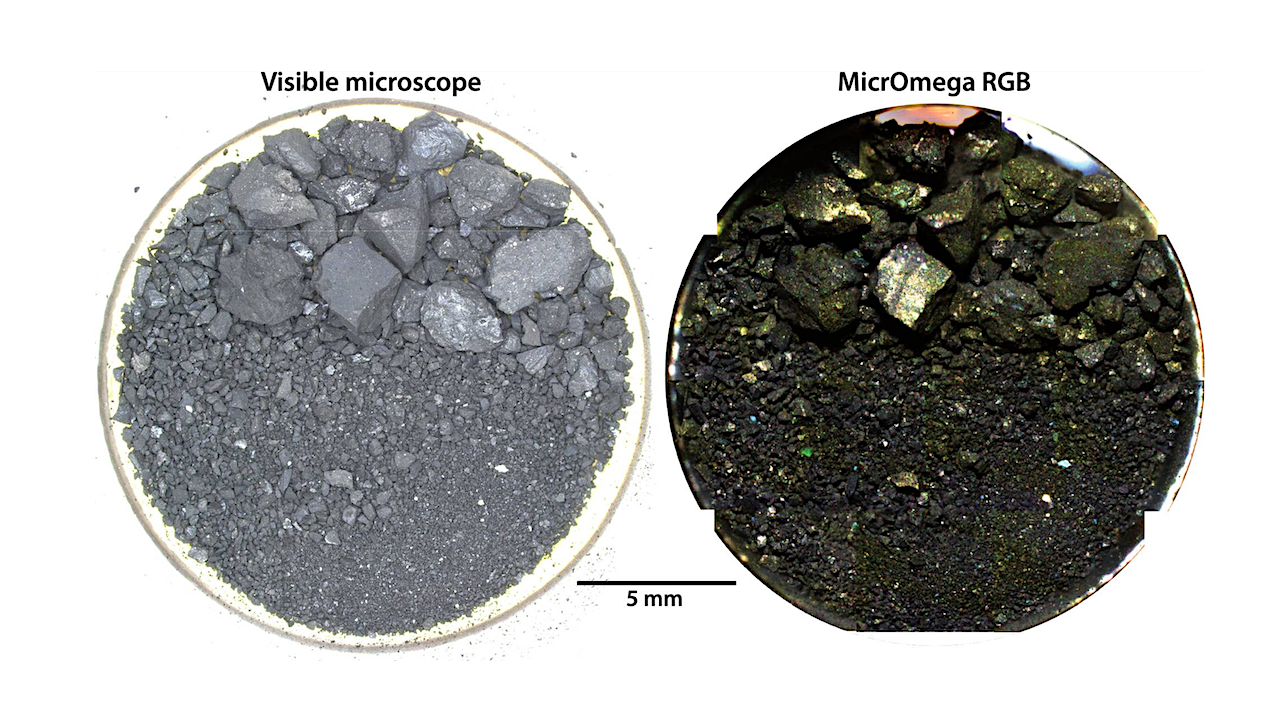
Bulk ORX-29000 observed by the Leica visible microscope and by the MicrOmega IR hyperspectral microscope (Mosaic of RGB composite images). The following wavelengths are used for the MicrOmega RGB image:
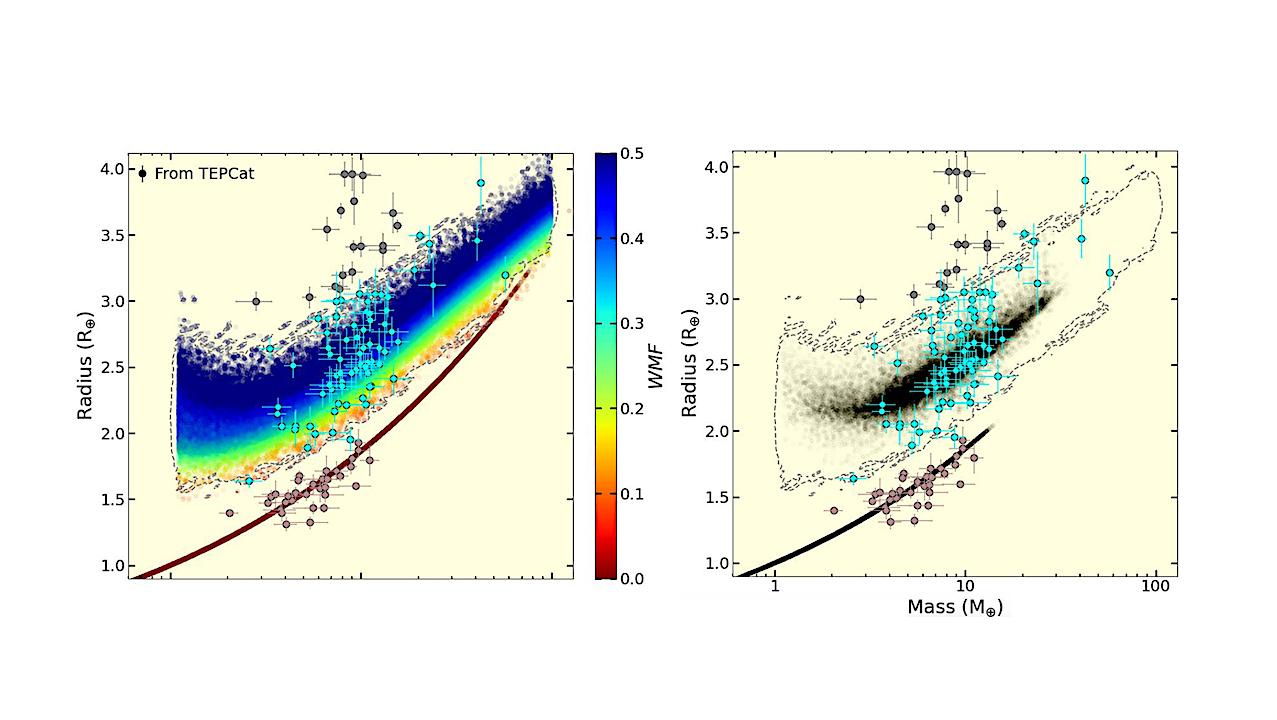
Mass–radius distribution of planets from Model I compared with the observed planets around G-type host stars from the TEPCat catalog Southworth (2011). Top: Weighted mass–radius distribution of simulated rocky planets
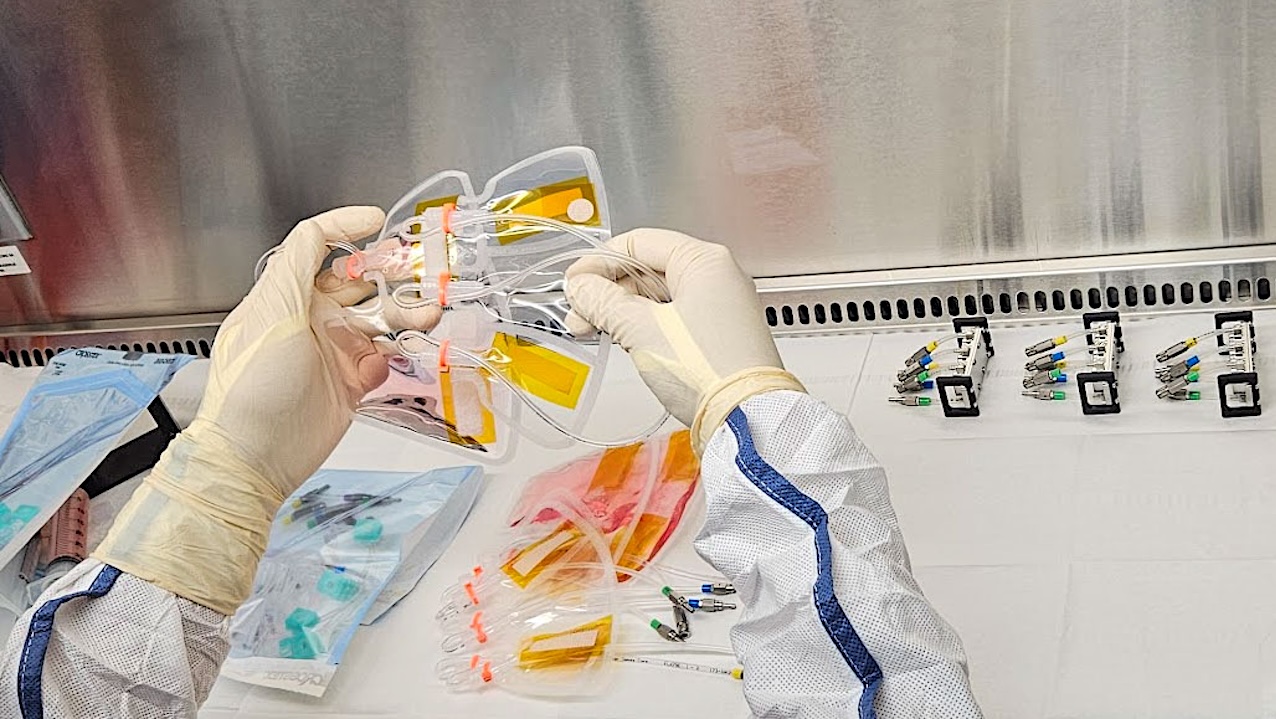
An image shows the culture medium bags during preflight testing as part of the MVP Cell-09. Credit. University of Alabama at Birmingham. Date Created:2026-01-29 Larger image This investigation aims to
In the eastern Utah desert, carbon-dioxide-saturated water bubbles, sprays and foams from the ground. These cold-water geysers, sometimes called soda pop geysers, are a new and reliable Earth-based analog for
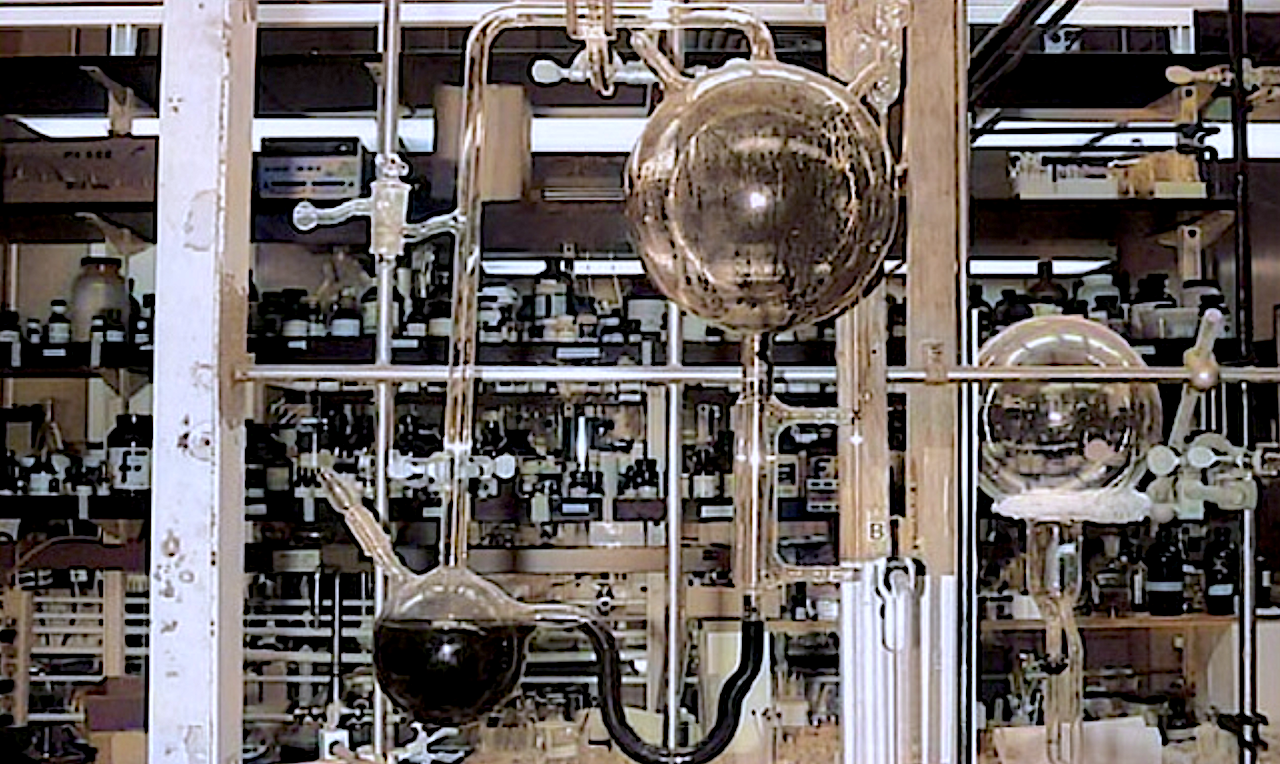
The Miller-Urey experiment that was used to demonstrate the synthesis of biologically relevant molecules in a hypothetical primitive reducing atmosphere. — UCSD (colorized) Creating a man‐made life in the laboratory
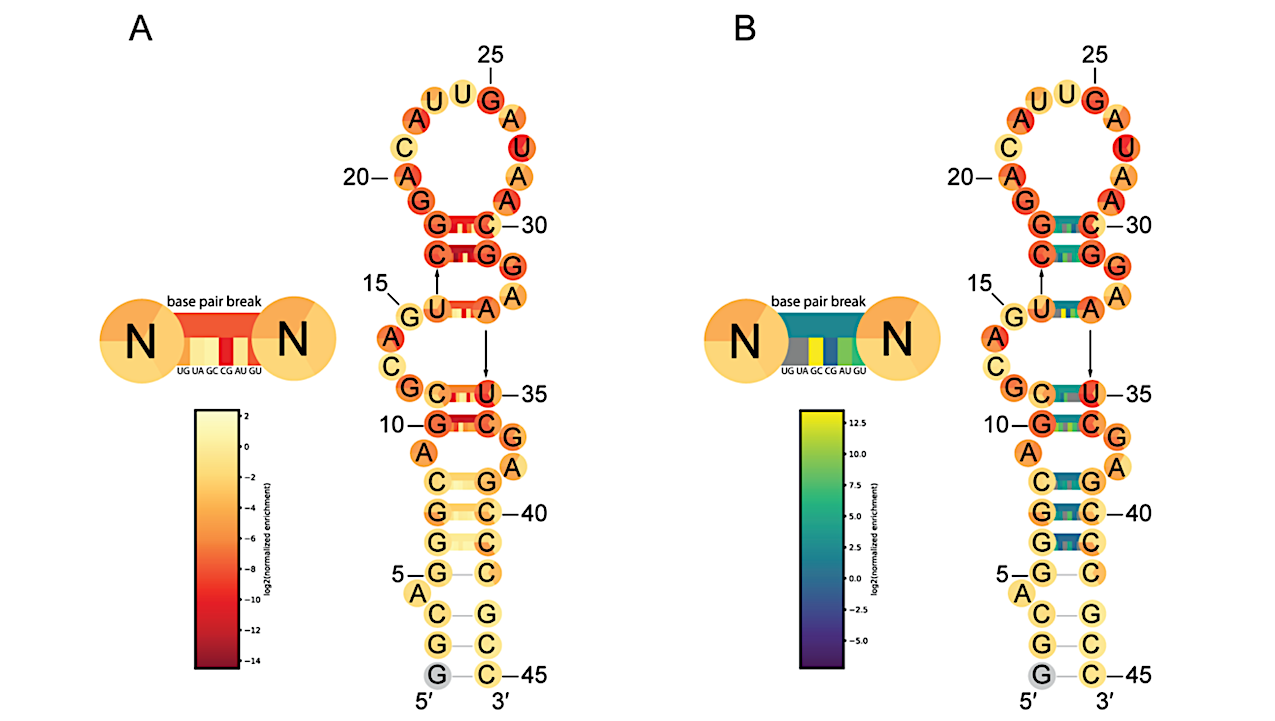
Predicted secondary structure of QT45 ribozyme with nucleotide color corresponding to fitness for each of the three possible single mutations at each position, displayed in the same order as the
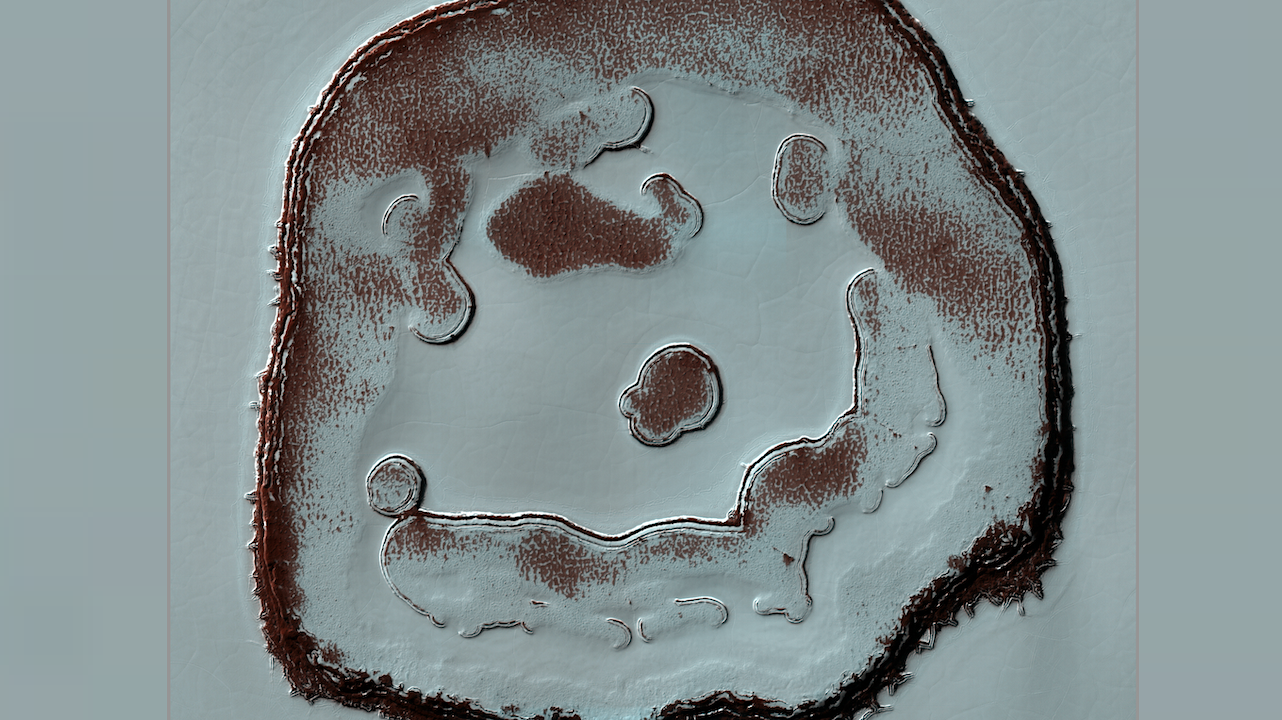
ID: ESP_067414_0945 date: 13 December 2020 altitude: 247 km NASA/JPL-Caltech/University of Arizona larger image We’ve monitored the so-called Happy Face Crater in the South Polar region of Mars for over
NASA Astrobiology Expedition 3 to Mars — Astrobiology.com On Monday, February 23, 2026 at 12 pm Eastern Time, the planetary science division will host a webinar overview of program element