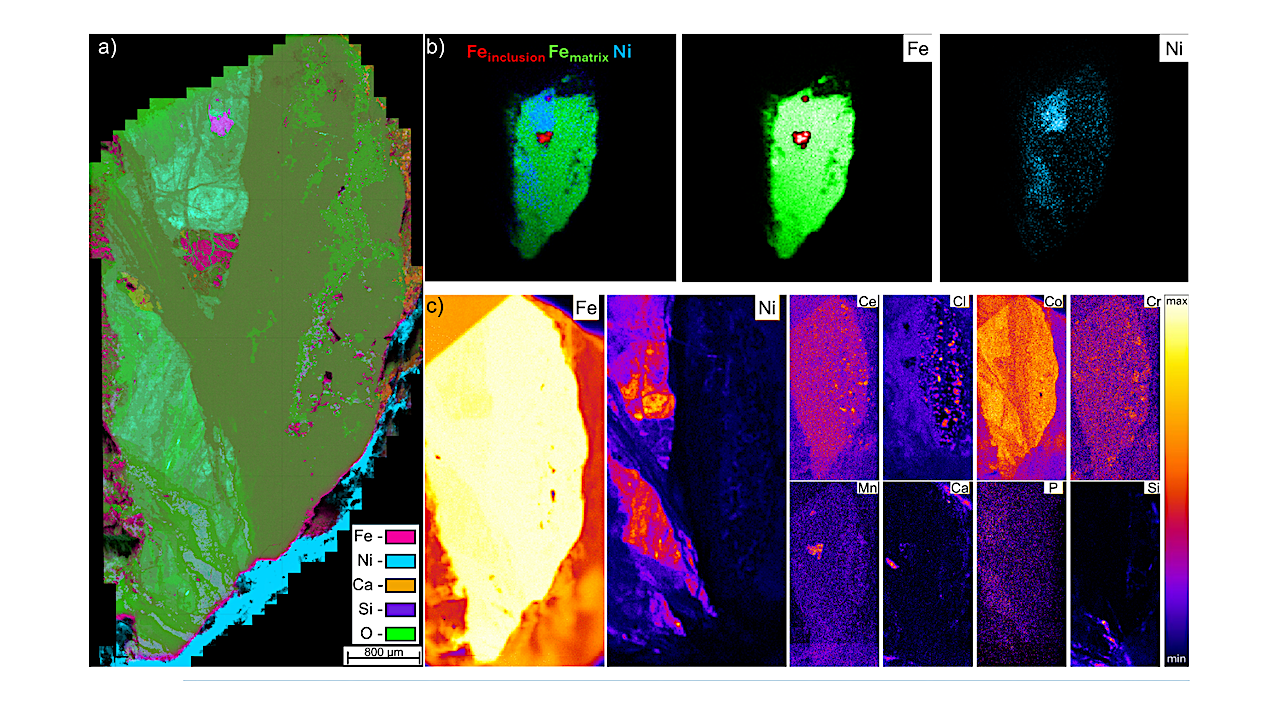
a) Large area EDS map of Nantan meteorite sample showing the distribution of detected elements. b) XPS SnapMaps of Nantan fragment showing the distribution of Fe and Ni. c) XRF

a) Large area EDS map of Nantan meteorite sample showing the distribution of detected elements. b) XPS SnapMaps of Nantan fragment showing the distribution of Fe and Ni. c) XRF

The Dyson Minds 2025 Workshop The Dyson Minds 2025 Workshop, held at the Center for Brains, Minds & Machines at MIT and organized by Penn State, MIT, and The Ultraintelligence
Following NASA’s Artemis II mission successfully splashing down on Earth, engineers started diving into detailed analysis of data to assess how key systems and subsystems on the Orion spacecraft, SLS
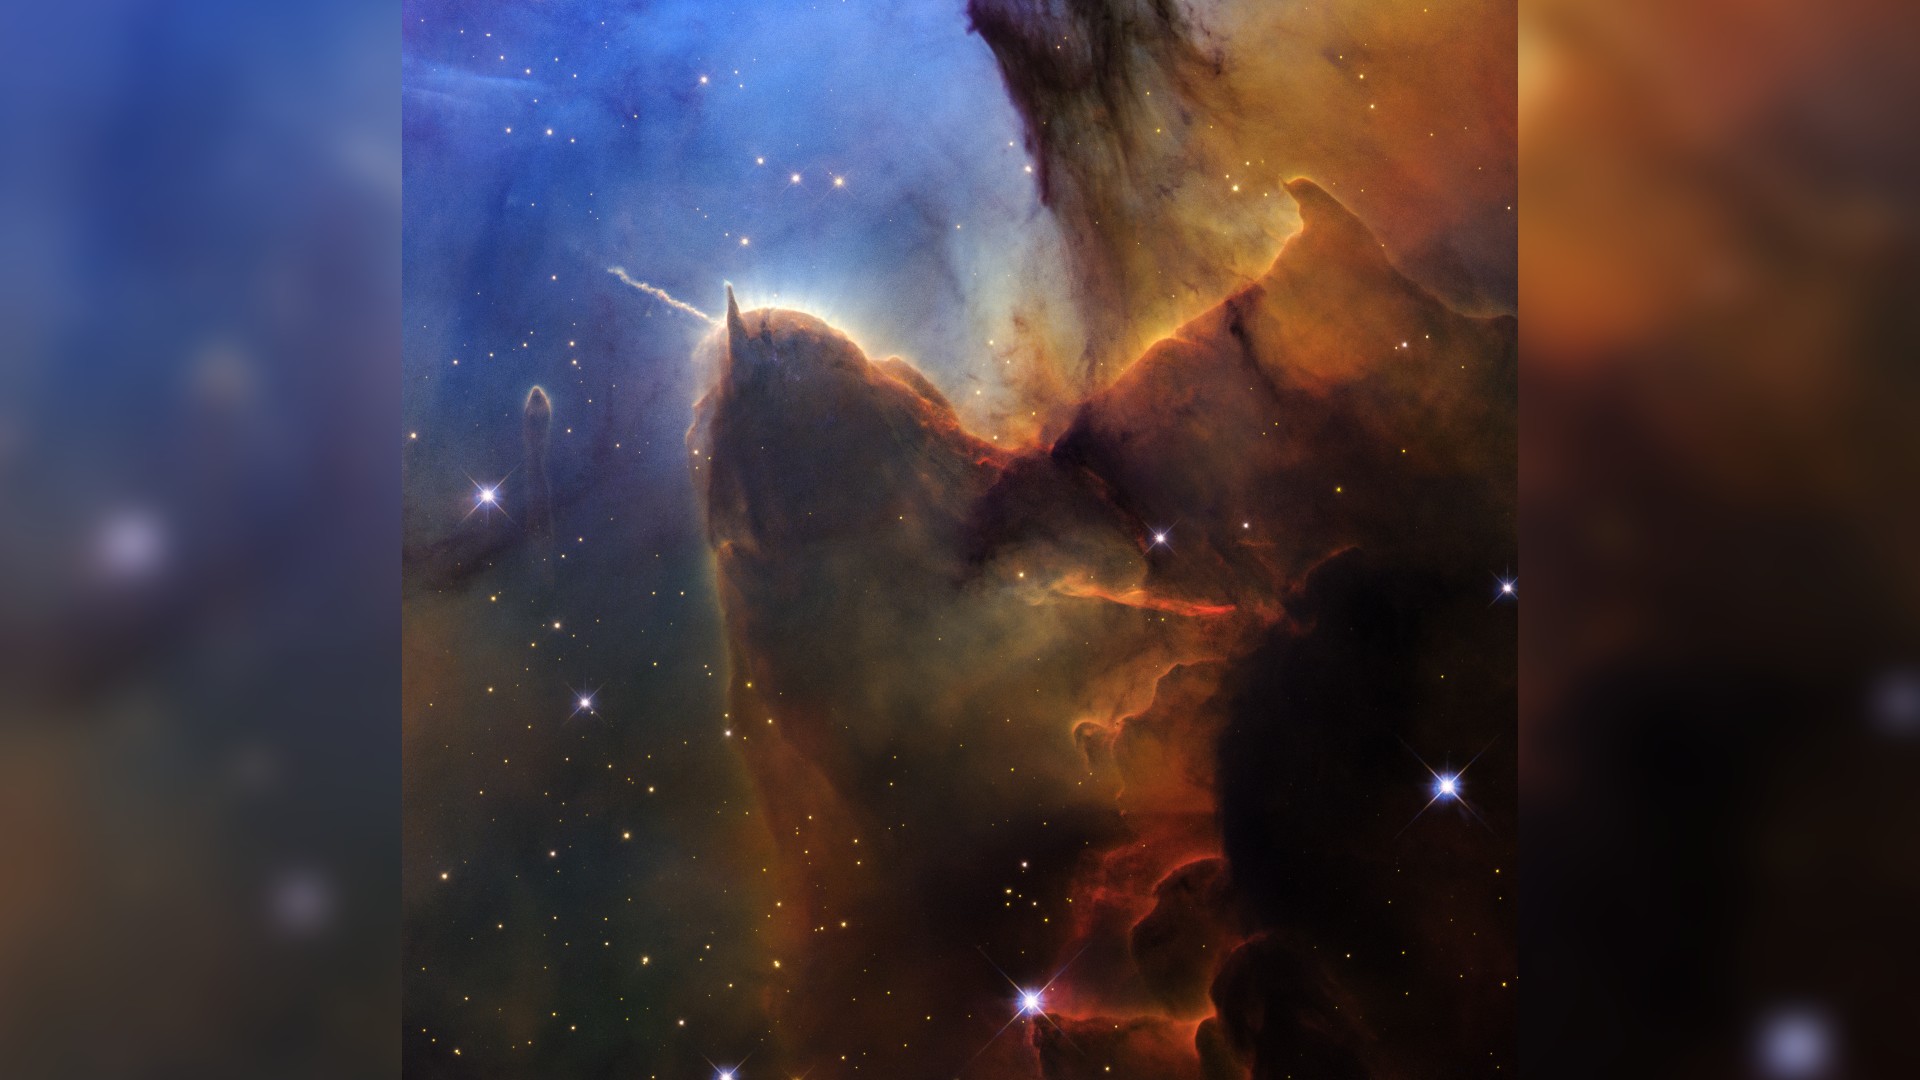
NASA celebrates Hubble’s 36th anniversary with a new image of the Trifid Nebula, a star-forming region it first captured in 1997. (Image credit: NASA, ESA, STScI; Image Processing: Joseph DePasquale
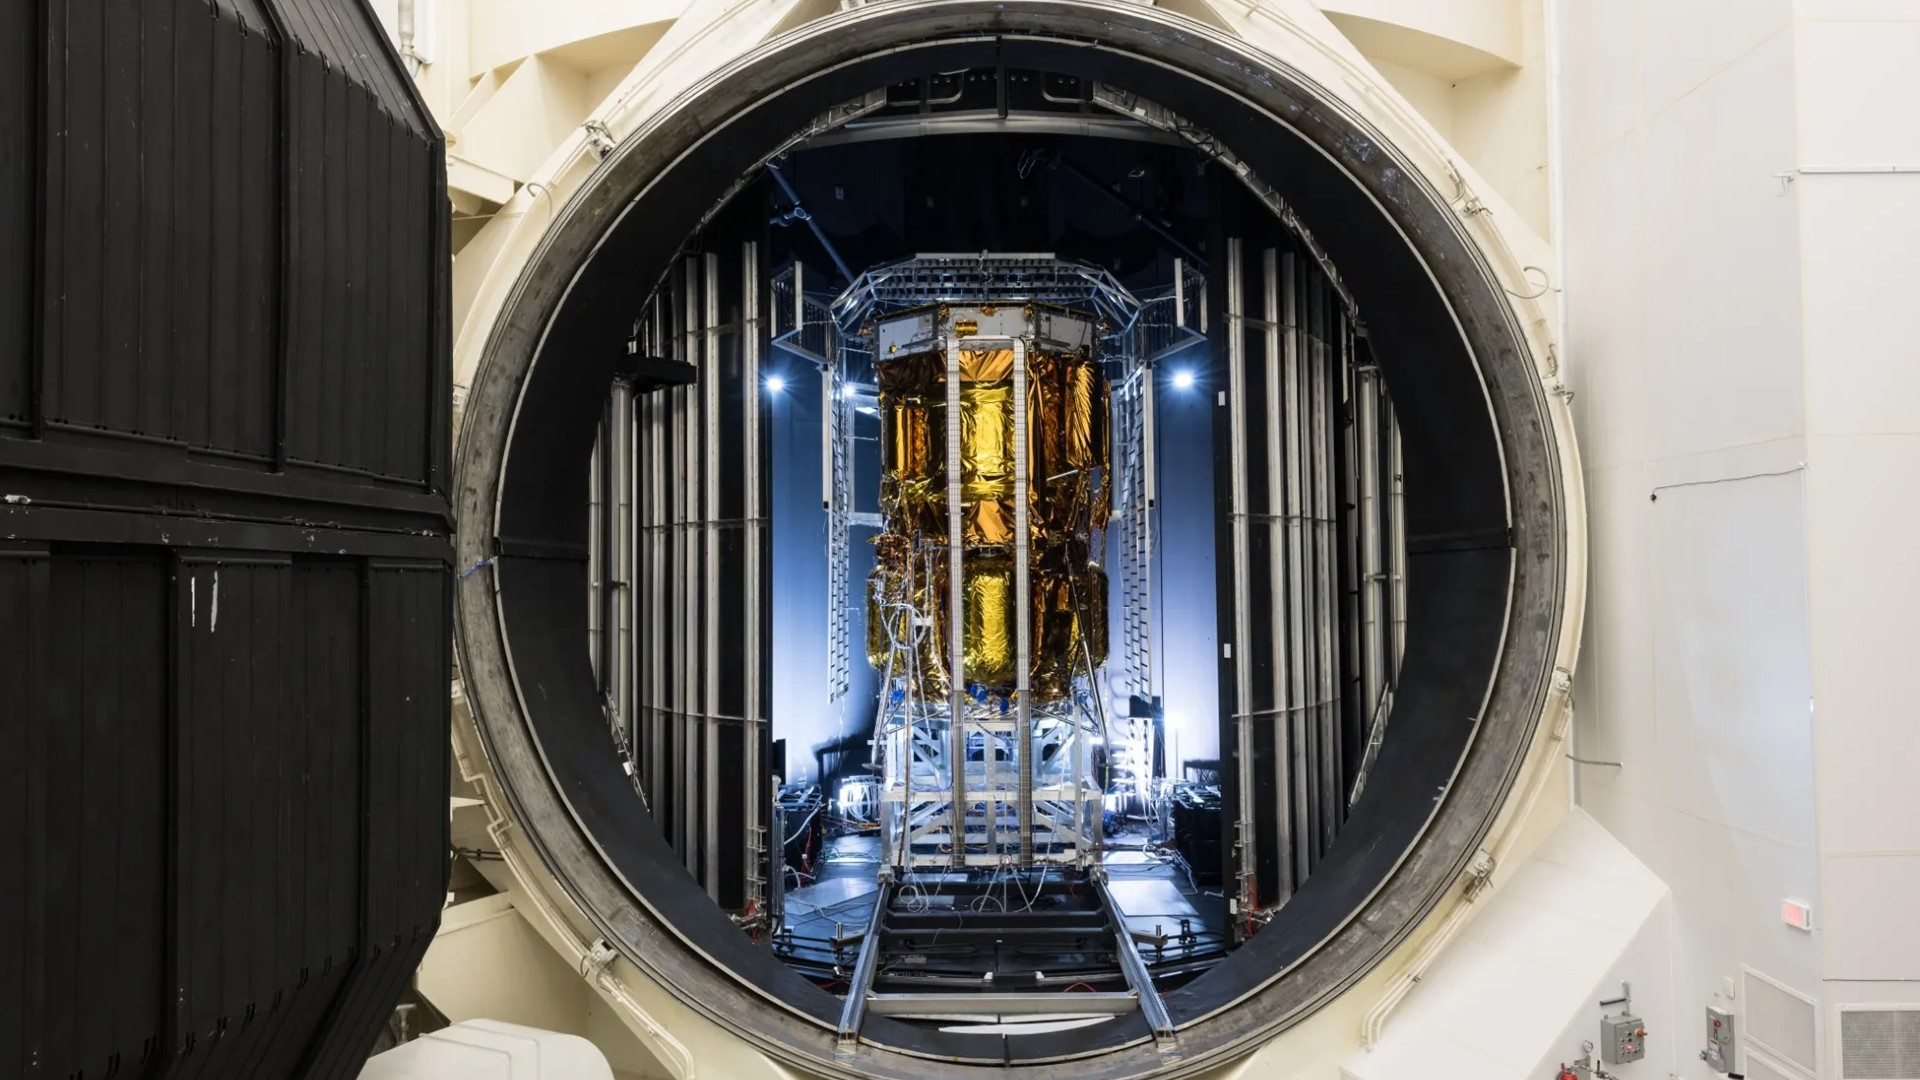
Blue Origin’s MK1 uncrewed moon lander completed its testing in the vacuum chamber. (Image credit: NASA/Blue Origin) Blue Origin’s moon lander has passed its tests in the vacuum chamber. This
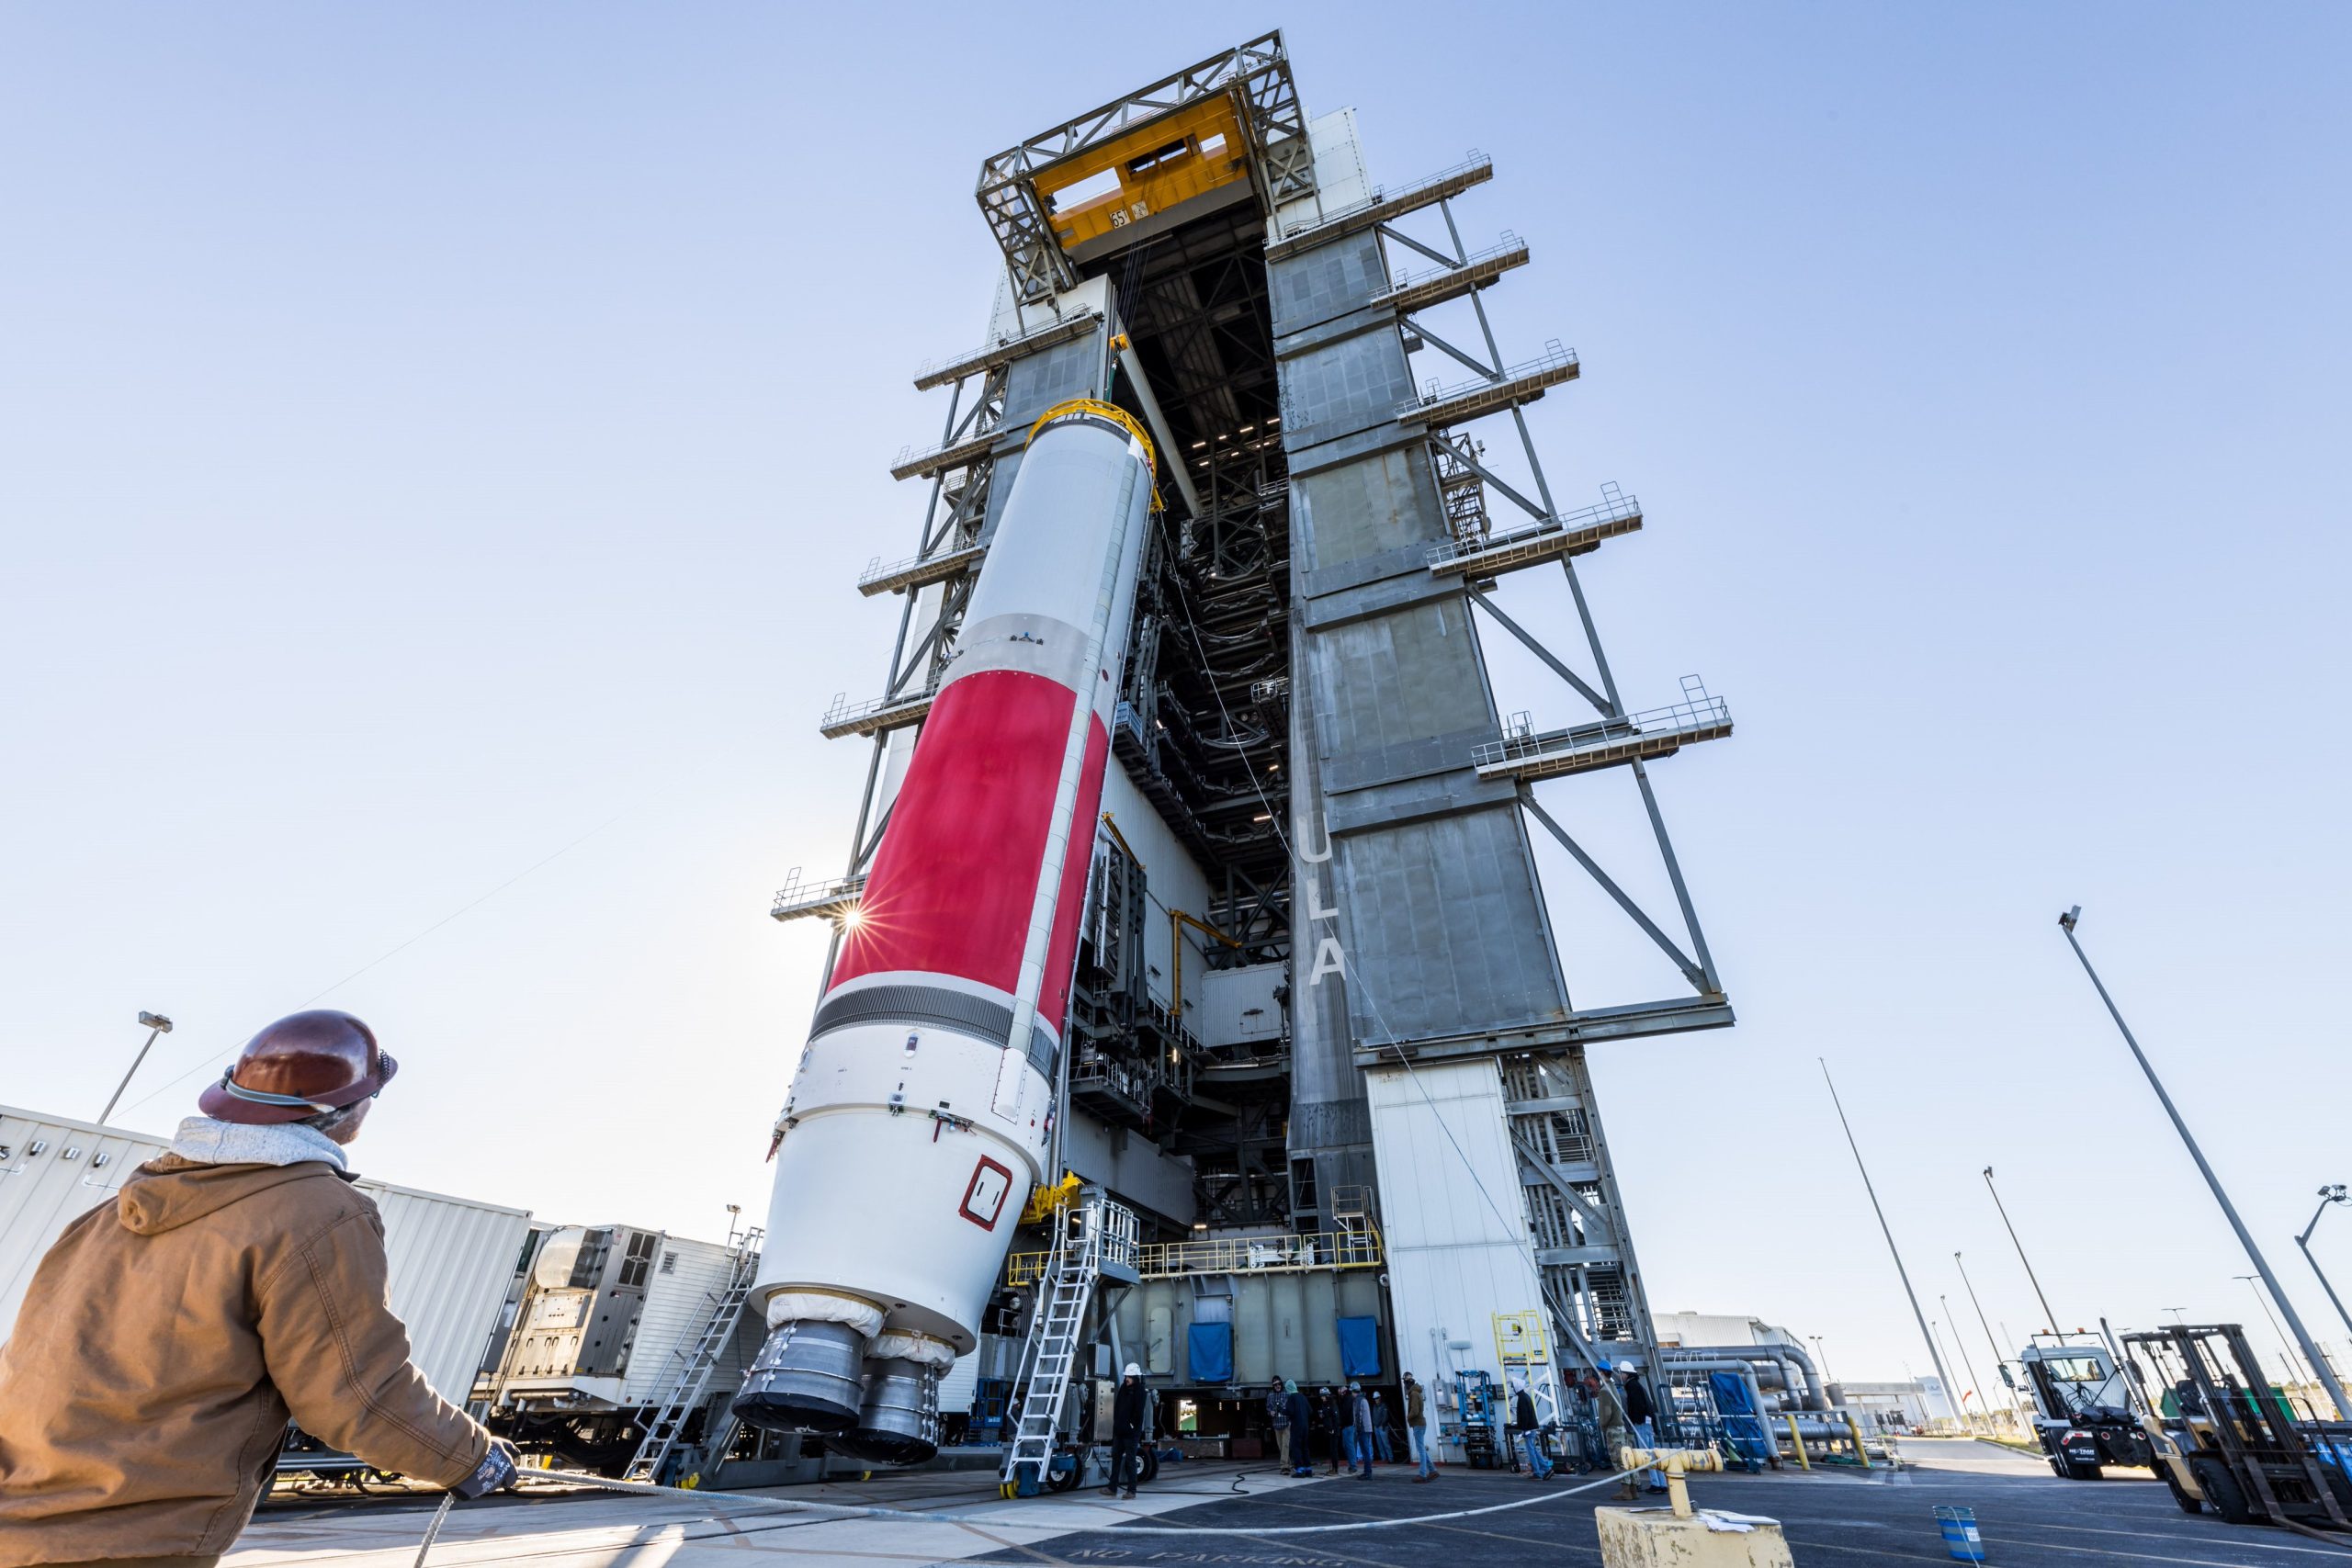
WASHINGTON — The U.S. Space Force is exploring whether it can resume flights of United Launch Alliance’s Vulcan rocket without using the solid rocket boosters now under investigation, a workaround
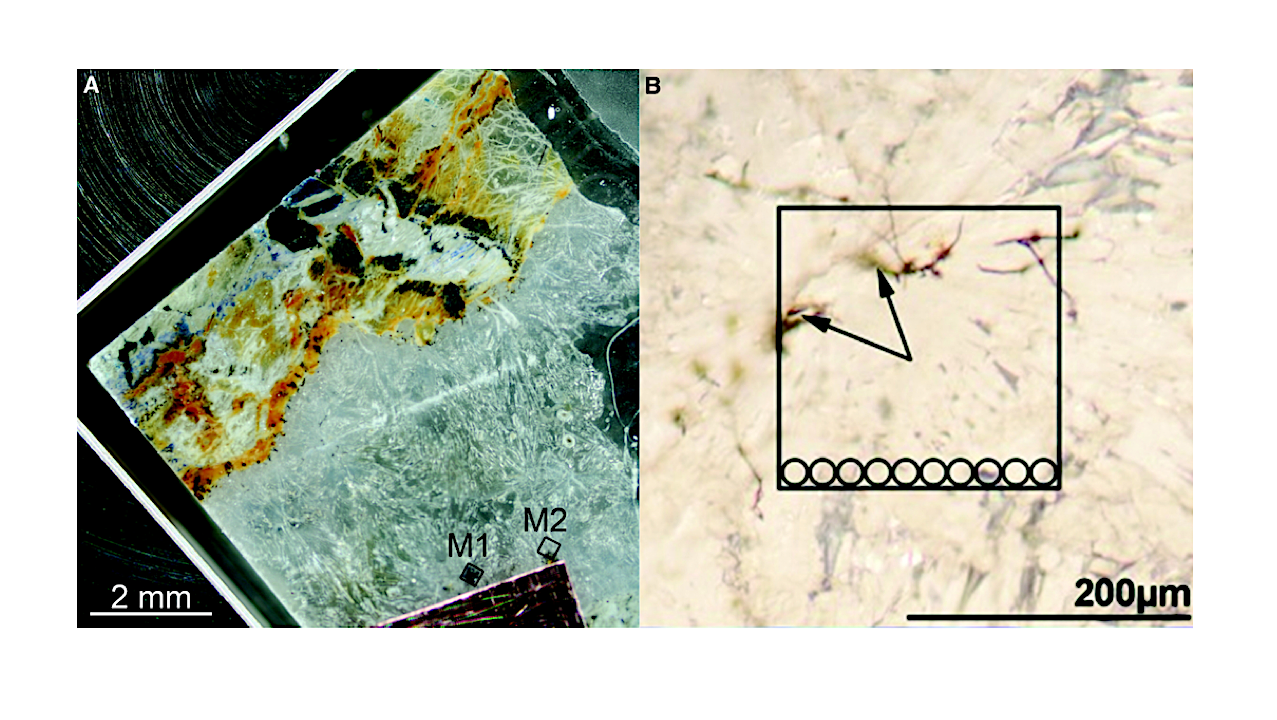
A: Microscope images of the aragonite host showing two survey areas (M1 and M2). B: Area M1 showing micrometer-sized fossil structures in more detail. Figure adapted from Tulej et al.,
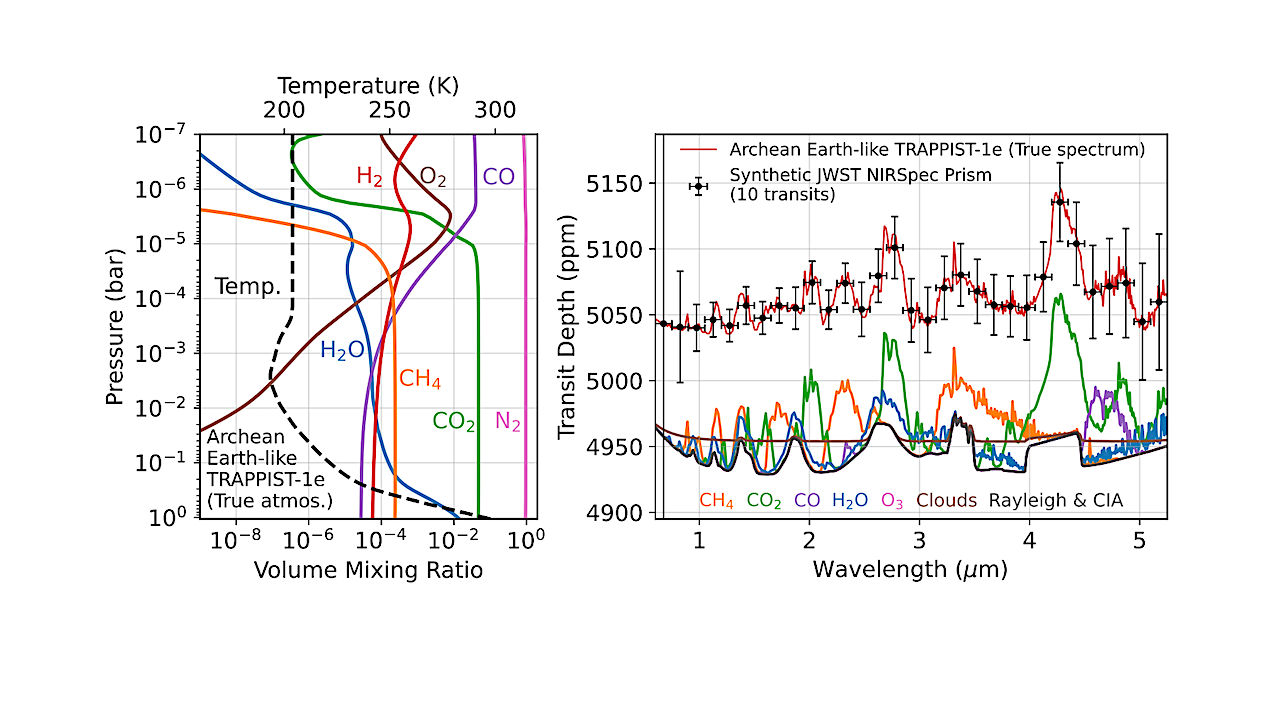
A simulated Archean Earth-like TRAPPIST-1 e, to which we apply our novel retrieval algorithm. Left: The modeled temperature profile (black dashed line) and mixing ratio profiles (solid color lines) of
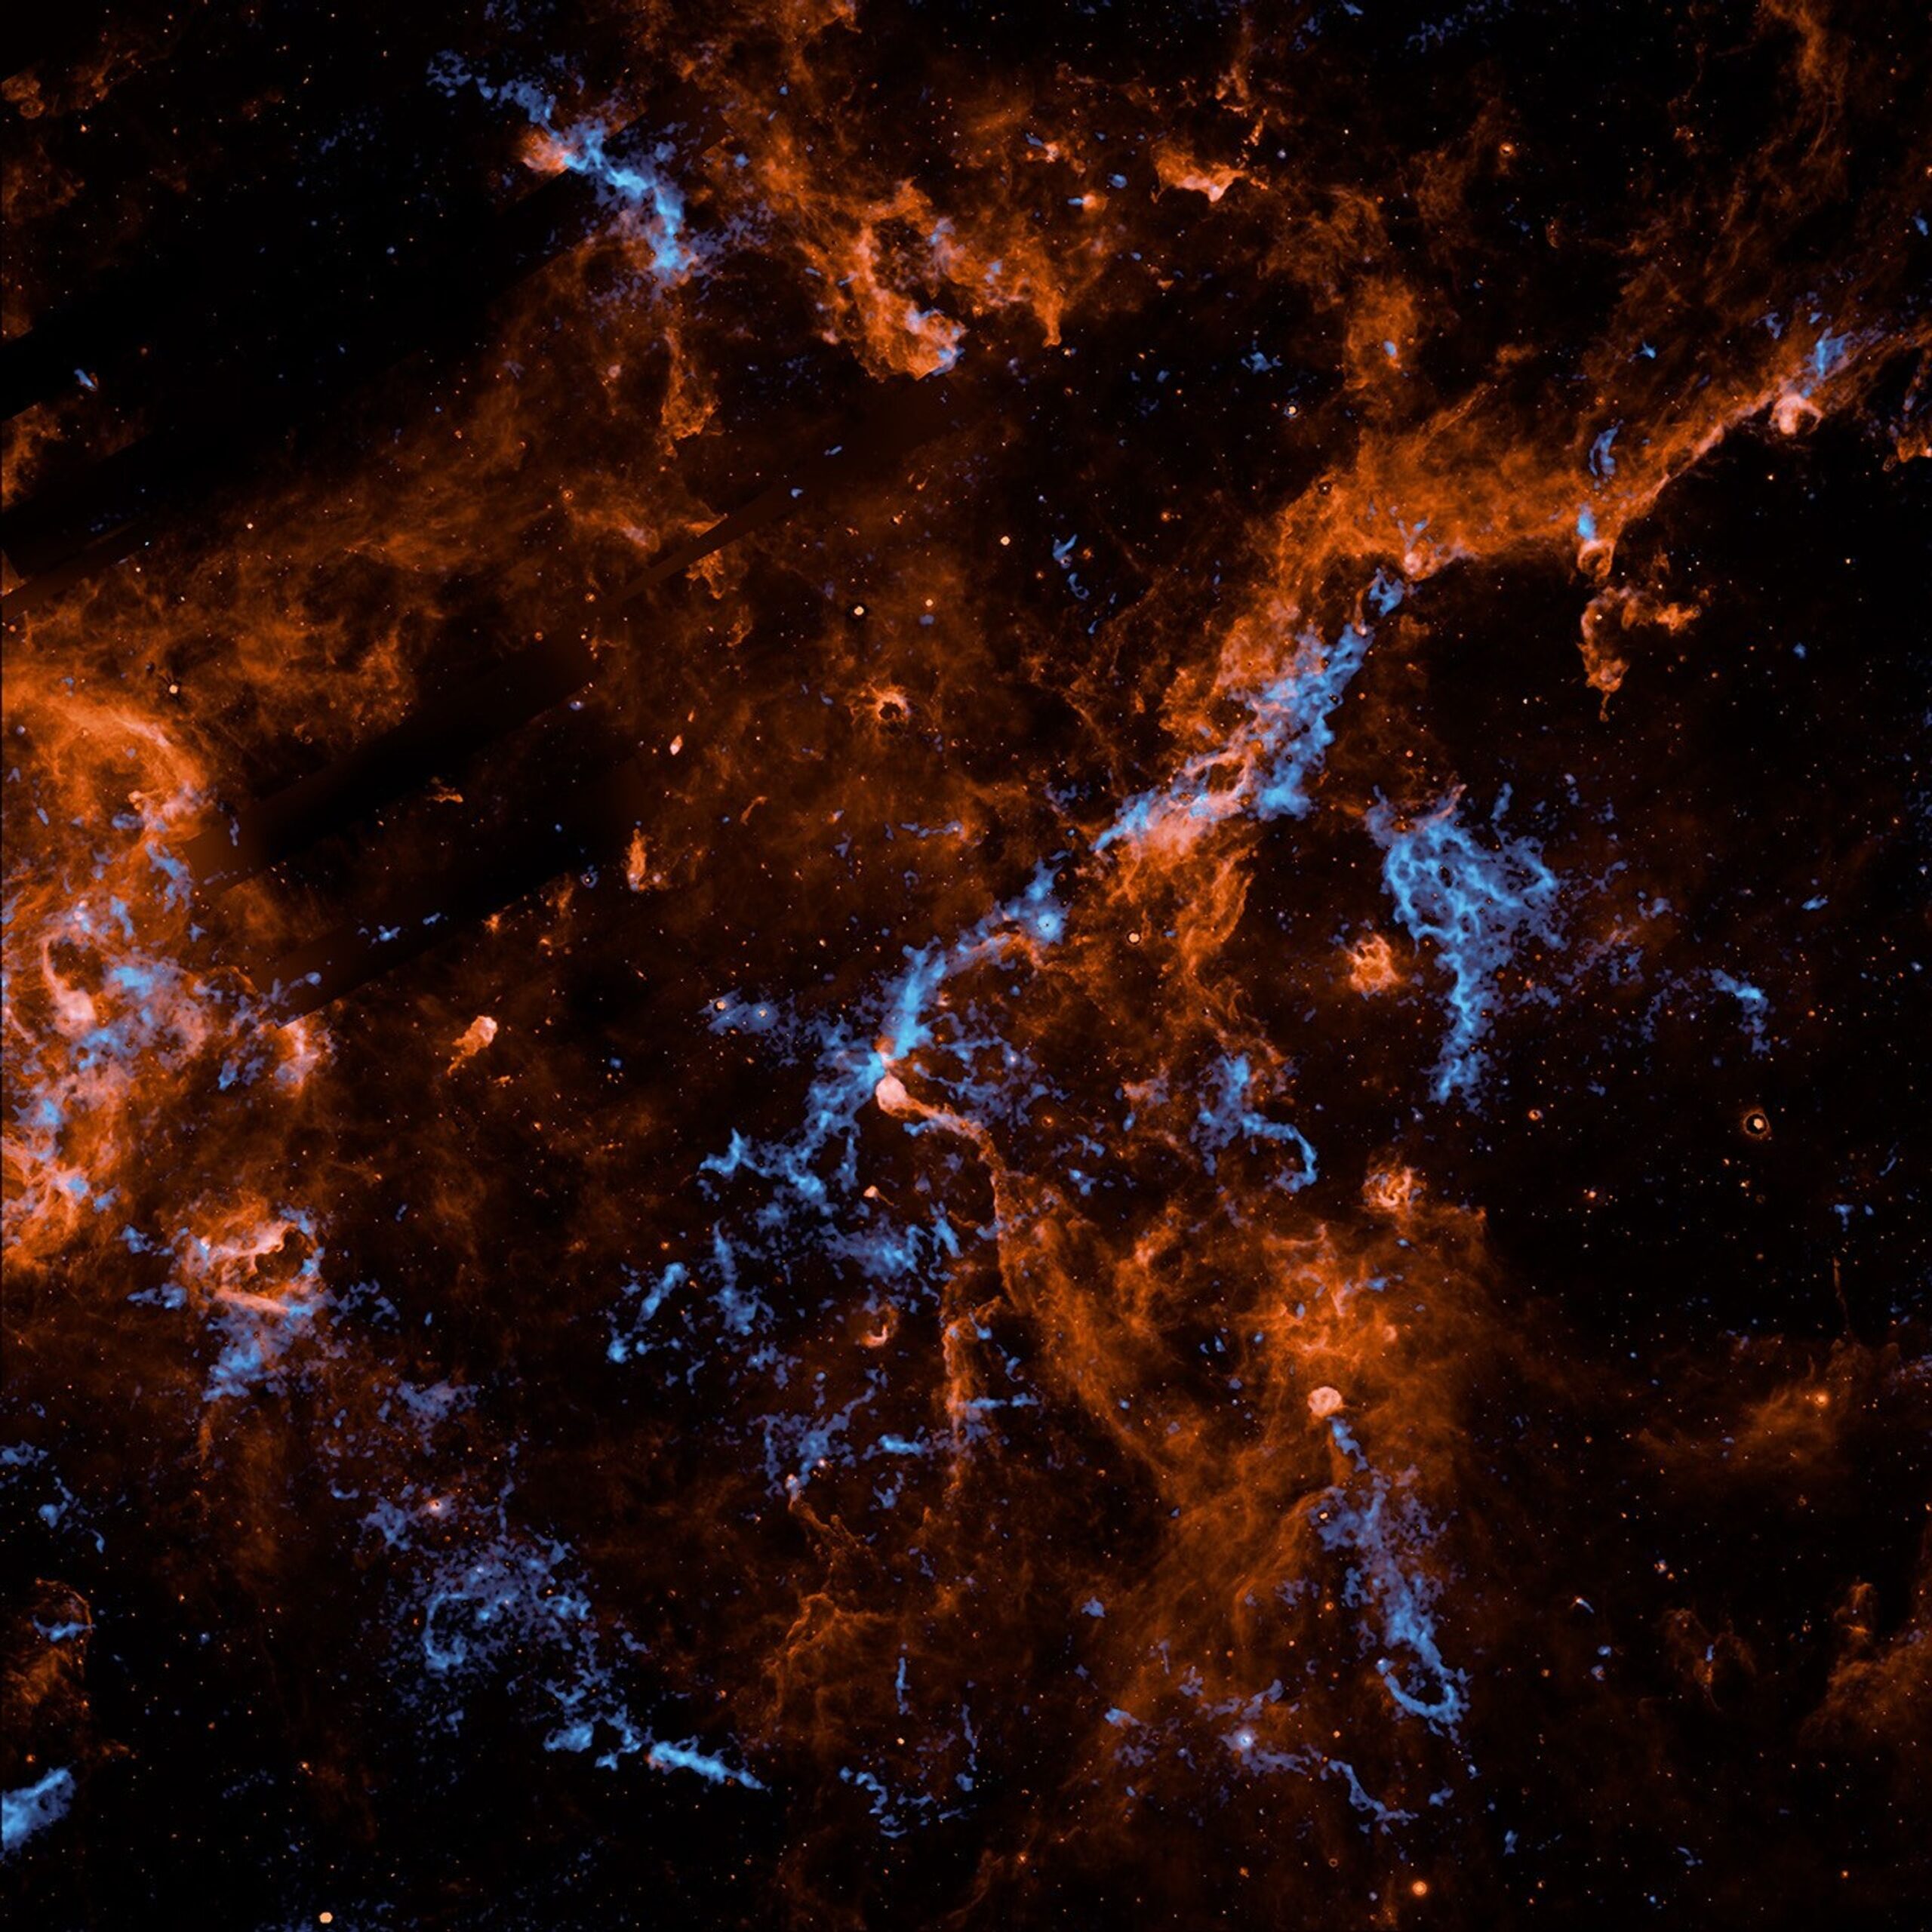
3 Min Read NASA’s SPHEREx Mission Maps Water Ice Throughout Cygnus X PIA26748 Credits: NASA/JPL-Caltech/IPAC/Hora et al. Photojournal Navigation Science Photojournal NASA’s SPHEREx Mission Maps… Photojournal Home Photojournal Search Latest
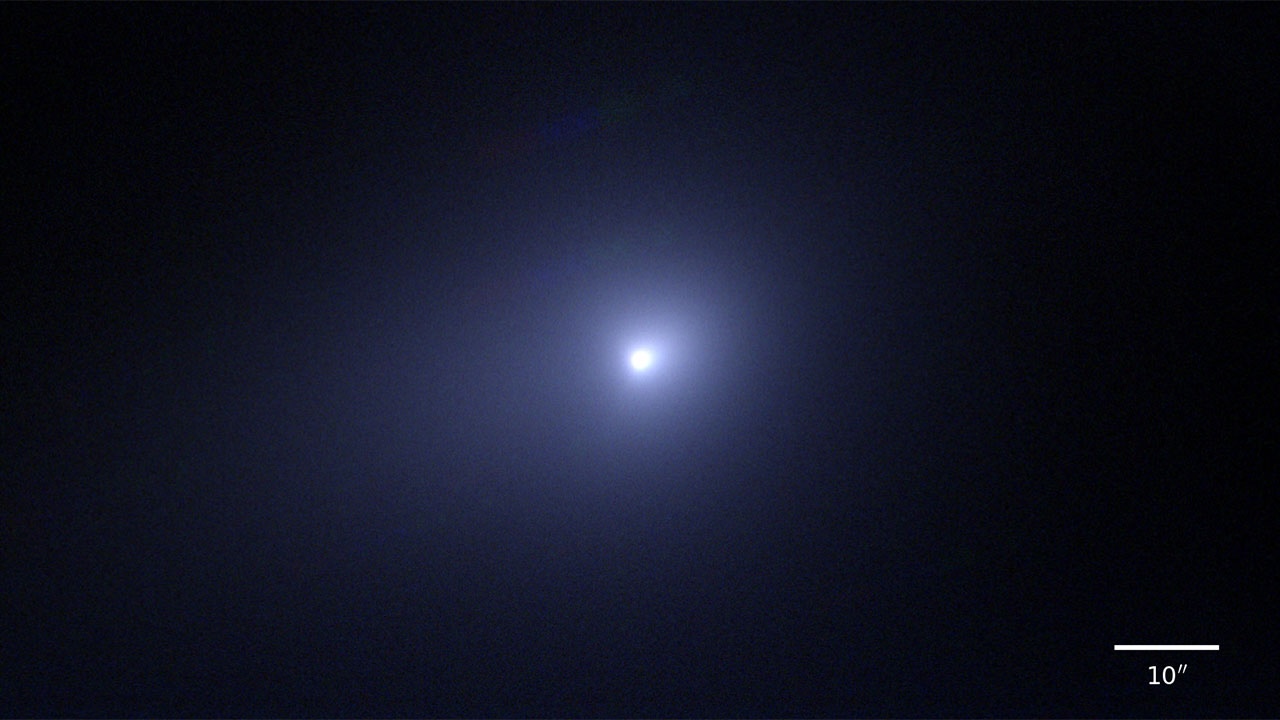
Interstellar comet 3I/ATLAS (C/2025 N1) captured by the Subaru Telescope on December 13, 2025 (Hawaii-Aleutian Standard Time). This image was created by combining three different wavelengths: V-band (550 nanometers, depicted